Dissertation zur Erlangung des Doktorgrades der Naturwissenschaften
Dem Fachbereich Biologie/Chemie der Universität Bremen vorgelegt von
Ulrich Franke
Prof. Dr. Gunter Otto Kirst Prof. Dr. Bo Barker Jørgensen
Prüfer
Prof. Dr. Friedrich Widdel Dr. Dirk de Beer
Weitere Mitglieder des Prüfungsausschusses
Dipl. Biologin Susanne Hinck Stud. rer. nat. Nina Linde
Acknowledgements
I would like to thank Prof. Bo Barker Jørgensen for accepting me as a PhD student and for supporting this work.
I am grateful to my mentor Dr. Gerhard Holst, who greatly supported me in numerous ways during the first 1.5 years of my PhD and introduced me into the “secrets” of the planar optode technique.
Dr. Markus Hüttel is thanked very much for a lot of help and for sharing his great experience in the field of sandy sediments from the planning of wave tank experiments, fruitful discussions all the way to critical manuscript reading.
Dr. Dirk de Beer is thanked for valuable discussions as well as numerous ideas concerning planing and enforcement of several studies.
I am very grateful to Lubos Polerecky, who supported me like a mentor and often it was his ability to separate important from irrelevant things that helped a lot, especially when the writing process started.
I’d further like to thank Prof. B. B. Jørgensen and Prof. G. O. Kirst for examination of this PhD thesis. Together with Prof. F. Widdel, Dr. D. de Beer, S. Hinck, and N. Linde they are also acknowledged for participating as committee members in the thesis defense.
Special thanks go to all the technicians that contributed to the construction of diverse experimental setups and electronic parts: Volker Meyer, Paul Färber, Harald Osmers, Georg Herz, Alfred Kutsche.
Claudia Schröder, Ingo Klimant and Gregor Liebsch are thanked very much for their supply with planar optodes, very pleasant times in Regensburg and helping me to start producing them here.
My long time office members, Björn Grunwald and Lubos Polerecky are thanked very much for a lot of help with trigger-boxes, cameras, nasty camera cards and computers, for discussion, and for keeping me in a good mood. Without their programming skills this work would not have been possible.
I am indebted to the following people for their help and technical assistance in the laboratory: Gabi Eickert, Ines Schröder, Anja Eggers and Cäcilia Wigand.
The “Mensa-team” Uschi, Rebecca, Markus, Eva, Henk, Björn, Lubos and Anja is thanked for disport, relaxing times which made the lunch and coffee breaks very pleasant times. The credit for every sentence in this thesis without grammatical or spelling errors as well as constructive comments go to Lubos, Peter, Rebecca, Uschi, Eli and Henk.
The German Federal Ministry of Education and Research (BMBF) and the Max-Planck-Society is acknowledged for providing funding of the work.
My parents are thanked very much for supporting me both financially and with their strong belief that I would finish the thesis some day and my grandmother for showing that high spirits make live much easier. My uncle Walter is thanked for the help of the development of the prototype of the squared sediment corer which is nicely working and extremely handy.
Most of all, I am deeply indebted to my family, Julia and Lilli their love and support also in times when PhD work and family life seemed a bit contradictory....
Table of contents
Thesis introduction... 6
Aim of the thesis ... 26
Overview of the enclosed Chapters ... 34
Chapter 2:... 36
Oxygen dynamics in permeable sediments with wave-driven pore water exchange Chapter 3:... 65
High spatial resolution measurements of oxygen consumption rates in permeable sediments Chapter 4:... 92
Wave tank study of particulate organic matter degradation in permeable sediments Chapter 5:... 123
Characteristics of porphyrin-based planar optodes: consequences for applicability in aquatic systems Chapter 6:... 141
Applications of porphyrin-based planar oxygen optodes and the modular luminescence lifetime imaging (MOLLI) system in aquatic environments Thesis conclusions ... 174
which the optodes can be used in aquatic applications will be specified and the causes of their limited applicability for highly accurate and rapid quantitative determination of oxygen distributions will be identified and discussed.
Oxygen measurements
The sediment-water interface is an important and highly active horizon of aquatic environments. Intense production and degradation of organic matter takes place within a relatively narrow zone leading to an intensive exchange of solutes and particulate organic matter between the sediment and the water column. Sediments, microbial mats, biofilms and other compact microbial communities (e.g., marine snow) occurring in aquatic environments are therefore characterised by steep gradients of various physical and chemical parameters, such as light intensity, pH and oxygen, over distances ranging from less than 0.5 mm to a few millimetres (Revsbech and Jørgensen 1986). The interface is typically not a flat horizon but is characterised by heterogeneities, both at micro- and macro-scale (Jørgensen and Des Marais 1990; Aller et al. 1998). These heterogeneities are related to several factors such as flow conditions, organic carbon input and usability, temperature, and macro- and micro-fauna activity.
Dissolved oxygen is one of the most important parameters in biological systems as it is the terminal electron acceptor for aerobic heterotrophic processes as well as for products of anaerobic organic matter degradation (Canfield et al. 1993). Therefore the knowledge of oxygen concentration gradients is of paramount importance in understanding the function and regulation of microbial communities.
Different types of oxygen sensors are used to determine oxygen concentrations at high spatial and temporal resolution, whereby generally two main functional principles can be distinguished: electrochemical O2 microsensors (O2 microelectrodes) and optical O2
microsensors (O2 microoptodes). Additionally, these two different sensor types can be
and can consequently measure oxygen at single points or one-dimensional profiles. Planar oxygen optodes, however, enable the measurement of oxygen distribution in two-dimensions
Electrochemical oxygen sensing
Since the introduction of electrochemical microsensors to microbial ecology, direct oxygen measurements with a resolution down to 50 µm have been possible (Revsbech et al. 1980). Probably the most frequently and widely used oxygen microsensor in environmental applications is the Clarke-type sensor (Revsbech 1989). It consists of an Ag/AgCl reference and a gold-coated cathode immersed in an alkaline electrolyte solution within a glass casing behind an ion-impermeable, but gas-permeable silicone membrane. The sensor tip of such an electrode is shown in (Fig.1). The measuring principle is based on the diffusion of oxygen from the outside through the silicone membrane towards the electrode and the reduction of oxygen at the cathode. An additional guard cathode prevents oxygen from diffusing from the bulk electrolyte towards the sensor tip.
Figure 1: Clarke-type oxygen microsensor. (A) Detailed view of the sensor tip. (B) Scheme showing the measuring principle. Figure from Kühl and Revsbech (2001).
Optical oxygen sensing
Optical methods have always played an important role in various fields of analytical science. Generally, the analyte interacts with an indicator and changes its optical properties. Colourimetry and photometry have been used to qualitatively determine chemical and biochemical species. A breakthrough resulted from the introduction of strip tests based on dry reagent chemistries allowing visual or instrumental evaluation of analytical results (Wolfbeis 1991). The pH paper stripe containing cellulose-immobilised pH colour indicator is probably the best known example. In the 1930`s Kautsky (1939) found that oxygen changed the luminescence properties of a specific fluorophore. After removal of oxygen the sensor regenerated after 1 - 2 seconds.
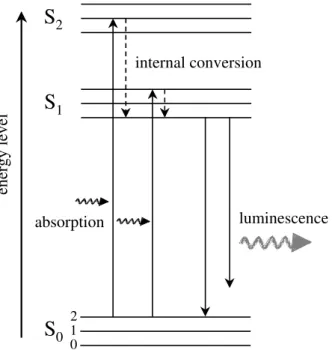
The optical oxygen measuring principle of the optodes used in this work is based on dynamic quenching of a fluorophore by oxygen. Oxygen molecules diffuse into a sensing layer where they react reversibly with the fluorescent dye. Upon absorption of excitation light, the electrons of the fluorophore molecule change from their ground energy level (S0)
to a higher energy level (S1 or S2). Because the excited state is energetically unfavourable
the electrons return back to their ground level S0 by emitting a quantum of luminescence
light (Fig. 2). This emission is altered by the presence of oxygen molecules. Collision of oxygen with the excited dye results in a decrease of the intensity and/or lifetime of the emitted luminescence (Lübbers 1995), as schematically shown in Figure 3. Lifetime is defined as the time-interval after which the luminescence intensity decreases to 1/e times the initial intensity.
Commonly used oxygen indicators are ruthenium-diimine or platinum-porphyrin complexes immobilised in a polystyrene matrix (Papkovsky et al. 1992; Liebsch et al. 2000). These dye complexes offer relatively large Stoke`s shifts between the excitation (blue and green light) and the emission (red light) maximum and allow the use of standard optical filters to separate ambient and excitation light from the luminescence (Liebsch 2000).
Figure 2: Simplified diagram of energy levels of an electron in a dye molecule. Absorption of a quantum of higher energy light (e.g., blue or green) leads to the excitation of the electron from its ground energy state (S0) to an excited state (S1 or S2). By emitting luminescence, the electron
returns back to its ground level. Internal decay due to thermal dissipation occurs, resulting in a longer wavelength of the luminescence compared to the absorbed light (so called Stoke’s shift).
Figure 3: Scheme of collisional quenching. (A) In the absence of oxygen the excited fluorophore returns to its ground state by emitting luminescence of higher intensity and longer lifetime. (B) When oxygen is present the luminescence is quenched, resulting in weaker intensity and shorter lifetime.
S
1S
0S
2 2 1 0 internal conversion luminescence absorption en er g y l ev el luminescence of high intensity absorption absorption luminescence of weak intensityA
B
where
τ
0,τ
and I0, I are the lifetime and intensity of luminescence in the absence andpresence of oxygen, respectively, Ksv is the quenching efficiency or Stern-Volmer constant,
O2 is the oxygen concentration and frac is the fraction of the luminescence which is
quenched by oxygen. The two point calibrations are usually done with the help of air saturated water and anoxic water or anoxic sediment samples at the experimental temperature and salinity as the oxygen solubility in water depends mainly on these two factors.
Oxygen microoptodes: Microoptodes were introduced into aquatic biology by Klimant et al. (1995). Their main advantage over microelectrodes is that they are easy and cheap to build, do not consume oxygen and feature good long-term stability. The measuring setup consists of an illumination module with the light source and optical filters, an optical fibre coupler, the optical microsensor, and a detection module with a fluorescence-detecting photomultiplier and a reference photodiode (Klimant et al. 1995). The sensor itself is constructed from a tapered optical fibre to which tip a thin layer of the sensor matrix is fixed. The optical fibre of the sensor is used for guiding both the excitation light to the dye at the sensor tip and the emitted luminescence signal to the photomultiplier (Fig. 4). Tip diameters are typically in the range of 30 – 50 µm, since smaller diameters would result in a strong decrease of the signal intensity (Klimant and Wolfbeis 1995; Holst et al. 1997).
Oxygen planar optodes: Several publications within the last decades have demonstrated that imaging of 2D solute distributions with luminescent indicators became a valuable tool in medicine, physics and biology. The first imaging systems were designed to measure oxygen concentrations and distributions of perfused tissue of rat livers (Rumsey et al. 1988) or oxygen partial pressures on skin surfaces and oxygen flux into the skin (Hartmann et al. 1997; Stücker et al. 1998; Liebsch 2000).
Figure 4: Schematic diagram of the measuring principle of microoptodes. (A) The excitation light is guided through an optical fibre and excites the oxygen sensitive dye at the sensor tip. (B) The emitted luminescence is guided trough the optical fibre and, after the excitation light is switched off, detected by a photomultiplier at the fibre end.
The first oxygen planar optode measuring system in aquatic science was introduced by Glud et al. (1996). Since then planar optodes have proven to be an attractive tool to measure heterogeneity and dynamics of oxygen concentrations in diverse aquatic systems such as photosynthetic and bioturbated sediments (Fenchel and Glud 2000; Holst and Grunwald 2001), permeable sandy sediments (Precht et al. 2004; Rasheed et al. 2004; Wild et al. 2004; Polerecky et al. 2005), corals and foraminifera (Holst and Grunwald 2001). First in situ measurements in photosynthetic and bioturbated sediments were also conducted (Glud et al. 2001; Wenzhöfer and Glud 2004).
In contrast to microoptodes, the sensor matrix containing the oxygen sensitive dye is deposited as a thin layer on a transparent support foil by a knife-coating process (Glud et al. 1996). The general imaging setup (see chapter 5, Fig.1) consists of the sensor fixed by transparent silicone to the inner wall of a transparent window of the experimental setup (e.g., an aquarium), a light source producing a relatively homogeneous light field to excite the optode, optical filters, a fast gateable CCD camera to image the luminescence, a trigger
A
B
taper
PVC tube
PVC tube fibre optical cable
excitation light on photomultiplier excitation light luminescence dichroic mirror cladding
sensor tip with dye
the excitation light field (Liebsch et al. 2000; König et al. 2001).
A modular luminescence lifetime imaging (MOLLI) system was developed and first applied in marine microbiology by Holst et al. (1998). All of the above described undesirable factors of the intensity-based system are eliminated when a lifetime-based approach is used. For example, lifetime-imaging does not depend on a homogeneous fluorophore distribution across the foil, intensity variations due to leaching and/or photobleaching or the excitation light field distribution. Background luminescence can effectively be suppressed if it has a different decay time compared to that of the oxygen-sensitive fluorophore (Liebsch et al. 2000; Holst and Grunwald 2001).
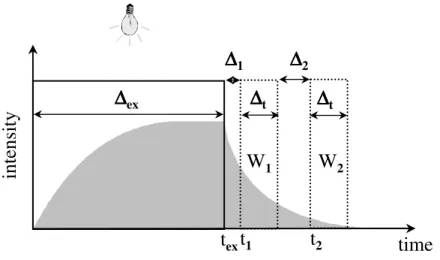
Image acquisition and calculation of lifetime images: In the MOLLI system, lifetime image is measured by employing a rapid lifetime determination (RLD) method (Ballew and Demas 1989; Liebsch et al. 2000) schematically shown in Fig. 5. Following a short square-shaped light pulse from LEDs, luminescence is detected quantitatively in two different time-windows, referred to as W1 and W2. Thus, two integrated intensity images
are obtained whose ratio is in each pixel related to the respective luminescence lifetime of the used indicator in the sensing layer. This ratio (W1/W2)is virtually independent of the
overall signal intensity. When assuming a mono-exponential decay of luminescence intensity (i.e., a single lifetime) and an equal width of both windows (∆t), the lifetime (τ) can be calculated as (e.g. Holst and Grunwald 2001):
τ = (∆t + ∆2) / ln (W1/W2), (2)
Figure 5: Scheme of the rapid lifetime determination (RLD) method. The fluorophore is excited by a short light pulse (∆ex). After a certain time interval (∆1) following the end of the light pulse, the emitted luminescence is detected (e.g., by a CCD camera) during two equally long time-intervals (∆t) separated by a gap (∆2). The luminescence lifetime (τ) can be calculated from the ratio of the intensities Iw1 and Iw2 measured during the first and second time-intervals (window 1
and 2). See text for more details.
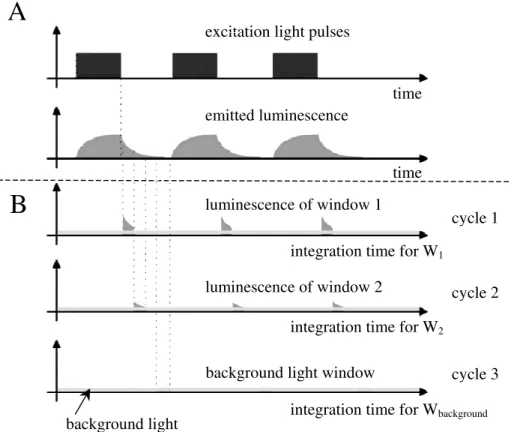
For the actual calculation of the lifetime distribution using the “two-window” approach, the data acquisition process is separated into three measuring cycles (Fig. 6). Within each cycle the excitation light source is switched on for a certain amount of time to allow for a build-up of luminescence. Then the light source is switched off and, with a certain time delay (∆1, see Fig. 5), the camera shutter is opened for the duration ∆t of the window W1, allowing the luminescence as well as the ambient background light to reach the CCD chip of the camera. This series of events is repeated within the cycle 1 and the luminescent light is integrated on the CCD chip. Thereafter the data of W1, referred to as the image
“window 1”, is read out by the computer and stored in the memory. Then cycle 2 starts, whereby the camera shutter is opened for the duration ∆t of the window W2 after a longer
time delay compared to cycle 1, namely at time t2 (see Fig. 5). After these events have been
repeated and the luminescent light has been integrated, the image “window 2” is transferred to the computer and the third cycle starts. In contrast to cycles 1 and 2, the excitation light is not switched on in cycle 3 and the camera shutter is opened again for the duration ∆t. During this time, ambient background light is recorded by the CCD chip and transferred to the computer. This background image is subsequently subtracted from image “window 1” and “window 2” and all three images are stored on the hard disk of the computer as 12-bit TIFF images. To improve the signal-to-noise ratio of the acquired images, each cycle can be repeated and the corresponding images are averaged.
time
in
te
n
si
ty
t
1t
2t
ex∆
∆
∆
∆
ex∆
∆
∆
∆
t∆
∆
∆
∆
1∆
∆
∆
∆
2∆
∆
∆
∆
tW
1W
2Figure 6: Scheme of the triggering and timing of the excitation light source and camera detecting the luminescence signal implemented in the MOLLI system. Panel (A) shows the general timing of the excitation light pulses and the corresponding luminescence, which is repeated for all three measuring cycles. The luminescence signal may be superposed with the background light of constant intensity. Panel (B) shows the cycles during which the camera integrates the luminescence signal of the windows 1 and 2 (see Fig. 5) and the background light used for the background correction of the two windows. Figure modified after Holst and Grunwald (2001).
The dynamic range of lifetime values for the porphyrin-based planar optodes utilised in our measurements was typically between 15 and 65 µs at air saturation and zero oxygen concentration, respectively. The measurements settings used for the data acquisition were selected as ∆ex = 20 µs, ∆t = 10 µs, ∆1 = 1 µs and ∆2 = 0 µs. With the time of a single cycle typically ranging between 50 and 300 ms, selected so as to detect enough luminescence for “window 1” and “window 2”, the described events within one cycle were repeated between approximately 1000 to 7000 times.
B
luminescence of window 1luminescence of window 2
background light window
integration time for W1
integration time for W2
integration time for Wbackground
cycle 2
cycle 3 cycle 1
Transport mechanisms and exchange processes in marine sediments
The sediment bed is the most important site for accumulation, storage and biogeochemical transformation of organic matter in shallow aquatic environments (Canfield et al. 1993). These processes are linked to the overlying water by transport of solutes and particles into and out of the sediment (van Rees et al. 1996). The transport mechanisms in marine sediments are either molecular diffusion or mass flow processes. Diffusion is restricted to solutes and is driven by concentration gradients whereby no net water or sediment transport occurs. In contrast, mass flow processes are independent of concentration gradients but rely on net water and/or sediment transport and include not only solutes but also particles. Water transport is caused by bioirrigation activity of fauna or physical forcing (porewater advection), sediment is transported either by bioturbating fauna (reworking activity) as well as by bedform migration driven by bottom water hydrodynamics. When the bottom flows are weak, fine-grained sediments (cohesive sediments) can accumulate, whereas frequently occurring stronger bottom currents, which resuspend and winnow the sediment, will result in coarse-grained sediments.
Transport mechanisms in cohesive sediments
Molecular diffusion: In fine-grained deposits such as silty and muddy sediments (grain size ≤ 63 µm) the porewater is virtually unmoveable and physical solute transport is restricted to molecular diffusion. Net transport in diffusive processes is driven by thermally-induced random movement of molecules along solute concentration gradients from sites of high to low concentrations, corresponding to sources and sinks of the solutes, respectively. Fick`s first law of diffusion describes the flux (J) of solutes which is proportional to the height of the vertical concentration gradient (dC/dz) (e.g. Crank 1975):
J = - D0 (dC/dz) (3)
where D0 is the substrate-dependent diffusion coefficient in water at a given temperature
and salinity.
Within sediments, diffusion occurs only in the porespace. As molecules have to take longer paths around the sediment particles to diffuse from high to low concentrations the effective diffusion coefficient in sediments is lower than in water. Fick`s first law must be modified to account for these constraints as:
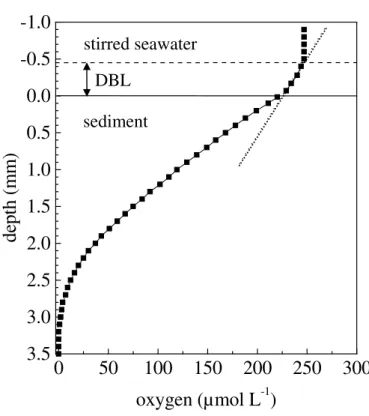
velocity decreases (velocity at the sediment surface is zero) and just above the sediment a linear oxygen decrease is determined. This region, typically 0.2 – 1.2 mm thick in marine environments (Jørgensen 2001), was termed diffusive benthic boundary layer (DBL) as molecular diffusion is the only transport mechanism within this layer (Jørgensen and Revsbech 1985).
Figure 7: Typical oxygen profile measured with a Clarke-type microsensor in muddy sediment (Weddewarden, German North Sea). The thickness of the diffusive boundary layer (DBL) was approx. 450 µm. A line was fitted to the oxygen gradient within the DBL (dotted line). Horizontal lines indicate sediment surface (solid line) and the upper-most border of the DBL (dashed line).
0
50
100
150
200
250
300
3.5
3.0
2.5
2.0
1.5
1.0
0.5
0.0
-0.5
-1.0
d
ep
th
(
m
m
)
oxygen (µmol L
-1)
DBL stirred seawater sedimentThe total oxygen uptake rate of the sediment will be restricted to the integrated total oxygen consumption in the upper most sediment layer as the maximum concentrations of oxygen in the bottom water and the oxygen consumption rates in the sediment will limit the maximum solute flux and the maximum distance which can be reached by diffusion (Jørgensen 2001). When very steep oxygen gradients between the sediment and the overlying water are present due to high sedimentary oxygen consumption rates, the DBL may completely limit oxygen consumption rates (Jørgensen and Revsbech 1985).
According to a simplified version of the Einstein-Smoluchowski relation the mean distance (∆x) which a molecule can cover by diffusion in a certain time (∆t) can be estimated (Adam et al. 1988):
∆x2 = 2 × D × ∆t (5)
where D is the diffusion coefficient of the solute. The fact that the time a molecule needs to cover a certain distance increases with the square of the distance, explains why transport by molecular diffusion is only efficient over short distances, one of the major characteristic of molecular diffusion.Therefore, in diffusion-dominated environments established solute distributions are relatively stable. However, when dramatic changes of the solute consumption in the sediment or concentration of the solute in the overlying water occur, this can result, e.g., in significant change of the oxygen penetration depth.
Solute exchange over the sediment-water interface in muddy sediments may be largely increased by benthic macrofauna due to bioirrigation and bioturbation activity (e.g. Aller 1982). The magnitude of biological transport relative to diffusive processes is primarily controlled by the abundance and activity of benthic macrofauna organisms. For coastal marine sediments, the balance between molecular diffusion and fauna mediated solute exchange is roughly 50 – 50 % (Jahnke 2001). Molecular diffusion prevails in muddy sediments only where benthic macroorganisms are absent, such as anoxic basins (e.g. large areas of the deep parts of the Baltic Sea) or where their abundance is relatively small (e.g. the majority of deep sea locations). Usually biogenic transport is most intense in the uppermost sediment layer near the sediment-water interface, where benthos is numerous due to the presence of oxygen. The presence of burrow-building, bioirrigating fauna, i.e. filter-feeding organisms, will increase the solute exchange by enlarging the potential effective exchange area from the visible sediment surface also to the burrows walls within the sediment (Aller 1988; Kristensen 1988; Wenzhöfer and Glud 2004). Although the final
volumes of surface water for nourishment and respiration through their burrows by ventilation activity. Thereby oxygen-rich surface water is pumped into deeper sediment depths and vice versa. Filter-feeding may provide a rapid and efficient pathway for solutes and particulate matter into and out of the sediment and locally increases the oxygen penetration depth (Riisgard and Larsen 2000; Aller 2001). Often burrows are only flushed periodically which will result in temporally unstable redox conditions (Kristensen et al. 1985). When no ventilation activity is present, the burrow typically will get anoxic, allowing NH4+, Fe2+,and Mn2+ to diffuse into the burrow lumen.
The magnitude of temporal and spatial heterogeneity of the geochemical zonation will therefore be influenced by periodically burrow ventilation activity and the complex three-dimensional structure of the burrows (Aller 1994; Wenzhöfer and Glud 2004), in contrast to the more stable and horizontally laminated zonation, which is predominant when fauna is absent in diffusion-controlled sediments.
Bioturbation activity: The search for food and the construction of burrows (bioturbation activity) may effectively mix the upper sediment horizon and disrupt the original stratification of the sediment, which will result in enhanced exchange rates of solutes (Aller 1982) as well as in the transport of particles across the sediment-water interface and within the sediment (Graf and Rosenberg 1997). Physical reworking of the upper sediment layer by supercritical bottom flow can have a similar effect (Wheatcroft 1992).
Transport mechanisms in coarse-grained permeable sediments
The above described transport mechanisms are also present in sandy sediments, but as they are characterised by larger grain-sizes than cohesive sediments, porewater can flow through the interstices. This permits an additional transport mechanism called advection by means of physically induced mass flow of porewater.
Advection: Advective porewater flow is always driven by pressure gradients, which are counteracted by friction in the porespace depending on viscosity of the fluid medium and
the permeability of the sediment. Darcy`s law describes the relation between the porewater flow velocity (u), the sediment permeability (k) and porosity (
φ
), the porewater viscosity (µ) and the spatial pressure gradient (∇p):u = (k/
φ
× µ) × ∇p (6)Sediment permeabilities exceeding 1 × 10-12 m2 allow advective porewater flow driven by pressure gradients that is faster than diffusive transport, whereby significant porewater flow trough the upper layers of sandy sediments can be caused by pressure gradients of less than 1 Pa Huettel and Gust (1992a). Pressure gradients in aquatic sediments may originate from density gradients (density-driven convection), unidirectional currents (current-induced advection) or waves (wave-induced advection). In the following section only current and wave-induced advection are discussed in detail.
Current-induced advection
Figure 8 schematically shows the pressure field around a sediment mound with direction and magnitude of the porewater flow velocities in a flume experiment with unidirectional flow conducted by Huettel et al. (1996).
Figure 8: Scheme of unidirectional water flow (dashed lines) in a straight open channel deflected by a protruding topography, the associated pressure field (solid line) and the corresponding advective porewater flow field. Shaded areas show water intrusion zones, arrows in the sediment indicate direction and magnitude of advective porewater flow. Figure modified after Huettel et al. (1996).
distance (mm)
flow (10 cm s-1) = 10 mm h-d
ep
th
(
m
m
)
p
re
ss
u
re
(
P
a)
sediment waterburrows, mounds, shells, or benthic organisms resting on the sediment surface (Huettel and Gust 1992a; Huettel et al. 1996). It was found that the pressure gradients are positively correlated with the bottom water flow velocity as well as the height of the obstacles.
A characteristic porewater circulation pattern will develop around an obstacle under unidirectional flow. Up- and downstream of the obstacle, where high pressure is present, bottom water is forced into the sediment, whereas at the low pressure region porewater leaves the sediment. As the low pressure centre is not directly located at the highest point of the obstacle in unidirectional flow systems, porewater leaves the sediment at the downstream flank of the obstacle resulting in an asymmetrical circulation pattern (Fig. 8). Because the water volume which is forced into and out of the sediment has to be balanced and the fact that the areas of intrusion are bigger than extrusion, the porewater velocities have to be higher in the upwelling region compared to the regions of intrusion. Several flume studies using dyes to visualise porewater flow showed this porewater flow pattern (Thibodeaux and Boyle 1987; Huettel and Gust 1992a; Huettel et al. 1996; Elliott and Brooks 1997). Generally the vertical extension of the porewater flow field in sediments with a homogeneous permeability equals approx. the ripple wavelengths (Rutherford et al. 1995). Porewater velocities can range from mm h-1 and cm h-1 (Savant et al. 1987; Huettel and Gust 1992a; Huettel et al. 1996) up to m h-1 in gravel beds exposed to fast bottom flow as can be found in river environments (Thibodeaux and Boyle 1987).
Wave-induced advection
When the water depth is lower than half of the wavelength of surface gravity waves, oscillating bottom flow near the sediment surface occurs (Shum 1992).
Flat bed: The passage of surface gravity waves introduce hydrostatic pressure gradients caused by wave crests and troughs at the sediment surface, which will set the porewater into pulsing rotation. Riedl et al. (1972) introduced the term “subtidal pump” and proposed based on field observations that this mechanism could lead to enhanced exchange rates
between the sediment and the overlaying water. The same process was described by Rutgers van der Loeff (1981) as enhanced diffusivity in the upper most sediment layer of sandy sediment under low and moderate wave action.
Malan and McLachlan (1991) developed an in situ benthic chamber setup with flexible tops to allow “wave pumping” activity within the chamber. These authors could show that oxygen consumption and solute fluxes were correlated with wave action. Wave tank experiments focusing on solute exchange processes by Precht and Huettel (2003) suggested that the effect of “wave pumping” might be of minor importance as its separation from advection induced by wave-driven oscillatory bottom currents is not easy. This advective process will occur at the same time when sediment topography is present but is based on a totally different mechanism that will be described below.
Rippled bed: Advection through permeable sediments due to the interaction of oscillating boundary layer and sediment topography has been measured by Webb and Theodor (1968) and Webb and Theodor (1972). Their in situ experiments in sandy sediments showed that dye injected into sediment ripple troughs tended to exit the sediment at ripple crests, suggesting the existence of porewater circulation cells, whereby the flow rate of the porewater depended on the surface gravity wave height and the permeability of the sediment. The same physical principle as in unidirectional flow systems drives the advection where oscillating bottom flow interacts with obstacles protruding into the water column: Pressure differences develop, e.g., over a ripple sediment bed, as accelerated flow above ripple crests causes lower pressure than in ripple troughs.
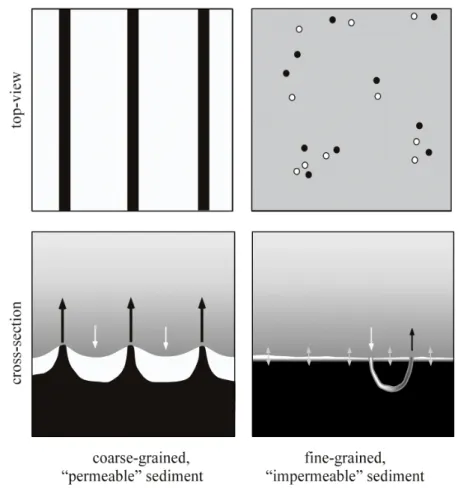
A two-dimensional computational model was presented by Shum (1993), which calculated the trajectories of porewater particles under a rippled sediment bed over one wave period. The model suggested that porewater flow could extend down to sediment depths of several ripple heights over a wide range of wave conditions and sediment characteristics. In contrast to unidirectional flow, the porewater circulation pattern is symmetric (caused by similar strengths of the bottom flow in both directions), with porewater leaving the sediment at the ripple crest and overlying water forced into the sediment at the ripple flanks and troughs (Fig. 9) as observed by Webb and Theodor (1968) and Webb and Theodor (1972) and proposed by Shum (1992). This flow pattern was approved recently by wave tank experiments (Precht and Huettel 2003; Precht et al. 2004) as well as in situ experiments (Precht and Huettel 2004). Wave-induced porewater velocities ranged from 2 – 50 cm h-1 in a wave tank experiment (Precht et al. 2004) with decreasing velocities towards deeper sediment depths. In situ experiments showed median
Figure 9: Comparative overview of the general porewater flow fields in permeable sediments under unidirectional (A) and oscillating bottom flow (B). Porewater is released close to the ripple crest at ripple flanks or directly at ripple crests driven by unidirectional flow (A) and oscillatory flow (B), respectively. Figure modified after Precht and Huettel (2004).
Consequences of advective transport
Advective transport of solutes: When the interaction of boundary-layer flow and sediment topography enables dynamic advective porewater flow, the solute exchange at the sediment-water interface can exceed transport by molecular diffusion by several orders of magnitude. In the presence of small mounds (height ≤ 2,5 cm) the interfacial water exchange was measured as dye release into the overlying water and fluxes up to 3 orders of magnitude compared to molecular diffusion were calculated (Huettel and Gust 1992a). Wave tank experiments conducted by Precht and Huettel (2003) revealed that the total exchange over the sediment-water interface of a rippled bed with oscillating bottom flow was up to 50 times the exchange rate by diffusion and 2 – 15 times the advective exchange over a flat bed.
Any solute in the water column and the porewater can be transported relatively fast across the sediment-water interface and within the sediment by advection. Electron acceptors such as oxygen can be supplied at high rates to the sedimentary organisms.
Laboratory (under unidirectional as well as oscillatory bottom flow) and in situ measurements experiments showed that advective supply of oxygen can result in fairly deep oxygen penetration depths in the range of several centimetres (Forster et al. 1996; Lohse et al. 1996; Ziebis et al. 1996; Precht et al. 2004; Reimers et al. 2004; de Beer et al. 2005). Indications for an effective advective removal of dissolved inorganic nitrogen species, silicate and phosphate was inferred from hydrodynamic conditions, low porewater concentrations as well as from the shape of porewater concentration profiles (Gehlen et al. 1995; Marinelli et al. 1998; D'Andrea et al. 2002). Additionally inhibitory products such as ammonium and hydrogen sulphide are effectively removed (Ziebis et al. 1996; Huettel et al. 1998).
It is considered that microbial organic matter degradation is increased by enhanced solute exchange (Forster and Graf 1995; Aller and Aller 1998). The supply with oxygen and sulphate has been identified as key factor determining remineralisation rates (Froehlich et al. 1979; Jørgensen and Sorensen 1985; Enoksson and Samuelsson 1987). Furthermore, transfer of nutrients as well as electron acceptors towards surface-associated sedimentary bacteria might be increased in the presence of fluid flow (van Loosdrecht et al. 1990; Logan and Kirchman 1991). All of these processes will have considerable consequences for biogeochemical processes and sediments influenced by advective processes may thus be considered as favourable locations for microbial communities showing increased metabolic activity.
Heterogeneous complex three-dimensional spatial distributions of solutes will be caused by the combination of biogeochemical reactions and advective transport processes. This could be shown for the biologically important solute oxygen in laboratory studies under unidirectional as well as oscillatory boundary flows (Ziebis et al. 1996; Precht et al. 2004). Advective porewater flushing caused a largely increased oxygenated sediment volume as well as zones where anoxic porewater reached the sediment surface, whereby the oxic-anoxic transition zone was greatly enlarged. Therefore not only vertical but also horizontal oxygen gradients of similar steepness developed as predicted by models for wave-induced advection in permeable sediments with rippled surface topography (Shum 1993). Huettel et al. (1998) also showed this complex pattern for NO3-, NH4+, Fe2+ and Mn2+ in a flume
study. Up- and downstream of the sediment mounds, high concentrations of nitrate due to enhanced nitrification was detected in the advectively oxygenated sediment volumes. In contrast, high concentrations of NH4+, Fe2+ and Mn2+ were present in the anoxic upwelling
also much faster. Sediment ripple propagation velocities of a few cm h-1 to more than 50 cm h-1 were recorded (Rutherford et al. 1993; Traykovski et al. 1999; Doucette et al. 2002). One possible exception to these predominantly fast changes due to topography features could be the development of stationary topography features, e.g., stationary sediment ripples after a storm event in larger waterdepths. Sediment ripples may develop when the bottom flow is sufficiently high, and remain as stationary sediment topography features after the storm event. Thus, the sediment may be affected by advective processes over considerably periods of time in which relatively weak flow predominates. By this “memory effect” (Precht et al. 2004) a temporally stable three-dimensional biogeochemical zonation could establish.
These temporal and spatial changes of advection have strong influence on the sedimentary biogeochemistry and organisms living in the sediment. When bottom flows increase and decrease the rates of advection may considerably change, but the porewater flow field will remain the same (Rutherford et al. 1995; Precht et al. 2004). In contrast, when topography changes occur, e.g., sediment ripples propagate, they are trailed by their porewater flow field alternately exposing sediment volumes to oxic and anoxic conditions whereby the entire biochemical zonation of the advectively influenced sediment horizon will be changed (Precht et al. 2004; Janssen et al. in prep.). This could potentially intensify sediment metabolism as oxidised and reduced compounds can be exchanged fast across short distances. Generally, bacteria located in the transition zone of oxic and anoxic sediment regions show high activities and organic matter remineralisation is enhanced, especially when oxic and anoxic conditions oscillate (Aller 1994; Huettel et al. 1998).
Advective transport of particles: Advection will not only transport solutes but also suspended particles, whereby organic matter from the overlying water could be transported into the sediment. As the porewater velocities decrease with sediment depth, the particles get trapped in distinct layers perpendicular to the porewater flow direction. Studies with tracer particles or phytoplankton showed that particle could be transported several cm deep
into the sediment. Mainly grain size and permeability were found to determine the flux and penetration depth of these particles (Huettel and Rusch 2000; Rusch and Huettel 2000 ; Ehrenhauss and Huettel 2004; Ehrenhauss et al. 2004a). This supply of organic matter to sedimentary organisms is very important especially when high hydrodynamic forces are present and particles cannot settle on the sediment surface before they could be invoked into the sediment by biological (Huettel 1990) or hydrological (Jenness and Duineveld 1985) sediment mixing processes.
Results of Forster et al. (1996); Huettel and Rusch (2000); Ehrenhauss and Huettel (2004); Ehrenhauss et al. (2004a) and Ehrenhauss et al. (2004b) suggest that the advective transport of organic particles such as phytoplankton, bacteria and detritus into the sediment enhanced sedimentary microbial activity and degradation occurred faster compared to the overlying water. This increased degradation activity is most likely the result of several factors. Mechanical stress within the sand probably breaks up cells and intensified contact with bacteria due to fluid-motion make the organic matter easier available for bacteria attached to sand grains (Huettel and Rusch 2000). In the region where these particles are mainly trapped the co-occurrence of organic matter and oxygen as well as other electron acceptors combined with effective transport of inhibitory products will accelerate degradation activity (Ziebis et al. 1996; Huettel et al. 1998).
temporal and spatial resolution, quality of the oxygen data as well as robustness and long-term stability, vary. A substantial part of the work was dedicated to finding biological systems where the application of these new optodes would be most advantageously.
In the first experiment (chapter 2) the effects of porewater advection on the oxygen distribution and dynamics in natural sediment was to be investigated in a laboratory wave tank with the help of a planar optode. The porewater advection was driven by wave-generated bottom flow interacting with either stationary or mobile sediment ripples. Their influence on the sedimentary oxygen dynamics was the focus of this experiment.
The second study (chapter 3) was designed to evaluate a newly developed method which allows for the determination of depths profiles of potential oxygen consumption rates in permeable sediments. The method is based on percolation of the sediment with oxygen-rich water and monitoring the oxygen in the sediment with a microelectrode (one-dimension) or in two-dimensions with a planar oxygen optode. The method was tested and compared to standard flux and benthic chamber methods with permeable sediments cores under strictly controlled conditions.
The objective of the third experiment (chapter 4) was to investigate the influence of advective and diffusive transport mechanisms on the aerobic degradation of particular organic matter (POM) in permeable sediment. The means by which advection might enhance the degradation rates was the focus of this study. Degradation rates were quantified directly by measuring the carbon and nitrogen content of POM samples and indirectly by measuring two-dimensional distributions of OCR using planar oxygen optodes.
The fourth study (chapter 5) was designed to describe the characteristics of porphyrin-based planar oxygen optodes such as light-guidance, noise behaviour, temporal and spatial resolution, long-term stability and robustness. The causes of the methodological limitations
were identified, discussed and possible solutions to improve the optode`s applicability are suggested.
Several laboratory applications were tested (chapter 6) to investigate the applacability of porphyrin-based planar optodes on a variety of processes in different aquatic systems. Subjects of investigations were bioirrigation activity; photosynthesis of microbial mats; oxygen uptake rates of foraminifera; radial oxygen loss of seagrass roots; temperature dependence of oxygen consumption rates of permeable sediments and the possibility of distinguishing between the biological and chemical contribution to the total sedimentary OCR of permeable sediments. The goal of this study was the identification of the advantages and limitations offered by the use of porphyrin-based planar oxygen optodes and the lifetime-based oxygen imaging technique.
References
Adam, G, P Läuger, and G Stark. 1988. Physikalische Chemie und Biophysik. Edited by G. Adam, P. Läuger and G. Stark. 2nd Edition. Springer Verlag.
Aller, R. C. 1982. The effects of macrobenthos on chemical properties of marine sediment and overlying water, p. 53-102. In P. L. McCall and J. S. Tevesz, [eds.]. Animal-sediment relations. The biogenic alteration of sediments. Topics in Geobiology. Plenum Press.
Aller, R. C., P. O. J. Hall, P. D. Rude, and J. Y. Aller. 1998. Biogeochemical heterogeneity and suboxic diagenesis in hemipelagic sediments of the Panama Basin. Deep-Sea Research Part I-Oceanographic Research Papers 45: 133-165.
Aller, R.C. 1988. Benthic fauna and biogeochemical processes in marine sediments: the role of burrow structures, p. 301-338. In T. H. Blackburn and J. Sørensen, [eds.]. Nitrogen cycling in coastal marine environments. John Wiley.
Aller, R.C. 1994. Bioturbation and remineralization of sedimentary organic-matter - effects of redox oscillation. Chemical Geology 114: 331-345.
Aller, R.C., and J.Y. Aller. 1998. The effect of biogenic irrigation intensity and solute exchange on diagenetic reaction rates in marine sediments. J. Exp. Mar. Biol. Ecol. 56: 905-936.
Aller, Robert C. 2001. Transport and reactions in the bioirrigated zone, p. 269-301. In B. P. Boudreau and B. B. Jørgensen, [eds.]. The Benthic Boundary Layer. Oxford University Press. Ballew, R. M., and J. N. Demas. 1989. An error analysis of the rapid lifetime determination method
Chemistry 63: 337-342.
Crank, J. 1975. The Mathematics of Diffusion. 2nd edition ed. Oxford University Press Inc. D'Andrea, A. F., R. C. Aller, and G. R. Lopez. 2002. Organic matter flux and reactivity on a South
Carolina sandflat: The impacts of porewater advection and macrobiological structures. Limnol. Oceanogr.47: 1056-1070.
de Beer, D., F. Wenzhofer, T.D. Ferdelman, S. Boehme, M. Huettel, J. E. E. von Beusekom, M. E. Böttcher, N. Musat, and N. Dubilier. 2005. Transport and mineralization rates in North Sea sandy intertidal sediments Sylt- Rømø basin, Wadden Sea. Limnol. Oceanogr.50: 113-127. Doucette, J. S., E. S. Harvey, and M. R. Shortis. 2002. Stereo-video observation of nearshore
bedforms on a low energy beach. Marine Geology 189: 289-305.
Ehrenhauss, S., and M. Huettel. 2004. Advective transport and decomposition of chain-forming planktonic diatoms in permeable sediments. J. Sea Res. 52: 179-197.
Ehrenhauss, S., U. Witte, S. L. Buhring, and M. Huettel. 2004a. Effect of advective pore water transport on distribution and degradation of diatoms in permeable North Sea sediments. Mar. Ecol. Prog. Ser. 271: 99-111.
Ehrenhauss, S., U. Witte, F. Janssen, and M. Huettel. 2004b. Decomposition of diatoms and nutrient dynamics in permeable North Sea sediments. Cont. Shelf Res. 24: 721-737. Elliott, A. H., and N. H. Brooks. 1997. Transfer of nonsorbing solutes to a streambed with bed
forms: Laboratory experiments. Water Resour. Res. 33: 137-151.
Enoksson, E., and M.O. Samuelsson. 1987. Nitrification and dissimilatory ammonium production and their effects on nitrogen flux over the sediment-water interface in bioturbated coastal sediments. Mar. Ecol. Prog. Ser. 36: 181-189.
Fenchel, T., and R. N. Glud. 2000. Benthic primary production and O2-CO2 dynamics in a
shallow-water sediment: Spatial and temporal heterogeneity. Ophelia 53: 159-171.
Forster, S., and G. Graf. 1995. Impact of irrigation on oxygen flux into the sediment: Intermittent pumping by Callianassa subterranea and "piston-pumping" by Lanice conchilega. Marine Biology. 123: 335-346.
Forster, S., M. Huettel, and W. Ziebis. 1996. Impact of boundary layer flow velocity on oxygen utilisation in coastal sediments. Mar. Ecol. Prog. Ser.143: 173-185.
Froehlich, P.N. , G.P. Klinkhammer, M.L. Bender, N.A. Luedtke, G.R. Heath, D. Cullen, P. Dauphin, D. Hammond, B. Hartman, and V. Maynard. 1979. Early oxidation of organic matter in pelagic sediments of the eastern equatorial Atlantic: suboxic diagenesis. Geochim.
Cosmochim. Acta 43: 1075-1090.
Gehlen, M., H. Malschaert, and W. R. Van Raaphorst. 1995. Spatial and temporal variability of benthic silica fluxes in the southeastern North Sea. Continental Shelf Research 15: 1675-1696. Glud, R. N., N. B. Ramsing, J. K. Gundersen, and I. Klimant. 1996. Planar optrodes: A new tool
for fine scale measurements of two-dimensional O2 distribution in benthic communities. Mar.
Ecol. Prog. Ser.140: 217-226.
Glud, R. N., A. Tengberg, M. Kuhl, P. O. J. Hall, I. Klimant, and G. Holst. 2001. An in situ instrument for planar O-2 optode measurements at benthic interfaces. Limnol. Oceanogr. 46: 2073-2080.
Graf, G., and R. Rosenberg. 1997. Bioresuspension and biodeposition: A review. Journal of Marine Systems 11: 269-278.
Hartmann, P., W. Ziegler, G. Holst, and D. W. Lubbers. 1997. Oxygen flux fluorescence lifetime imaging. Sensors and Actuators B-Chemical 38: 110-115.
Holst, G., R. N. Glud, M. Kuhl, and I. Klimant. 1997. A microoptode array for fine-scale measurement of oxygen distribution. Sensors and Actuators B-Chemical 38: 122-129. Holst, G., and B. Grunwald. 2001. Luminescence lifetime imaging with transparent oxygen
optodes. Sensors and Actuators B-Chemical 74: 78-90.
Holst, G., O. Kohls, I. Klimant, B. König, M. Kuhl, and T. Richter. 1998. A modular luminescence lifetime imaging system for mapping oxygen distribution in biological samples. Sensors and Actuators B-Chemical 51: 163-170.
Huettel, M. 1990. Influence of the lugworm Arenicula marina on porewater nutrient profiles of sand flat sediments. Mar. Ecol. Prog. Ser. 62: 241-248.
Huettel, M., and G. Gust. 1992a. Impact of bioroughness on interfacial solute exchange in permeable sediments. Mar. Ecol. Prog. Ser. 89: 253-267.
Huettel, M., and A. Rusch. 2000. Transport and degradation of phytoplankton in permeable sediment. Limnol. Oceanogr. 45: 534-549.
Huettel, M., W. Ziebis, S. Forster, and G.III. Luther. 1998. Advective transport affecting metal and nutrient distribution and interfacial fluxes in permeable sediments. Geochim. Cosmochim. Acta
B. P. Boudreau and B. B. Jørgensen, [eds.]. The Benthic Boundary Layer. Oxford University Press.
Janssen, F., H Roy, U. Werner, and U. Witte. in prep. Sediment surface topographies and bottom water flow: An in situ case study on the fundamentals of porewater advection.: in prep.
Jenness, M. Ian, and G. C. A. Duineveld. 1985. Effects of tidal currents on chlorophyll a content of sandy sediments in the southern North Sea. Mar. Ecol. Prog. Ser. 21: 283-287.
Jørgensen, B.B. 2001. Life in the diffusive boundary layer, p. 348-373. In B. P. Boudreau and B. B. Jørgensen, [eds.]. The benthic boundary layer: transport processes and biogeochemistry. Oxford Univ. Press.
Jørgensen, B.B. , and D.J. Des Marais. 1990. The diffusive boundary layer of sediments: oxygen microgradients over a microbial mat. Limnol. Oceanogr. 35: 1343-1355.
Jørgensen, B.B., and N. P. Revsbech. 1985. Diffusive boundary-layers and the oxygen-uptake of sediments and detritus. Limnol. Oceanogr. 30: 111-122.
Jørgensen, B.B., and J. Sorensen. 1985. Seasonal cycles of O2, NO3- and SO42- reduction in
estuarine sediments - The significance of a NO3- reduction maximum in spring. Mar. Ecol.
Prog. Ser. 24: 65-74.
Klimant, I., V. Meyer, and M. Kuhl. 1995. Fiberoptic oxygen microsensors, a new tool in aquatic biology. Limnol. Oceanogr. 40: 1159-1165.
Klimant, I., and O. S. Wolfbeis. 1995. Oxygen-sensitive luminescent materials based on silicone-soluble ruthenium diimine complexes. Analytical Chemistry 67: 3160-3166.
König, B., G. Holst, R.N. Glud, and M. Kuehl. 2001. Imaging of oxygen distributions at benthic interfaces: A brief review, p. 63-71. In J. Y. Aller, S. A. Woodin and R. C. Aller, [eds.]. Organism-Sediment Interactions. University of South Carolina Press.
Kristensen, E. 1988. Benthic fauna and biogeochemical processes in marine sediments: microbial activity and fluxes, p. 275-299. In T. H. Blackburn and J. Sørensen, [eds.]. Nitrogen cycling in coastal marine environments. John Wiley.
Kristensen, E. 1989. Oxygen and carbon-dioxide exchange in the Polychaete Nereis-virens -Influence of ventilation activity and starvation. Marine Biology 101: 381-388.
Kristensen, E., M. Jensen, and T. Andersen. 1985. The impact of polychaete (Nereis-virens sars) burrows on nitrification and nitrate reduction in estuarine sediments. J. Exp. Mar. Biol. Ecol.
85: 75-91.
Kühl, M., and N. P. Revsbech. 2001. Biochemical microsensors for boundary layer studies, p. B. P. Boudreau and B. B. Jørgensen, [eds.]. The benthic boundary layer. Oxford University Press. Liebsch, G. 2000. Time-resolved luminescence lifetime imaging with optical chemical sensors
thesis, University of Regensburg.
Liebsch, G., I. Klimant, B. Frank, G. Holst, and O. S. Wolfbeis. 2000. Luminescence lifetime imaging of oxygen, pH, and carbon dioxide distribution using optical sensors. Applied Spectroscopy 54: 548-559.
Logan, B. E., and D. L. Kirchman. 1991. Uptake of dissolved organics by marine-bacteria as a function of fluid motion. Marine Biology 111: 175-181.
Lohse, L., E.H.G. Epping, W. Helder, and W. van Raaphorst. 1996. Oxygen pore water profiles in continental shelf sediments of the North Sea: turbulent versus molecular diffusion. Mar. Ecol. Prog. Ser. 145: 63-75.
Lübbers, D. W. 1995. Optical Sensors for Clinical Monitoring. Acta Anaesthesiologica Scandinavica 39: 37-54.
Malan, Daniel E., and Anton McLachlan. 1991. In situ benthic oxygen fluxes in a nearshore coastal marine system: a new approach to quantify the effect of wave action. Mar. Ecol. Prog. Ser. 73: 69-81.
Marinelli, R. L., R. A. Jahnke, D. B. Craven, J. R. Nelson, and J. E. Eckman. 1998. Sediment nutrient dynamics on the South Atlantic Bight continental shelf Limnol. Oceanogr. 43: 1305-1320.
Papkovsky, D. B., J. Olah, I. V. Troyanovsky, N. A. Sadovsky, V. D. Rumyantseva, A. F. Mironov, A. I. Yaropolov, and A. P. Savitsky. 1992. Phosphorescent Polymer-Films For Optical Oxygen Sensors. Biosensors & Bioelectronics 7: 199-206.
Polerecky, L., U. Franke, U. Werner, B. Grunwald, and D. de Beer. 2005. High spatial resolution measurement of oxygen consumption rates in permeable sediments. Limnol. Oceanogr.: Methods 3:75-85.
Precht, E., U. Franke, L. Polerecky, and M. Huettel. 2004. Oxygen dynamics in permeable sediments with wave-driven pore water exchange. Limnol. Oceanogr. 49: 693-705.
Precht, E., and M. Huettel. 2003. Advective pore water exchange driven by surface gravity waves and its ecological implications. Limnol. Oceanogr. 48: 1674-1684.
Precht, E., and M. Huettel. 2004. Rapid wave-driven advective pore water exchange in a permeable coastal sediment. J. Sea Res. 51: 93-107.
1907-1910.
Revsbech, N. P., and B.B. Jørgensen. 1986. Microelectrodes: Their use in microbial ecology. Adv. Microb. Ecol. 9: 293-352.
Revsbech, N. P., B.B. Jørgensen, and T. H. Blackburn. 1980. Oxygen in the sea bottom measured with a microelectrode. Science 207: 1355-1356.
Riedl, R. J., N. Huang, and R. Machan. 1972. The subtidal pump: a mechanism of interstitial water exchange by wave action. Marine Biology 13: 210-221.
Riisgard, H. U., and P. S. Larsen. 2000. Comparative ecophysiology of active zoobenthic filter feeding, essence of current knowledge. J. Sea Res. 44: 169-193.
Rumsey, W. L., J. M. Vanderkooi, and D. F. Wilson. 1988. Imaging of phosphorescence - a novel method for measuring oxygen distribution in perfused tissue. Science 241: 1649-1651.
Rusch, A., and M. Huettel. 2000. Advective particle transport into permeable sediments - evidence from experiments in an intertidal sandflat. Limnol. Oceanogr. 45: 525-533.
Rutgers van der Loeff, Michiel M. 1981. Wave effects on sediment water exchange in a submerged sand bed. Neth. J. Sea Res. 15: 100-112.
Rutherford, J. C., J. D. Boyle, A. H. Elliott, T. V. J. Hatherell, and T. W. Chiu. 1995. Modeling benthic oxygen-uptake by pumping. J. Environ. Eng.-ASCE 121: 84-95.
Rutherford, J. C., G. J. Latimer, and R. K. Smith. 1993. Bedform mobility and benthic oxygen-uptake. Water Research 27: 1545-1558.
Savant, S. A., D. D. Reible, and L. J. Thibodeaux. 1987. Convective transport within stable river sediments. Water Resour. Res. 23: 1763-1768.
Shum, K.T. 1992. Wave-induced advective transport below a rippled water-sediment interface. J. Geophys. Res. 97: 789-808.
Shum, K.T. 1993. The effects of wave-induced pore water circulation on the transport of reactive solutes below a rippled sediment bed. J. Geophys. Res. 98: 10289-10301.
Stücker, M., L. Schulze, G. Pott, P. Hartmann, D. W. Lubbers, A. Rochling, and P. Altmeyer. 1998. FLIM of luminescent oxygen sensors: clinical applications and results. Sensors and Actuators B-Chemical 51: 171-175.
Thibodeaux, L. J., and J. D. Boyle. 1987. Bedform-generated convective transport in bottom sediment. Nature 325: 341-343.
Traykovski, P., A. E. Hay, J. D. Irish, and J. F. Lynch. 1999. Geometry, migration, and evolution of wave orbital ripples at LEO-15. J. Geophys. Res.-Oceans 104: 1505-1524.
Ullman, W. J., and R. C. Aller. 1982. Diffusion-Coefficients in Nearshore Marine-Sediments. Limnol. and Oceanogr. 27: 552-556.
van Loosdrecht, M. C. M., J. Lyklema, W. Norde, and A. J. B. Zehnder. 1990. Influence of Interfaces on Microbial Activity. Microbiological Reviews 54: 75-87.
van Rees, K. C. J., K. R. Reddy, and P. S. C. Rao. 1996. Influence of benthic organisms on solute transport in lake sediments. Hydrobiologia 317: 31-40.
Webb, J. E., and J. Theodor. 1968. Irrigation of submerged marine sands through wave action. Nature 220: 682-683.
Webb, J. E., and J. L. Theodor. 1972. Wave-induced circulation in submerged sands. Journal of the Marine Biological Association of the United Kingdom 52: 903-914.
Wenzhöfer, F., and R. N. Glud. 2004. Small-scale spatial and temporal variability in benthic O2 dynamics of coastal sediments: Effects of fauna activity. Limnol. Oceanogr. 49: 1471-1481. Wheatcroft, R. A. 1992. Temporal variation in bed configuration and one-dimensional bottom
roughness at the mid shelf STRESS site. Cont. Shelf Res. 14: 1167-1190.
Wild, C., M. Rasheed, U. Werner, U. Franke, R. Johnstone, and M. Huettel. 2004. Degradation and mineralization of coral mucus in reef environments. Mar. Ecol. Prog. Ser.267: 159-171.
Wolfbeis, O.S. 1991. Fiber optic chemical sensors and biosensors. CRC Press.
Ziebis, W., M. Huettel, and S. Forster. 1996. Impact of biogenic sediment topography on oxygen fluxes in permeable seabeds. Mar. Ecol. Prog. Ser.140: 227-237.
Elimar Precht, Ulrich Franke, Lubos Polerecky and Markus Huettel
Oxygen dynamics in permeable sediments with wave-driven pore water exchange
This study was initiated by M. Huettel, E. Precht and U. Franke. E. Precht and U. Franke conducted the experiments. U. Franke was responsible for the oxygen measurements and evaluation of the oxygen data. U. Franke wrote the corresponding material and methods part of the manuscript and provided with the co-authors editorial help and input for the entire manuscript. The manuscript has been published in Limnology and Oceanography © American Society of Limnology and Oceanography Inc. 2004.
Chapter 3
Lubos Polerecky, Ulrich Franke, Ursula Werner, Björn Grunwald and Dirk de Beer
High spatial resolution measurements of oxygen consumption rates in permeable sediments
D. de Beer, U. Franke and L. Polerecky initiated this study. L. Polerecky, U. Franke and U. Werner conducted the experiments. L. Polerecky and U. Franke
evaluated the data and wrote the manuscript with editorial help and input of U. Werner and D. de Beer. This manuscript has been accepted for publishing in Limnology and
Chapter 4
Ulrich Franke, Lubos Polerecky, Elimar Precht, and Markus Huettel
Wave tank study of particulate organic matter degradation in permeable sediments
U. Franke and M. Huettel initiated this study. U. Franke conducted the experiments, evaluated the data and wrote the manuscript with the editorial help and input of all co-authors. This manuscript has been submitted to Limnology and Oceanography.
Chapter 5
Ulrich Franke, Gerhard Holst and Lubos Polerecky
Characteristics of porphyrin-based planar optodes: consequences for applicability in aquatic systems
This study was initiated by U. Franke, L. Polerecky and G. Holst. U. Franke and L. Polerecky conducted the experiments. U. Franke evaluated the data and wrote the manuscript with editorial help and input of L. Polerecky. This manuscript is in preparation for submission to Limnology and Oceanography.
Chapter 6
Ulrich Franke, Tjeerd Bouma, Emmanuelle Geslin, Gerhard Holst, Henk Jonkers, Stephanie Köhler-Rink, Gloria Peralta, Ursula Werner and Lubos Polerecky
Applications of porphyrin-based planar oxygen optodes and the modular luminescence lifetime imaging (MOLLI) system in aquatic environments
This chapter gives an overview of experiments which have been carried out during the whole PhD period on diverse biological systems in aquatic environments. Studies were initiated and conducted by U. Franke and the co-authors. U. Franke evaluated the data and wrote the chapter with editorial help and input of the co-authors.
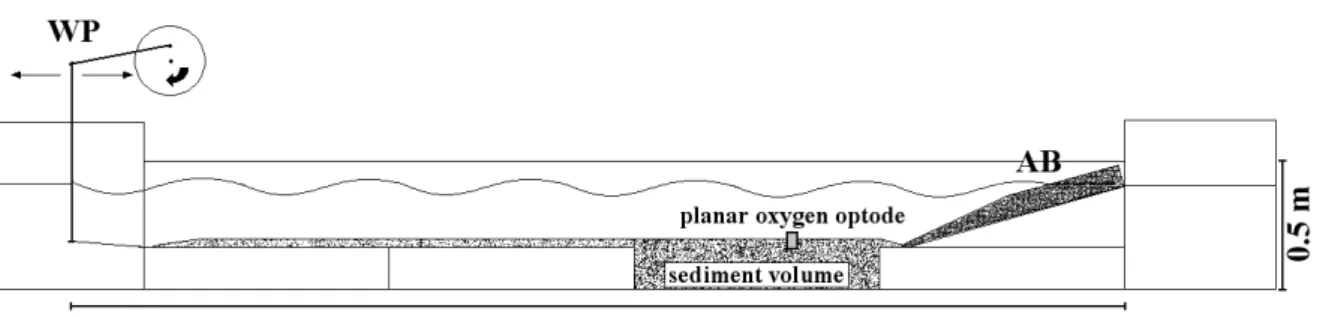
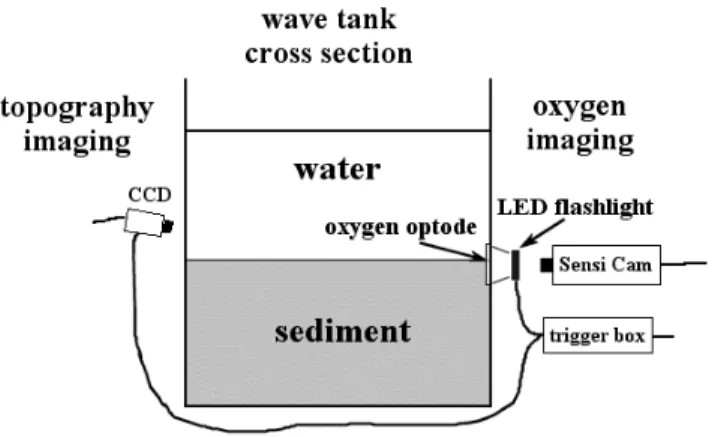
Max Planck Institute for Marine Microbiology, Celsiusstrasse 1, D-28359 Bremen, Germany
*Present address: Florida State University, Department of Oceanography, 0517 OSB, West Call Street, Tallahassee, Florida 32306-4320, USA
This manuscript has been published inLimnology & Oceanography (49: 693-705)
Abstract
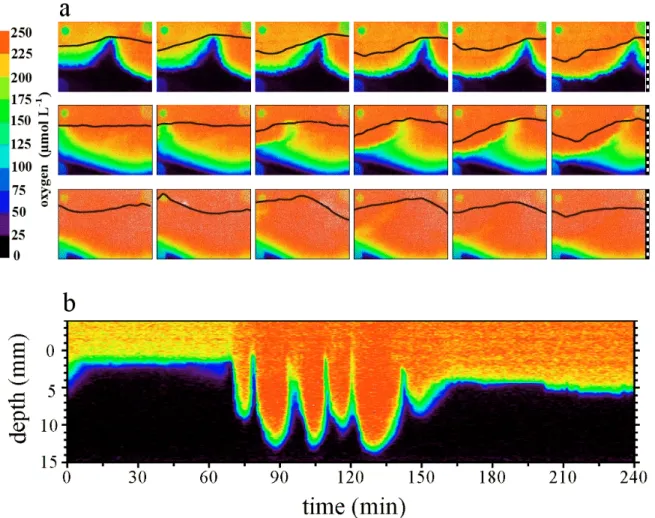
The effects of advective pore water exchange driven by shallow water waves on the oxygen distribution in a permeable (k = 3.3 × 10⁻¹² to 4.9 × 10⁻¹¹ m2) natural sediment were studied with a planar oxygen optode in a wave tank. Our experiments demonstrate that pore water flow driven by the interaction of sediment topography and oscillating boundary flow changes the spatial and temporal oxygen distribution in the upper sediment layer. Oxygenated water intruding in the ripple troughs and deep anoxic pore water drawn to the surface under the ripple crests create an undulating oxic–anoxic boundary within the upper sediment layer, mirroring the topographical features of the sediment bed. Anoxic upwelling zones under ripple crests can separate the oxic sediment areas of neighboring ripple troughs with steep horizontal oxygen concentration gradients. The optode showed that migrating wave ripples are trailed by their pore water flow field, alternately exposing sediment volumes to oxic and anoxic pore water, which can be a mechanism for remobilizing particulate oxidized metal precipitates and for promoting coupled nitrification–denitrification. More rapid ripple migration (experimental threshold ~ 20 cm
h-1) produces a continuous oxic surface layer that inhibits the release of reduced substances from the bed, which under slowly moving ripples is possible through the anoxic vertical upwelling zones. Swift, dramatic changes in oxygen concentration in the upper layers of permeable seabeds because of surface gravity waves require that sediment-dwelling organisms are tolerant to anoxia or highly mobile and enhance organic matter mineralization.
might drive interfacial solute transport through the surface layers of these beds. This advective transport can exceed transport by molecular diffusion by several orders of magnitude (Huettel and Webster 2001). In contrast, the major transport mechanisms in fine-grained muddy sediments are molecular diffusion and local bioturbation (Berner 1980; Aller 1982). Increased fluid exchange between sediment and overlying water affects the oxygen dynamics in permeable sediments and therefore also affects biogeochemical processes. Booij et al. (1991) showed in benthic chamber experiments that oxygen-rich water can be advected vertically into sandy sediment, which increased the Oxygen penetration depth in the sediment as a function of the flow velocity of the overlying water. Advective oxygen distribution in permeable sand because of unidirectional boundary flow interacting with sediment topography was studied by Ziebis et al. (1996), who showed that oxygen is transported rapidly and effectively into deeper sediment layers and could thus enhance mineralization of organic matter (Forster et al. 1996). This organic matter could be transferred from the boundary layer into the top centimeters of the sediments as suspended particles or phytoplankton by advection (Huettel et al. 1996; Huettel and Rusch 2000). As a consequence of these processes, advective pore water flow can generate a complex biogeochemical zonation in the sediment with areas of enhanced nitrification or iron precipitation and vertical channels through which ammonium and reduced metals are transported to the sediment surface (Huettel et al. 1998).
Surface gravity waves produce oscillating flows at the sediment-water interface by the wave orbital water motion (e.g., see p. 54 in Denny 1988) in areas with a water depth shallower than half the wavelength of the waves. The ability of such oscillating boundary flows to drive pore water flow was shown by Webb and Theodor (1968, 1972) by injecting dyed water into coarse, sandy, nearshore sediment and observing its reappearance at the sediment surface. Wave-driven in situ pore water velocities were measured by Precht and Huettel (2004). Shum (1992) calculated the pore water motion under a rippled bed over one wave period with a two-dimensional computational model, showing that the zone of advection extends several ripple heights below the ripple surface over a wide range of