Modelling Critical Care Unit Activities
Through Queueing Theory
Izabela Komenda
School of Mathematics
Cardiff University
A thesis submitted for the degree of
Doctor of Philosophy
Abstract
Critical Care Units (CCUs) are one of the most complex and expensive of all medical resources and hospital managers are challenged to meet the demand for critical care services with adequate capacity. The pressure on critical care beds is continuously increasing as new medical equipment provides the opportunity to save more patients lives. It is therefore crucial that beds are managed well and used efficiently. This thesis describes two major projects, the first undertaken in conjunc-tion with the CCU at the University Hospital of Wales in Cardiff (UHW); and the second with two CCUs from the Aneurin Bevan Health Board.
In the first project data has been analysed to determine the flow of patients through the Unit. Admis-sions to CCUs were categorised under two headings: emergency, and elective. The length of stay in the CCU is heavily dependent on the admission category. In this thesis, both computer simula-tion and theoretical queueing models have been considered, which show how improvements in bed management may be achieved by considering these two categories of patients separately. The vast majority of previous literature in this field is concerned only with steady-state conditions, whereas in reality the processes are time-dependent. This thesis goes some way to addressing this deficiency. The second project relates to work undertaken with managers from the Royal Gwent Hospital in Newport and at the Nevill Hall Hospital in Abergavenny. Data from both hospitals have been anal-ysed to define arrival and service processes. A state-dependent theoretical queueing model has been considered which has been used to investigate the significance of combining the two units. The model has been also utilised to advise on the number of beds the new combined unit should have in order to satisfy targets quoted by the hospital managers.
In the final part of the thesis, consideration has been given to the impact of collaboration, or lack thereof, between hospitals using a game theoretical approach. The effect of patient diversion has been studied. To formally investigate the impact of patients transfers, a Markov chain model of the two CCUs has been set-up, each admitting two arrival streams: namely, their own patients and transfers from other hospital. Four different models were considered and for each model the effect of targets, demand and capacity were studied. The efficiency of a system which degrades due to selfish behaviour of its agents has been measured in terms of Price of Anarchy.
DECLARATION
This work has not been submitted in substance for any other degree or award at this or any other university or place of learning, nor is being submitted concurrently in candidature for any degree or other award.
Signed .. . . . Date . . . .
STATEMENT 1
This thesis is being submitted in partial fulfillment of the requirements for the degree of PhD. Signed .. . . .
Date . . . .
STATEMENT 2
This thesis is the result of my own investigations, except where otherwise stated. Other sources are acknowledged and explicit references given. A reference section is appended.
Signed .. . . . Date . . . .
STATEMENT 3
I hereby give consent for my thesis, if accepted, to be available for photocopying and for inter-library loan, and for the title and summary to be made available to outside organisations.
Signed .. . . . Date . . . .
Acknowledgements
It gives me great pleasure in extending my gratitude to all those people who have supported me during the last three and half years of my research.
First and foremost, I would like to express my deepest appreciation to my supervisors, Professor Jeff Griffiths and Dr Vincent Knight, for their expertise, contributions, patience and support when they were most needed. One simply could not wish for better or friendlier supervisors.
My sincere thanks also go to Dr Mari Jones for guiding and enlightening me the first few months of my research.
I would like to express my gratitude to the Engineering and Physical Sciences Research Council for making this research financially possible.
I am extremely grateful to Andrew Nelson and Dr Martyn Read from University Hospital of Wales in Cardiff and Dr Stephen Dumont and Zoe Goodacre from the Aneurin Bevan Health Board for providing the data, help in increasing my understanding of Critical Care Unit performance and as-sistance throughout with anything I required.
I express my appreciation to my thesis examiners: Professor Steven Gallivan and Professor Paul Harper. Their thoughtful questions and comments were valued greatly.
In my work I have been blessed with the most friendly and cheerful group of fellow research stu-dents. I am reluctant to name individuals for fear of missing somebody out, but I would like to say thank you all for ensuring I kept level-headed during heated or stressed times - tea breaks and sweets normally did the trick! You will stay in my memories forever!
I would also like to acknowledge with much appreciation the staff of the School of Mathematics for welcoming me as a friend and providing the help, support and equipment I have needed.
I would like to express my sincere thanks to my family. In particular, I would like to extend a huge thank you to my Mum, who ensured I made the most of opportunities offered to me, who always believed in me and supported any decision I made in my life. Words fall short of her impact on my life. Without her, I would not be the person that I am today. Kocham Cie Mamo.,
Last but not least, thank you God for giving me the intellect to understand the complexity of num-bers, and giving me strength to complete this research.
Publications and Presentations
List of Publications
J. D. Griffiths, V. Knight, and I. Komenda. Bed management in a Critical Care Unit. IMA Journal of Management Mathematics,, 24(2): 137-153, January 2013. [74]
I. Komenda, J. D. Griffiths, and V. Knight. A model of CCU activities through queueing theory.
ORAHS Conference, 2012, extended abstract only. [107]
Conference Contributions
I. Komenda, J. D. Griffiths, and M. Jones. Queue models applied to healthcare and transport.SCOR Conference, April 2010, Nottingham.
I. Komenda, J. D. Griffiths, and V. Knight. Bed management in the Critical Care Unit. OR52 Con-ference, September 2010, Royal Holloway University of London.
I. Komenda, J. D. Griffiths, and V. Knight. Bed management in the Critical Care Unit. IFORS Conference, July 2011, Melbourne, Australia.
I. Komenda, J. D. Griffiths, and V. Knight. Mathematical modelling of the critical care units at the Royal Gwent and Nevill Hall hospitals. SCOR Conference, April 2012, Nottingham.
I. Komenda, J. D. Griffiths, and V. Knight. Mathematical modelling of the critical care units at the Royal Gwent and Nevill Hall hospitals. EURO Conference, July 2012, Vilnius, Lithuania.
I. Komenda, J. D. Griffiths, and V. Knight. Mathematical modelling of the critical care units at the Royal Gwent and Nevill Hall hospitals. ORAHS Conference, July 2012, University of Twente, Holland.
Poster Presentation
I. Komenda, J. D. Griffiths, and V. Knight. How to improve bed management in a Critical Care Unit. ORAHS Conference, July 2011, Cardiff University, Wales.
Contents
Abstract i
Declaration ii
Acknowledgements iii
Publications and Presentations v
Contents vi
List of Acronyms xi
1 Introduction 1
1.1 Introduction to Critical Care Units . . . 1
1.1.1 Critical Care Unit Beds . . . 2
1.1.2 Critical Care Unit Nurses . . . 2
1.2 Problems that Critical Care Units are Facing . . . 3
1.3 Queueing Theory . . . 4
1.4 Queueing Theory in Healthcare and Similar Environments . . . 8
1.4.1 Waiting Time and Utilisation Analysis . . . 9
1.4.1.1 Reneging . . . 9
1.4.1.2 Bulking . . . 10
1.4.1.3 Variable Arrival Rate . . . 11
1.4.1.4 Priority Queueing Discipline . . . 12
1.4.1.5 Blocking . . . 13
1.5 Simulation . . . 14
1.6 Conclusions . . . 16
1.7 Outline and Structure of Thesis . . . 16 2 Summary Statistics of Patients’ Flow Through the Critical Care Unit at the University
Hospital of Wales 18
2.1 Introduction and Objective of the Study . . . 18
2.2 Background . . . 18
2.2.1 Patients . . . 19
2.2.2 Data . . . 19
2.3 Summary Statistics . . . 20
2.3.1 Arrivals and Discharges . . . 20
2.3.1.1 Emergency Admissions . . . 25 2.3.1.2 Elective Admissions . . . 26 2.3.1.3 Discharges . . . 27 2.3.2 Inter-arrival Time . . . 30 2.3.3 Length of stay . . . 31 2.3.3.1 Emergency Patients . . . 35 2.3.3.2 Elective Patients . . . 37 2.3.4 Bed Occupancy . . . 38 2.4 Conclusions . . . 40
3 Mathematical Modelling of the Critical Care Unit at the University Hospital of Wales 41 3.1 Introduction . . . 41
3.2 Simulation Model of the Critical Care Unit . . . 41
3.2.1 Validation of the Simulation Model . . . 45
3.2.1.1 Emergency Number of Arrivals . . . 45
3.2.1.2 Elective Number of Arrivals . . . 46
3.2.1.3 Emergency Length of Stay . . . 47
3.2.1.4 Elective Length of Stay . . . 47
3.2.2 Results of the Simulation Model . . . 48
3.2.3 ‘What if’ Scenario #1 . . . 49
3.2.4 ‘What if’ Scenario #2 . . . 51
3.2.5 Conclusions . . . 52
3.3 Analytical Model . . . 52
3.3.1 Introduction . . . 52
3.3.2 The Queueing ModelM2/M2/c/c/F IF O . . . 53
3.3.3 The queueing modelM2/M/c/c+m/F IF O . . . 62
3.3.4 Connection BetweenM2/M2/c/c/F IF OandM/M/c/c/F IF O . . . 67
3.3.5 The Multi-ClassMk/Mk/c/c/F IF OQueue . . . 69
3.3.6 Queueing Model with Cut-off . . . 71
3.3.7 Queueing Model with Cut-off and Extra Admissions . . . 75
3.4 Conclusions . . . 79
4 Further Applications of Mathematical Modelling at the Critical Care Unit in
Univer-sity Hospital of Wales 81
4.1 Introduction . . . 81
4.2 Time-Dependent Aspects . . . 81
4.2.1 Literature Review . . . 81
4.2.2 Time-Dependent Bed Utilisation . . . 83
4.3 Analytical Model of Bed Occupancy Predictions . . . 86
4.3.1 Most Likely Bed Occupancy at Future Days . . . 91
4.3.2 Most Probable Split Between the Numbers of Emergency and Elective Pa-tients at Future Days . . . 93
4.3.3 Conclusions . . . 94
4.4 Nursing Requirements . . . 95
4.4.1 Motivation of the Work . . . 95
4.4.2 Literature Review . . . 95
4.4.3 Nurse to Patient Ratio Required is 1:1 . . . 96
4.4.3.1 Model that optimises an actual expected cost . . . 96
4.4.3.2 Newsboy Model . . . 97
4.4.4 The Nurse to Patient Ratio is Variable . . . 98
4.4.4.1 Model that Optimises an Actual Expected Cost . . . 98
4.4.4.2 Newsboy Model . . . 100
4.4.5 Time Dependent Nursing Requirements . . . 100
4.5 Conclusions . . . 102
5 Data Analysis of Two Data Sets From the Royal Gwent and the Nevill Hall Critical Care Units 103 5.1 Introduction and Motivation of the Study . . . 103
5.2 Data Analysis . . . 104 5.2.1 Admission process . . . 105 5.2.1.1 Nevill Hall . . . 105 5.2.1.2 Royal Gwent . . . 107 5.2.2 Length of Stay . . . 110 5.2.2.1 Nevill Hall . . . 111 5.2.2.2 Royal Gwent . . . 113 5.2.3 Bed Occupancy . . . 115 5.2.3.1 Nevill Hall . . . 115 5.2.3.2 Royal Gwent . . . 116 5.2.4 Delay to Discharge . . . 119 5.2.4.1 Nevill Hall . . . 121 viii
5.2.4.2 Royal Gwent . . . 123
5.2.4.3 Conclusions . . . 125
5.3 Conclusions . . . 126
6 Mathematical Modelling of the Nevill Hall and the Royal Gwent Critical Care Units 127 6.1 Introduction . . . 127
6.2 The Queueing Model . . . 127
6.3 Results of the Mathematical Model . . . 133
6.4 ‘What if’ Scenarios . . . 136
6.4.1 Transfer of Patients Between Hospitals . . . 137
6.4.2 Transfer of Patients and Beds Between Hospitals . . . 140
6.4.3 Consolidation of Two Units . . . 144
6.5 SCCC Capacity Recommendations . . . 149
6.5.1 Introduction . . . 149
6.5.2 Literature Review . . . 149
6.5.2.1 Bed Allocation and Planning . . . 149
6.5.2.2 Bed Allocation in Critical Care Units . . . 151
6.5.3 Bed Occupancy Model . . . 153
6.5.4 Changes in the Unit Capacity . . . 155
6.5.4.1 ‘What if’ Scenario: Increased Arrivals . . . 157
6.5.4.2 ‘What if’ Scenario: Bed Blocking Reduction . . . 157
6.6 Conclusions . . . 159
7 A Game Theoretical Consideration of Critical Care Unit Interaction 161 7.1 Motivation of the Study . . . 161
7.2 Literature Review . . . 161
7.2.1 Game Theory in Healthcare . . . 164
7.3 Introduction . . . 166
7.4 Basic Methodology . . . 167
7.5 Game Theoretic Model . . . 169
7.6 Price of Anarchy . . . 170
7.7 Model 1 . . . 171
7.7.1 ‘What if’: Target and Percentage Demand Change . . . 174
7.7.2 ‘What if’: Demand Change at Each CCU . . . 176
7.7.3 ‘What if’: Bed Capacity Change at Both CCUs . . . 177
7.8 Model 2 . . . 179
7.8.1 ‘What if’: Target and Percentage Demand Change . . . 182
7.8.2 ‘What if’: Demand Change at Each CCU . . . 184 ix
7.8.3 ‘What if’: Bed Capacity Change at Both CCUs . . . 185
7.9 Conclusions . . . 187
8 A Further Game Theoretical Consideration of Critical Care Unit Interaction 189 8.1 Introduction . . . 189
8.2 Game Theoretic Model . . . 190
8.3 Model 3 . . . 192
8.3.1 ‘What if’: Target, Demand and Reduction Rate Change . . . 195
8.4 Model 4 . . . 197
8.4.1 ‘What if’: Target, Demand and Decrease Rate Change . . . 200
8.5 Conclusions . . . 202
9 Final Conclusions and Further Work 204 9.1 Part I . . . 204
9.1.1 Summary of Chapters 2, 3 and 4 . . . 204
9.1.2 Limitations and Further Work . . . 206
9.2 Part II . . . 207
9.2.1 Summary of Chapters 5 and 6 . . . 207
9.2.2 Limitations and Further Work . . . 208
9.3 Part III . . . 209
9.3.1 Summary of Chapters 7 and 8 . . . 209
9.3.2 Limitations and Further Work . . . 210
9.4 Final Remarks . . . 210
List of Figures 211
List of Tables 215
Appendix A Proof of Theorem 3.3.2 217
Appendix B Proof of Theorem 3.3.3 222
Appendix C Proof of Theorem 3.3.4 225
Appendix D Proof of Theorem 6.2.1 231
Appendix E Gaussian Elimination Algorithm 234
Bibliography 235
List of Acronyms
A&E Accident and Emergency
CART Classification and Regression Tree CCU Critical Care Unit
CDF Cumulative Distribution Function CV Coefficient of Variation
DoH Department of Health
EAU Emergency Assessment Unit ED Emergency Department ER Emergency Room
ENB English National Board For Nursing HDU High Dependency Unit
ICNARC The Intensive Care National Audit and Research Centre IID Independent and Identically Distributed
ICU Intensive Care Unit ITU Intensive Treatment Unit LoS Length of stay
MAU Medical Assessment Unit
NH Nevill Hall Hospital in Abergavenny NHS National Health Service
OR Operational Research
PDF Probability Density Function PoA Price of Anarchy
RG Royal Gwent Hospital in Newport RIP Riyadh ICU Program
SCCC Specialist Critical Care Centre
UHW University Hospital of Wales in Cardiff VBA Visual Basic for Applications
Chapter 1
Introduction
Operational Research (OR) is a relatively new sub-field of mathematics. It is thought to have been conceived in the efforts of military planners during World War II. The objective was to find the most effective utilisation of limited military resources by the use of quantitative techniques. In the years after the Second World War the application of OR moved toward more domestic concerns. By the early 1950s over forty Operational Research sections, which ranged in size and speciality, had been established in Great Britain (Goodeve, 1953 [61]). Many were based in the private sector whilst others could be found in government departments or research associations. Various applications of the discipline were studied; agriculture, civil aviation, the textile industry, property development, and healthcare. The paper entitled “Operational Research in Medicine” (Bailey, 1952 [10]) is perhaps the earliest publication that considers the application of OR in healthcare. Since then research within this field has been constantly increasing. Operational Research provides numerous methodologies and solution techniques for tackling healthcare problems such as: how many nurses should a hospital employ? How many beds should a hospital have to provide adequate care for all patients? OR offers a systematic approach to problem solving and allows for the characterisation of activities of an existing system using mathematical modelling.
1.1
Introduction to Critical Care Units
A Critical Care Unit (CCU), also sometimes known as an Intensive Therapy Unit (ITU) or Intensive Therapy Department, is a special ward that is found in most acute hospitals. It provides intensive care (treatment and monitoring) for people who are critically ill or are in an unstable condition. People in CCUs need constant medical support to keep their body functioning. They may not be able to breathe on their own and they have at least one organ failure. There are many different conditions and situations that can cause organ systems to fail. Some of the most common include: a severe accident, such as a road accident, a serious acute health condition, such as a heart attack or stroke, a severe infection, such as pneumonia or blood poisoning (sepsis). More importantly,
Chapter 1 INTRODUCTION 2
patients after major surgeries are also admitted into the CCU; this can either be a planned admission as part of recovery after surgery, or an emergency measure if there are complications during surgery. Medical equipment takes the place of failed organ functions while the person recovers. Patients who are able to breathe unaided and no longer need critical care will be transferred to a different ward to continue their recovery. The time it takes to recover completely varies greatly from person to person, and will also depend on a variety of factors such as age, overall level of health and fitness and the severity of the patients’ condition.
1.1.1
Critical Care Unit Beds
The CCU beds are very expensive and a limited resource because they provide specialised moni-toring equipment, a high degree of medical expertise and constant access to highly trained nurses. It was estimated by the Department of Health (DOH) in 2005-2006 that each CCU bed costs the National Health Service (NHS) around£1,800 a day, including the nursing cost (DOH2006, [129]). However, in 2006-2007 the DOH (DOH2007, [130]) changed their costing policy and now calcu-lates the cost per CCU patient according to the number of organ failures they have rather than the average cost of a bed.
1.1.2
Critical Care Unit Nurses
Due to the severity of the illness of patients in the CCU, the general policy in the United Kingdom is to allocate one nurse to each critical care patient at all times. One nurse may care for two less sick patients, and occasionally a particularly sick patient may require two nurses. Elsewhere in Eu-rope the nurse to patient ratio is usually 1:2 or 1:3, although the units are larger and have a higher proportion of low risk patients. Currently in the UHW CCU there are 24 nurses scheduled per shift. Many critical care nurses will have completed a specialist training programme and have extensive experience and expertise. Not surprisingly, nursing salaries comprise the largest component of the intensive care budget. It was estimated that a high percentage of CCU bed costs are the nursing costs ([129]).
However, a shortage of qualified staff exists, which leads to refused admissions, cancellation of major elective operations, and a heavy and stressful workload for the existing nurses. To ease this problem, healthcare assistants are being increasingly used to undertake some of the more routine tasks.
Chapter 1 INTRODUCTION 3
1.2
Problems that Critical Care Units are Facing
There are a few problems associated with the CCU. The first problem that the CCU has to deal with is the shortage of beds. On average, 8% of patients are refused admission to a CCU because the Unit is full (Audit Commission Report, 1999 [6]). The CCU occupancy rates for some hospitals are reportedly very high (Smith, 1995 [151] and Mitchell, 1995 [126]) and a shortage of beds has been identified throughout the UK.
Shortages of CCU beds can cause unwanted consequences to patients, some of which may prove fatal. The greatest impact of the insufficient number of CCU beds is on potential patients await-ing elective surgery. These patients are considered to be low priority patients. Major operations may be cancelled, often at a very short notice, because there is no available CCU bed in which the patient can recover post-operatively. In addition to the unnecessary stress generated by a surgery cancellation, the delay may have serious medical consequences. On average, the CCUs report three cancelled operations for every 100 patients who they were not able to admit (Audit Commission Report, 1999 [6]).
The second problem associated with critical care is a shortage of CCU trained staff. The sever-ity of illness of critical care patients generates the need for a 1:1 nurse to patient ratio. Thus, the provision of more CCU beds would necessitate the employment of more CCU nursing staff. The specialist and high-skilled nature of critical care generates the requirement for a high proportion of nurses with relevant training. Many trusts have reported a distinct shortage of critical care nurses, particularly those trained to the English National Board For Nursing standard (ENB), which is the specialist training in critical care nursing (Audit Commission Report, 1999 [6]).
Further problems that CCUs have to deal with are costs. The cause and effects of shortages of resources, namely beds and nurses, were examined previously. An intuitive solution to these prob-lems would be the provision of more resources. However, the relative benefits of providing more critical care beds and employing more nursing staff must be weighed up against the cost to the NHS. The provision of critical care is more expensive than other types of healthcare due to a higher staffing requirement, specialist equipment and therapeutic interventions. In fact, a study has shown that provision for a critical care patient can cost up to six times more than a patient on the general ward (Royal College of Anaesthetists and Royal College of Surgeons, 1996 [140]). The annual UK bill for critical care was estimated at£675-725 million in 1997 [46], with the conjecture that it is increasing at the rate of 5% each year. This increase in expenditure comes as a result of new inter-ventions and medical advances, requiring more costly equipment. In addition, staff costs contribute to over 50% of the total CCU expenditure, with approximately 90% of this utilised to employ nurses ([6]).
Chapter 1 INTRODUCTION 4
One approach, based on mathematical modelling, that successfully addresses problems in the healthcare systems is queueing theory.
1.3
Queueing Theory
Queueing theory is one of many sub-disciplines of OR. Much of the initial work on queueing the-ory is attributed to Erlang. The author in his 1909 paper entitled “The Thethe-ory of Probabilities and Telephone Conversations” [47] analysed waiting times for call connections on the Copenhagen telephone system. The author continued his studies into the next decade and in 1917 published some of his most influential work. The paper “Solution of some Problems in the Theory of Proba-bilities of Significance in Automatic Telephone Exchanges” [48] established formulae for loss and waiting time - these have since become prominent results in the field.
Much of the theory is devoted to the derivation of performance measures evaluating characteristics such as the throughput, probability of delay, number of queueing items and the expected waiting time of customers in the queue (see, for example Stewart, 2009 [152]). Queueing theory may be utilised to ensure that queues do not build up excessively, whilst servers are active a reasonable proportion of time.
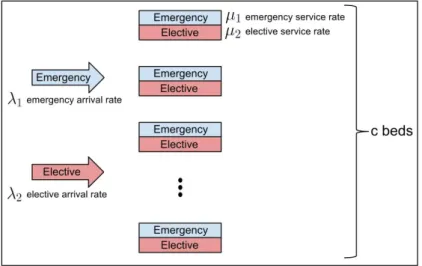
In the context of queueing theory, one may think of a service system as comprising of two elements: the service facility itself, which may be staffed by a number of servers; and a queue for service (except in specific cases where it may be specified that queueing is not permitted). At each facility, customers arrive and queue for some activity. Such a situation is depicted in Figure 1.1:
Figure 1.1: The fundamental diagram of queueing theory
Every queueing network is characterised by two major components: the arrival process and the ser-vice process. Queueing theory involves setting up mathematical models corresponding to Figure 1.1, analysing the system, and evaluating various performance measures. Since these processes are usually stochastic by nature, queueing theory is based on probabilistic analysis. The main charac-teristics are outlined below, and further details are given in Stewart, 2009 [152].
The arrival process defines how customers arrive at the service facility (e.g. singly or in batches) and how these arrivals are distributed in time. Throughout this thesis it is assumed, if not otherwise stated, that customers arrive at random with mean arrival rateλ, in a Poisson manner, so the
inter-Chapter 1 INTRODUCTION 5
arrival times are independently and exponentially distributed.
The queue discipline describes the order in which customers enter and leave the queue. This may be on a “first-in-first-out” (F IF O) basis, “first-in-last-out” (F ILO) basis, “random-in-random-out” (RIRO) basis or in terms of priority.
The service mechanism outlines the resources needed for service to occur. The service time distri-bution defines how long the service will take, whilst other parameters such as the number of servers available, and whether the servers are in series (each server has a separate queue) or in parallel (one queue for all customers), must all be known in advance before analysis may be performed. In systems where the exponential distribution is assumed to provide an accurate representation of the distribution of service times, its Markovian (memoryless) property allows one to map the system to a continuous-time Markov chain which can be solved analytically. Similarly to the Poisson dis-tribution, the exponential distribution is defined by a single parameter. To distinguish between the mean service time and the mean service rate, it is common to denote the mean service rate byµ, so that µ1 represents the mean service time.
Additional notation commonly used in the literature to analyse queueing systems, and that will be followed throughout this thesis, may be outlined as follows:
• Pn,n= 0,1,2, . . .: the probability that there arencustomers in the system • c: the number of service channels
The quantity ρ = cµλ, which is referred to as server utilisation rate, traffic intensity or load per server, is a common measure of interest that represents the behaviour of the queue over time. Es-sentially, ifρ < 1then the servers are able to process customers faster than the rate at which they arrive, on average, so the queue will not grow infinitely long. If the system runs withρ < 1 for an adequate period of time with stable mean service and inter-arrival rates, then all systems char-acteristics will eventually settle down and the system will run at a consistent level, considered as ‘stable’ or ‘stationary’. When the system reaches this point of time, it is said to be operating in a steady-state fashion. It is this steady-state behaviour which has been intensively researched and is well-understood in the literature, since closed-form formulas have been derived to evaluate per-formance measures under these stationary conditions. The analysis of systems with non stationary arrival rates is however far more complex (Greenet al., 2006 [71]) and an overview of the literature on this topic is given in Section 4.2.1.
In 1953, a standard for the characterisation of queues was introduced by Kendall [98]. Kendall’s notation provides a convenient classification of a queueing system in the formA|B|C|D|Ewhere: (A) The inter-arrival distribution:
Chapter 1 INTRODUCTION 6
• M represents exponential, independent and identically distributed (IID) inter-arrival times;
• Drepresents deterministic (constant) IID inter-arrival times;
• Ekrepresents Erlang (with parameterk) IID inter-arrival times; • Grepresents general IID inter-arrival times;
(B) The service time distribution (again commonly categorised asM, D, Ek orG. Phase-type
dis-tributions may also be used to specify systems with inter-related Poisson processes occuring within phases);
(C) The number of servers; (D) The capacity of the system;
(E) The queue discipline e.g.F IF O, F ILOorRIRO;
For example in the M|M|1|∞|F IF O queueing system, M typically denotes Markovian inter-arrival / service times (i.e. exponentially distributed) and F IF O denotes the queue discipline first-in first-out, with no restriction on the capacity of the system and one server.
Kendall’s notation is commonly simplified to list only the first three characters A|B|C. In this format it is assumed that the queue discipline isF IF O, and no limits are imposed on the system capacity.
TheM/M/cmodel is one of the most widely researched models in the classic queueing literature since it is simultaneously capable of capturing randomness in arrival and service times. This permits the number of servers to be greater than one, and has the appealing benefit of a tractable steady-state solution. It represents a system with a single queue in which customers arrive at, and possibly queue, before being served by one of cservers. Arrivals occur according to a time-homogeneous Poisson process with a constant rate, and the service rate has an exponential distribution with a constant mean time. Such a system may be modelled as a basic birth-death process as described below (Stewart, 2009 [152]).
A birth-death process can be considered as a continuous time stochastic counting process
{N(t), t≥0}. LettingPn(t) =Prob{N(t) =n}be the probability that the system is in statenat
timet, the transition diagram of the birth-death process is illustrated in Figure 1.2. When a birth occurs, the system goes from statenton+ 1and when a death occurs it conversely goes from state nton−1. The process is specified by birth rates{λi}i=0,...,∞and death rates{µi}i=1,...,∞
Chapter 1 INTRODUCTION 7
Figure 1.2: State diagram of a birth-death process
In queueing systems that directly model the behaviour of people, who arrive at a service facility requiring a specific service to be performed, the number of customers in the system is an appropriate state variable;Pn(t)can be used to denote the probability that there arencustomers in the system
at time t. If λn does not depend on the number of customers in the system, then λ can be used
to represent the mean arrival rate of customers. If µ represents the mean service rate provided at each of the c identical servers at all points in time, then µn = cµ for n ≥ c and µn = nµ
for1 ≤ n < c. Under these conditions, the state probabilities evolve according to the following differential-difference equations (Stewart 2009 [152]):
dP0(t) dt =−λP0(t) +µP1(t), dPn(t) dt =−λPn−1(t) + (n+ 1)µPn+1(t)−(λ+nµ)Pn(t), 1≤n < c, (1.1) dPn(t) dt =−λPn−1(t) +cµPn+1(t)−(λ+cµ)Pn(t), n ≥c.
Equation 1.1 is often referred to as the balance or Chapman-Kolmogorov forward differential equa-tions. As the behaviour of the system settles to steady-state (as t → ∞) thenP0(t)andPn(t)are
independent of time, so dPndt(t) = 0forn = 0,1, . . ., giving:
−λP0+µP1 = 0,
λPn−1+ (n+ 1)µPn+1−(λ+nµ)Pn= 0, 1≤n < c, (1.2)
λPn−1+cµPn+1(t)−(λ+cµ)Pn, n≥c.
The steady-state probabilities defining the mean number of customers in the system are given by Equation 1.3 (for derivation of the summary measures, see Stewart 2009 [152]).
P0 = h Pc−1 n=0 λn n!µn + P∞ n=c λn cn−cc!µn i−1 Pn = λn n!µnP0, if1≤n ≤c−1 λn cn−cc!µnP0, ifn≥c. (1.3)
cus-Chapter 1 INTRODUCTION 8
tomers in the queue (Lq), the expected waiting time in the queue (Wq). While these measures both
give insights into the degree of congestion that exists within a system, the distribution of the queue-ing time, and in particular the probability of waitqueue-ing greater than timexin the queueP(Wq > x)
is often of greater interest, although more difficult to obtain analytically (Utley and Worthington, 2011 [158]).
Numerous authors such as Hershey et al., 1981 [86] and Artalejo and Lopez-Herrero, 2001 [5] have since progressed Erlang’s analysis of steady-state systems through deriving additional mea-sures, including the moments of the length of a busy period and expected utilisation for constrained network facilities. In service systems governed by targets that specify minimum required standards, models can be set up to provide the performance of the system under various staffing levels and to find the minimum number of staff required to ensure the expected measures exceed the threshold levels (see Section 4.4). Yet, since the steady-state formulas are only capable of giving a single recommendation of an optimal nursing level (as they can only be applied to situations where the arrival of customers is strictly stationary), the earlier papers tend to place greater emphasis on sys-tem insights than the use of performance measures for this type of exploratory investigation. Whilst much literature is devoted to the analysis of service systems with constant mean arrival and service rates (Green and Kolesar, 1991 [66]), most actual systems today are subject to time-varying demand, where arrival rates and the number of servers vary throughout the period of operation. Since admissions of elective patients to Critical Care Units are time dependent, Section 4.2.1 will provide more insight to time-dependent queueing theory.
1.4
Queueing Theory in Healthcare and Similar Environments
The use of queueing theory in a healthcare setting was rarely used until the pioneering work of Bailey, 1952 [10] appeared. In this paper queueing theory was used to develop an out-patient clinic scheduling system that gave acceptable results for patients (in terms of waiting time) and staff (in terms of utilisation). Homogeneity of patients was assumed as far as their service time distributions were concerned, and also it was assumed that all patients arrived for appointments on time. In more recent years, a vast number of queueing models have been developed for use in healthcare settings. Soon after, in 1954, a paper entitled “Queuing for Medical Care” was published by Bailey [11]. The author relates his study of an inpatient facility to Erlang’s work on telephony by considering patients as telephone calls and hospital beds as telephone channels. The length of stay (LoS) is equivalent to the duration of the call. The author deduced the average waiting time (through Erlang’s formula) and calculated the optimal number of beds required in the hospital. In subsequent years and decades, research interest in healthcare modelling through queueing theory has developed and there now exists a multitude of studies.Chapter 1 INTRODUCTION 9
A considerable body of research has shown that queueing theory can be useful in real-world health-care situations, and some reviews of this work have appeared. McClain, 1976 [121] reviewed re-search on models for evaluating the impact of bed assignment policies on utilisation, waiting time, and the probability of turning away patients. Nosek and Wilson, 2001 [131] reviewed the use of queueing theory in pharmacy applications with particular attention to improving customer satis-faction. Customer satisfaction is improved by predicting and reducing waiting times and adjusting staffing levels. Preater, 2002 [136] presented a brief history of the use of queueing theory in health-care and points to an extensive bibliography of the research that lists many papers (however, it provides no description of the applications or results). Green, 2006 [65] presented the theory of queueing as applied in healthcare. The relationship between delays, utilisation and the number of servers was discussed, including the basicM/M/cmodel, its assumptions and extensions, and the applications of the theory to determine the required number of servers. Fomundam and Herrmann, 2007 [53] summarised a range of queueing theory results in the following areas: waiting time and utilisation analysis, system design, and appointment systems. Their goal was to provide sufficient information to analysts who were interested in using queueing theory to model a healthcare process and who wanted to locate the details of relevant models.
The next section is an overview of research into using queueing theory as an analytical tool to pre-dict how particular healthcare configurations affect delay in patient service and healthcare resource utilisation.
1.4.1
Waiting Time and Utilisation Analysis
In a queueing system, minimising the time that customers have to wait and maximising the utili-sation of the servers or resources (doctors, nurses, hospital beds, etc.) are conflicting goals. This section is an overview of research into using queueing theory as an analytical tool to predict how particular healthcare configurations affect delay in patient service and healthcare resource utilisa-tion.
1.4.1.1 Reneging
When a patient is waiting in a queue, they may decide to leave the system because they do not wish to wait any longer. Death on the waiting list is also an example of reneging. The probability that a patient reneges usually increases with the queue length and the patient’s estimate of how long they must wait to be served. In systems where demand exceeds server capacity, reneging is the only way that a system attains a “state of dysfunctional equilibrium” (Hallet al., 2006 [79]).
An important example of such a system is an emergency department. Broyles and Cochran, 2007 [19] calculated the percentage of patients who left an emergency department without getting help based on factors such as arrival rate, service rate, utilisation and capacity. From this percentage,
Chapter 1 INTRODUCTION 10
they determined the resulting revenue loss.
It is possible to redesign a queueing system to reduce reneging. A common approach is to separate patients by the type of service required. Rocheet al., 2007 [139] found that the number of patients who leave an emergency department, without being served, is reduced by separating out non-acute patients and treating them in dedicated fast-track areas. Most of their waiting would be for tests or test results after having first seen a doctor.
1.4.1.2 Bulking
Queueing system in which multiple customers arrive simultaneously and / or are served in groups of random size are called Bulk Queueing Systems (sometimes Batch Queueing Systems).
Batch service
The concept of batch service was introduced by Bailey, 1954 [11]. In his influential study, it was as-sumed that the inter-arrival rate followed theχ2 distribution and utilised imbedded Markov chains
to find the solution. He studied waiting times for an out-patient appointment with a hospital con-sultant and concluded that if a clinic was held once per week and the concon-sultant was prepared to see at least one more patient than the average demand per week, then the average waiting time for an appointment would not be greater than one week.
The following year, Downton, 1955 [42] published results which were complementary to the work of Bailey. Dovnton calculated the variance of the waiting time distribution and was the first to publish tables of summary statistics for waiting times.
In 1976, Griffiths and Cresswell [73] applied the theory of batch service queues to a Pelican cross-ing. In this, the first application in this domain, several different aspects of the system mechanism were considered, such as the distribution of the queue of cars and pedestrians.
Chaudhryet al., 1987 [25] considered theM/G(a, b)/1queueing system. They employed the sup-plementary variable technique to find the post-departure and arbitrary time instant probabilities, and then used the results to find various summary measures including the mean queue length and the mean waiting time in the system.
Griffiths, 1995 [72] applied batch service queueing theory to the Suez Canal in a case study paper. The capacity of the Suez Canal was increased by 44%, by simply changing the cycle times from 24 to 48 hours.
Chapter 1 INTRODUCTION 11
Batch arrival
One of the first researchers to study batch arrivals was Donald Gaver, 1959 [59]. He considered the system whereby groups of customers arrived at a single service facility according to a station-ary compound Poisson process and utilised embedded Markov chains to investigate the busy period. Hawkes, 1965 [84] was the first to consider the time-dependent solution of a queue with bulk ar-rivals operating with a priority setting. Laplace transforms were used to consider a case for two classes of arrivals (priority and non-priority) and derived the equilibrium distribution (steady-state) for both classes of arrivals, as well as the distribution of the number of customers remaining in the system immediately after a departure occurred. The mean queueing times were also calculated for the case where the service time distribution was Negative Exponential.
One of the first explicit case study papers using the batch arrival queueing in a clinical setting was published by Lopezsorianoet al., 1981 [114]. Different hospital departments released their staff at different times for their lunch, enforcing a batch arrival queueing scenario. The authors sought to optimise the system such that long queues and excessive waiting times for customers during the lunch period were minimised. ‘What if’ type scenarios were tested and the performance of the system was evaluated.
Jacobet al., 1988 [94] discussed a queueing system with General inter-arrival and service times, one service facility and finite waiting space. The authors suggested two different rejection strategies which come into force when a batch arrives while there is not enough space in the buffer: either the entire batch is rejected or only the excess is rejected. The rejection probabilities were calculated and the waiting time distribution was considered.
Banik and Gupta, 2007 [12] investigated the system whereby customers arrived in batches to a finite buffer single server queue. The time between batch arrivals had a General distribution and the batch size was random. The service process was described as a Markovian service process. This model was then used to analyse two customer rejection policies, namely partial batch rejection and total batch rejection. Steady state distributions were developed at specific and arbitrary time instants. They obtained performance measures including the blocking probabilities and summary measures including waiting times.
1.4.1.3 Variable Arrival Rate
Although most analytical queueing models assume a constant customer arrival rate, many health-care systems have a variable arrival rate. In some cases, the arrival rate may depend upon time but be independent of the system state. For instance, arrival rates change due to the time of day, the
Chapter 1 INTRODUCTION 12
day of the week, or the season of the year (see extended literature review in Section 4.2.1). In other cases, the arrival rate depends upon the state of the system (see Chapter 6).
Worthington, 1987 [169] presented anM(λq)/G/cmodel for service times of any fixed probabil-ity distribution and for arrival rates that decreased linearly with the queue length and the expected waiting time. The arrival rate may increase over time due to population growth or other factors. Rosenquist, 1987 [141] studied how an increase in patient arrival rate affected waiting times and queue length for an emergency radiology service.
A system with congestion discourages arrivals. Worthington, 1991 [170] suggested that increasing service capacity (the traditional method of attempting to reduce long queues) had little effect on queue length because as soon as patients realize that waiting times would reduce, the arrival rate increases, which increases the queue again.
1.4.1.4 Priority Queueing Discipline
In most healthcare settings, unless an appointment system is in place, the queue discipline is either first-in-first-out or a set of patient classes that have different priorities (as in Critical Care Units, which treats emergency patients with life-threatening injuries before elective patients).
Taylor et al., 1969 [155] modelled an emergency anaesthetic department operating with priority queueing discipline. They were interested in the probability that a patient would have to wait more than a certain amount of time to be served.
Haussmann, 1970 [83] investigated the relationship between the composition of prioritized queues and the number of nurses responding to inpatient demands. The authors found that a slight increase in the number of patients assigned to a nurse and / or a patient mix with more high-priority demands resulted in very large waiting times for low priority patients.
McQuarrie, 1983 [123] showed that it is possible, when utilisation is high, to minimise waiting times by giving priority to clients who require shorter service times. This rule is a form of the shortest processing time rule that is known to minimise waiting times. It is found infrequently in practice due to the perceived unfairness (unless that class of customers is given a dedicated server, as in supermarket check-out systems) and the difficulty of estimating service times accurately. Worthington, 1991 [170] analysed patient transfer from outpatient physicians to inpatient physi-cians. The patient was assigned one of three priority levels. Based on the priority level, there was a standard time period before which a referred patient should be scheduled to see the inpatient physi-cian. The model assumed sufficient in-patient capacity to treat the highest priority category within
Chapter 1 INTRODUCTION 13
its standard time, and proposed sharing the remaining service capacity amongst the lower priority levels in such a manner that they each exceeded their standard target times by the same percentage. Siddhartanet al., 1996 [150] proposed a priority discipline for different categories of patients and then a first-in-first-out discipline for each category. They found that the priority discipline reduces the average wait time for all patients; however, while the wait time for higher priority patients re-duced, lower priority patients endured a longer average waiting time.
Tuft and Gallivan, 2001 [157] used a computer simulation to compare three years’ operation of different admission strategies: a first-come-first-served booking system, a triage booking system, and a waiting list system in which admissions were strictly ordered according to priority stratum. It was shown that the most effective system for minimising priority weighted delay is, at the time of outpatient assessment, to schedule surgery for the high priority patients for the first available operating slot, while assigning low priority patients to the most delayed slot that is feasible. When arriving patients are placed in different queues, each of which has a different service prior-ity, the queue discipline may be preemptive or non-preemptive. In the latter, low priority patients receive service only when no high priority patients are waiting, but the low priority patient who is receiving service is not interrupted if a high priority patient arrives and all servers are busy. In the preemptive queue discipline, however, the service to a low priority patient is interrupted in this event. Green, 2006 [65] presented models for both queue disciplines.
Fiemset al., 2007 [52] investigated the effect of emergency requests on the waiting times of sched-uled patients with deterministic processing times. It was a pre-emptive repeat priority queueing system in which the emergency patients interrupted the scheduled patients and the latter’s service was restarted as opposed to being resumed. The authors modelled a single server queue and di-vided time into equally long slots. During periods when there is an emergency interruption, it was assumed that no server was available for non-emergency patients.
1.4.1.5 Blocking
Blocking occurs when a queueing system places a limit on queue length. For example, an outpa-tient clinic may turn away walk-in paoutpa-tients when its waiting room is full. In a Critical Care Unit, where patients can wait only in a bed, the limited number of beds may prevent a Unit from accept-ing patients.
Kabak, 1968 [95] was the first to considercservice facilities in this context when he developed the M(n)/M/c batch arrival queue (with n arrivals in each batch). He examined the blocking
prob-Chapter 1 INTRODUCTION 14
abilities for a loss system and a delay system, and calculated the mean and variance of the delay time along with other numerical results.
McManuset al., 2004 [122] presented a medical-surgical Intensive Care Unit where critically ill patients can not be put in a queue and had to be turned away when the facility was fully occupied. This is a special case, where the queue length can not be greater than zero, which is called a pure loss model (Green, 2006 [65]).
Koizumiet al., 2005 [104] found that blocking in a chain of extended care, residential and assisted housing facilities resulted in upstream facilities holding patients longer than necessary. They anal-ysed the effect of the capacity in downstream facilities on the queue lengths and waiting times of patients waiting to enter upstream facilities. System-wide congestion could be caused by bottle-necks at only one downstream facility.
Chydzinski and Winiarczyk, 2008 [28] considered the blocking probability in a finite-buffer queue with arrivals following a batch Markovian process (BMAP). Firstly the authors gave a compre-hensive description of the BMAP under consideration. They then derived an expression for the transform of the blocking probability and demonstrated time-dependent and steady state character-istics from this expression. Numerical results were provided for two different types of BMAP. More detailed literature review specific to bed blocking subject will be included in Sections 5.2.4 and 6.5.4.2.
The second approach that succesfully addresses problems in the healthcare systems is simulation.
1.5
Simulation
Many previous researchers have developed simulation and queueing models to help manage bed capacities in hospitals (Harper and Shahani, 2002 [82]; Gallivan and Utley, 2011 [57]; Dumas, 1984 [45]; Gorunescu et al, 2002 [62]; Cooper and Corcoran, 1974 [34]). The remainder of this discussion of relevant previous research will now focus in particular on simulation models devel-oped specifically for CCUs.
Discrete event simulation has been widely utilised in modelling Intensive Care Units (ICUs); for example, Kimet al, 1999 [100] utilised a simulation model and queueing theory to describe activi-ties in an ICU at a hospital in Hong Kong. Objectives of the initial study were to determine whether the ICU has sufficient capacity. The authors concluded that the current ICU capacity of 14 beds is sufficient to handle patients at the current arrival rates. Also, the reservation of some of the Unit’s
Chapter 1 INTRODUCTION 15
beds for the sole use of elective patients was considered. Subsequent to this research, the simulation model was updated and used to evaluate methods of managing the existing beds more efficiently (Kimet al, 2000 [101]). It was found that the elective surgery patients caused the most disruption to the Unit and so a number of bed reservation schemes were evaluated. It was suggested that some ICU beds could be reserved for the exclusive use of elective surgery patients. It was proposed that this would reduce the number of cancelled elective surgeries and the simulation model supported this proposition.
The simulation model was utilised to explore the possibility of using elective surgery quotas (for example one per day) in conjunction with a scheduling window (one or two weeks) to reduce the demand fluctuations of patients requiring intensive care following elective surgical procedures and thus reducing elective surgery cancellation rates (Kimet al, 2002 [99]). It was determined that the combination of a daily quota schedule and reserving beds exclusively for elective surgery patients can greatly reduce the number of cancelled surgeries with minimal negative consequences for the other patients.
Classification and Regression Tree (CART) analysis is a very useful tool for the creation of similar patient groups and has been utilised in many simulation models. Shahaniet al, 2008 [148] utilised CART analysis to create homogeneous groups of patients to feed into a simulation model. Several ‘what if’ scenarios were tested including an increase in capacity and the transfer of long stay pa-tients onto a different ward.
Costa et al, 2003 [35] also used CART analysis to generate similar patient groups in the CCU. Their model gave emergency patients priority status over elective patients. Also they showed that capacity planning in the CCU can not simply be based on averages as this may generate an under-estimation of resource needs during busy periods.
A dynamic simulation model was built of the CCU at the Cincinnati VA Medical Centre, Ohio by Cahill and Render, 1999 [22] to model the time varying behaviour of a system. They tested several alternative bed configurations to see whether a high bed occupancy level (81%) could be reduced to something more acceptable. It was found that the addition of telemetry and respiratory care beds would result in improved availability of ICU beds and that the addition of heart Emergency Room (ER) beds would resolve the ICU access problems. Unexpectedly, the increased ICU bed availabil-ity resulted in increased hospital bed utilisation and increased length of stay on the hospital service. It was therefore concluded that targeted reductions in length of stay would be needed before the implementation of the new plans.
Chapter 1 INTRODUCTION 16
and tested the scenario of reserving a pooled number of beds across the region for emergency ad-missions. The model could predict the optimal number of regional beds required for any given acceptance rate of emergency admissions.
The question of the maximum number of elective surgeries administered each day to avoid diversion or cancellations of surgeries was addressed by Kolker, 2008 [106]. The Unit under consideration was large (51 beds), and the optimal number of surgeries scheduled each day was deemed to be four. Optimal nursing requirements were addressed in [75] by Griffiths et al, 2004. A discrete event simulation model of an ICU was built inSimul8and various ‘what if’ scenarios relating to nurse numbers were investigated.
1.6
Conclusions
Literature contained in this chapter has a general character and it highlights where and how queue-ing theory can be used in healthcare environment. A more detailed literature review specific to subjects described in this thesis is included in later sections:
• Simulation modelling of hospitals with special emphasis of modelling Critical Care Units (Section 1.5)
• Time-dependent aspects in queueing theory (Section 4.2.1)
• Staff requirements (Section 4.4.2)
• Resource planning and bed allocation (Section 6.5.2)
• Game theory (Section 7.2)
1.7
Outline and Structure of Thesis
The primary objective of this study is to show how a mathematical modelling approach is able to provide quantitative evidence to aid decision making in a critical care environment. Thus math-ematical models of the Critical Care Unit (CCU) environment will be developed. Furthermore, consideration will be given to the impact of collaboration or lack thereof between hospitals using a game theoretical approach.
The research included in this thesis can be divided into three main parts as shown in Figure 1.3. The first part will carry out an analysis of data provided by the University Hospital of Wales in Cardiff (UHW) to determine arrival and service patterns, resource numbers and the flow of patients
Chapter 1 INTRODUCTION 17 Chapter 1 Intro Chapter 5 & 6 Part II Chapter 7 & 8 Part III Chapter 2, 3 & 4 Part I
Figure 1.3: Thesis structure
through the Unit. Both computer simulation and theoretical queueing models will be considered. The models will be utilised to suggest improvements to the running of Unit, potential cost-saving measures, and the consequences of implementing certain new procedures such as admitting extra elective patients at non-busy times.
The second project describes work undertaken with managers from the Royal Gwent Hospital in Newport and at the Nevill Hall Hospital in Abergavenny. Data from both CCUs will be analysed to define arrival and service processes. A theoretical queueing model will be considered which will be used to investigate the significance of combining the two units. The model will be also utilised to advise on the number of beds the new combined unit should have in order to satisfy targets quoted by the hospital managers.
In the final part of the thesis, a game theoretical model will be proposed of two CCUs to study the effect of patient diversion. To investigate the impact of patients transfers, a Markov chain model of the two CCUs will be set-up, each admitting two arrival streams: namely, their own patients and transfers from other CCU.
Chapter 2
Summary Statistics of Patients’ Flow
Through the Critical Care Unit at the
University Hospital of Wales
2.1
Introduction and Objective of the Study
It is intended that this chapter gives an insight of how the Critical Care Unit (CCU) at the Univer-sity Hospital of Wales in Cardiff (UHW) operates. It will describe the importance of having critical care resources, including accessible beds and nurses available. The work described in Section 2.3 analyses the actual data from the CCU at the UHW to determine arrival and service patterns, re-source numbers and the flow of patients through the Unit. Also, the main highlight of this chapter is that elective patients have very different profiles of admission and duration of stay from emergency patients; therefore any analysis should account for two different patient categories.
The primary objective of this project is to develop a mathematical model of the critical care envi-ronment. Computer simulation and theoretical models will be utilised to suggest improvements to the running of Unit, potential cost-saving measures, and the consequences of implementing new procedures.
2.2
Background
This part of the thesis investigates activities at the CCU at the UHW, which is the amalgamation of the previous ITU and HDU (High Dependency Unit). This amalgamation occurred in 2003 and the Unit has been running as a combined Unit ever since. The beds in the Unit can either be used as HDU or ITU beds. The CCU, which is the largest in Wales, consists of 24 beds with five additional beds that can be utilised in periods of peak demand. The five additional beds, which are based in
Chapter 2 SUMMARYSTATISTICS OF PATIENTS’ FLOW IN THECCUAT THE UHW 19
the Unit, are only utilised in very exceptional circumstances. These beds are currently unfunded, which means that to use any of them requires the employment of an agency nurse due to 1:1 or 1:2 nurse to patient ratio for most patients required in such a ward. Since it is the largest CCU in Wales, very often patients from all over Wales are treated at this Unit. The CCU beds are very expensive and a limited resource because they provide specialised monitoring equipment, a high degree of medical expertise and constant access to highly trained nurses.
2.2.1
Patients
The CCU at the UHW is the largest CCU in Wales it provides specialist care for a great percentage of the Welsh population. Patients are admitted onto the Unit from 6 different sources; Emergency Surgery, Elective Surgery, A&E, the Wards, Other Hospital and X-Ray.
Intensive care beds are occupied by patients with a wide range of clinical conditions, but all have a dysfunction or failure of at least one organ, particularly respiratory and cardiovascular systems. Patients usually require intensive monitoring, and most need some form of mechanical or phar-macological support such as mechanical ventilation or renal replacement therapy. As patients are admitted from most of departments in the hospital, staff in the CCU need to have a broad range of clinical experience and a holistic approach to patient care.
2.2.2
Data
The data set used in this study was provided by technical staff at the CCU of the UHW; it has fairly complete records for a period of six years; between1stof January 2004 and31stof December 2009.
As of June 1989, the collection of data at the UHW has followed guidelines proposed by the Riyadh ICU program (RIP), Medical Associated Software House Ltd, London, UK. The Riyadh predictive algorithm was first developed at the Riyadh Armed Forces Hospital, Saudi Arabia in 1984. The Riyadh ICU program formed the basis of the method by which many CCUs, including the CCU at the UHW, collate their data currently.
There are two main databases contained within the Riyadh ICU program. The first contains detailed patient information which is collected on the patients’ admission to the Unit and on their departure. The second database contains data that is recorded on each day that the patient spends in the Unit. Example of the information collected on admission to the CCU is: the patients’ personal details (name, address, etc.). Note that personal details were not provided in our data set due to patient confidentiality; individual patients are identified using their CCU identification number. Other in-formation collected are: patient demographics (age, gender, etc.), the source of the patient’s arrival,
Chapter 2 SUMMARYSTATISTICS OF PATIENTS’ FLOW IN THECCUAT THE UHW 20
date and time of arrival and over a hundred of physiological factors detailing the patient’s previous and current health status such as body temperature or blood pressure, measured on each day the patient stayed in the CCU. Data collected when the patient is discharged from the Unit includes date and time of discharge, whether or not they have survived, and the destination to which they are being discharged.
In the UHW there is a separate Paediatric Critical Care Unit, so only data on patients aged sixteen or over were used in this analysis. With these restrictions, and the condition regarding date of ad-mission (each patient must be admitted on or before the31st December 2009) the data set available
for use in the analysis has 8433 patients records.
2.3
Summary Statistics
The main objective of the work described in this section is to determine appropriate statistical distributions that could accurately represent the profile of arrivals to the CCU and lengths of stay in simulation and queueing models, which will be described in Chapter 3.
2.3.1
Arrivals and Discharges
Recall that patients are admitted to the CCU from six different sources. They are: Emergency Surgery, Elective Surgery, A&E, the Wards, Other Hospital and X-Ray. The percentages of patients who were referred from each source of admission are presented in Figure 2.1.
Figure 2.1: Source of admission
The largest source of admission is Elective Surgery which accounts for 31% of admissions. The smallest source of admittance is X-Ray which accounts for only 0.8% of all admissions.
Chapter 2 SUMMARYSTATISTICS OF PATIENTS’ FLOW IN THECCUAT THE UHW 21
While categorisation of patients by source of admission may be useful for hospital administration purposes, it is not entirely suitable from a modelling perspective. Categorising the patients ac-cording to whether or not their admission was planned would be much more revealing. Thus, for the remainder of this project the source of admission will be sub-classified into two groups; emer-gency and elective admissions. Emeremer-gency admissions are the unplanned admissions, over which the hospital has very little, or no, control. The second group are elective admissions, the planned admissions that hospital has control over.
It is not clearly apparent from the data set whether an admitted patient is an emergency or elective case, but some of the variables from the data set enable the patient type to by judged. The criterion that patients must satisfy to be classed as an elective patient are as follows. The surgery type must be elective, or post operative monitoring must have been planned. Also according to the Director of the CCU, 20% of patients admitted from wards, other hospitals or X-Ray following surgery are elective patients. Elective admissions account for 2687 cases, which is 31.86% of all admissions. The rest of the patients are emergency cases and they account for 5746 cases, which is 68.14% of all patients admitted.
The day of the week was considered for each admission. Table 2.1 indicates the percentage of arrivals on each day of the week during the study period (312 weeks). The Unit is facing the high-est influx of patients on Thursday and Friday following by the lowhigh-est proportion of patients being admitted on Saturday and Sunday. To understand why this is the case, arrival data was split into emergency and elective category of arrival and subsequently into day of arrival (Monday-Sunday). The daily admittance patterns of patients by patient type are represented graphically in Figure 2.2.
Table 2.1: Percentage of admissions on each day of the week Day of the week Percentage, %
Monday 13.92 Tuesday 15.22 Wednesday 15.16 Thursday 17.31 Friday 16.36 Saturday 11.31 Sunday 10.72
Clearly, the number of elective arrivals is dependent on the day of the week. There is a large num-ber of admissions on Wednesday, Thursday and Friday, with very few admissions on the weekend. This result is of course in accordance with expectations since surgeons would be required to work antisocial hours to operate on elective patients admitted on weekends. Also, from Monday through
Chapter 2 SUMMARYSTATISTICS OF PATIENTS’ FLOW IN THECCUAT THE UHW 22
Figure 2.2: Daily arrival patterns for emergency and elective patients
to Friday, on average more than one elective arrival occurs each day.
By investigating emergency arrivals it can be seen that they are fairly equally distributed during the week. Recall that emergency patients are unplanned, possibly following a serious accident or rapid deterioration in condition. Therefore, distinct patterns in daily arrival times would not be expected for these patients.
Figure 2.3: Hourly peaks of emergency and elective admissions
Any hourly admission trends are also examined. Figure 2.3 displays the percentage of admissions of emergency and elective patients, according to various hours of the day. There is an obvious hourly arrival trend for elective patients. The majority of admissions of patients following elective surgery are in the afternoon or evening, between 4pm and 9pm. The majority of surgeries are
sched-Chapter 2 SUMMARYSTATISTICS OF PATIENTS’ FLOW IN THECCUAT THE UHW 23
uled to start in the morning or afternoon and correspond to arrivals at the CCU in the afternoon or evening, depending on the duration of the surgical procedure. However, there is no obvious hourly trend for emergency patients except that there are very few admissions between 3am and 11am. The arrival process needs to be analysed for later modelling purposes. Summary statistics for the daily arrival numbers at the CCU are given in Table 2.2. On average 3.83 patients get admitted to the CCU every day, but on some occasions data showed up to 12 admissions on one day.
Table 2.2: Summary statistics for the number of patients (elective plus emergency) admitted on each day
Summary statistic Value
Mean 3.8312
Median 4
Standard Deviation 2.1136
Minimum 0
Maximum 12
On inspection of the frequencies of the number of admissions per day, it was suggested that the distribution may be modelled by a Poisson distribution. Analysis was carried out to investigate whether this was reasonable. The next task was to determine values for the parameter α which would provide the most appropriate fit to the distribution of the number of arrivals at the CCU each day. This was achieved using the optimisation tool: Microsoft Excel Solver. For the remaining of this thesis it will be calledSolver.
Solver uses the simplex method to solve linear problems. The optimal solution is generated via an iterative method, where each solution has a lower objective function value than the previous. Hence, the solution becomes closer to the optimal after each iteration. However, care must be taken when searching for a global optimal solution, since local optima may be produced.
Consider now the formulation of the problem to be solved. Recall that values for the parameter αwhich would provide the most appropriate fit to the distribution of the number of arrivals at the CCU each day are required. The frequencies of the number of arrivals at the CCU on each day have been obtained from the data. Corresponding probabilities from the Poisson distribution were calculated by the probability distribution function (PDF):
P(X =x) = e
−ααx
x! x= 0,1,2, ...
Pois-Chapter 2 SUMMARYSTATISTICS OF PATIENTS’ FLOW IN THECCUAT THE UHW 24
son distribution and from the probabilities calculated from the actual data are evaluated. Finally, a calculation is made of the sum of the square of the deviations, and input into a single cell.
Solveris utilised to find the optimum values forα. The derived value ofα= 3.7611gives a value for the sum of deviations squared of 0.00104, hence a good fit. In this case and for the remaining of this thesis no formal statistical tests will be performed to assess goodness of fits. The decision whether the distribution describes the data well will be based on graphical representation and the low value of the sum of deviations squared. An interesting observation was made by Raftery, 1995 [137], where he claimed that P-values and the tests based upon them give unsatisfactory results, especially in large samples.
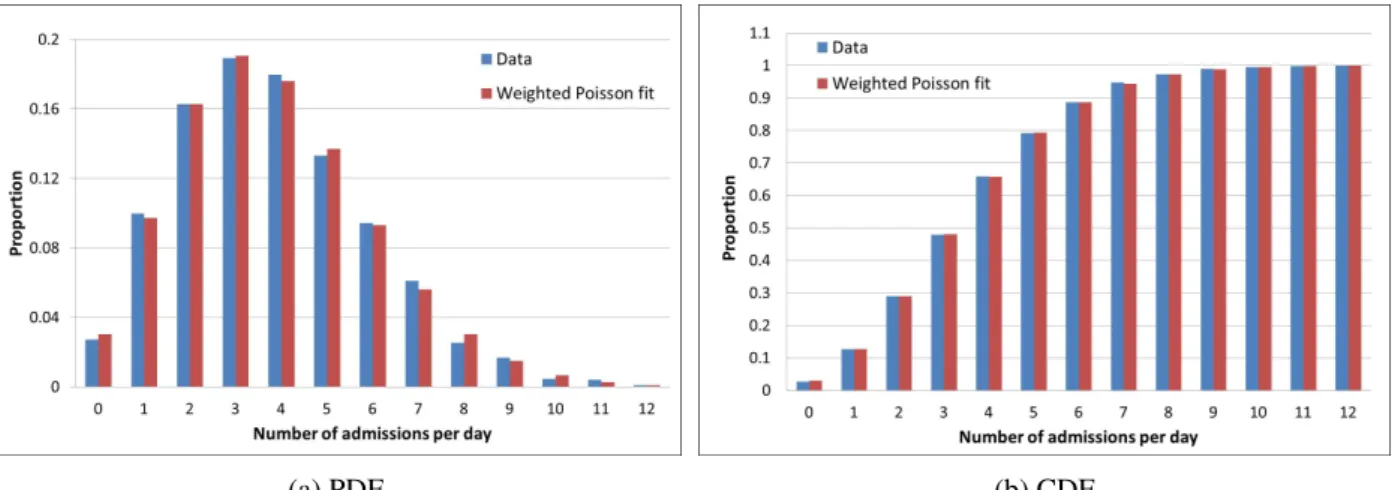
Figure 2.4 displays a frequency of the number of admissions on each day along with the fitted Pois-son distribution. Visibly, the PoisPois-son distribution underestimates the frequencies of low numbers of admission and also high numbers of admissions, and consequently overestimates the frequency of a mid-number of admissions per day. Thus, the Poisson distribution in its present form is not quite suitable as a representation of the distribution of the number of daily arrivals to the CCU.
(a) PDF (b) CDF Figure 2.4: Poisson fit to the distribution of all admissions
It is decided to consider the Weighted Poisson Distribution, which could increase the probability of small and high number of admissions per day and decrease the probability of mid-number of arrivals per day. Corresponding probabilities of the number of arrivals from the Weighted Poisson distribution were calculated by the PDF:
P(X =x) = ωe −α1α 1x x! + (1−ω) e−α2α 2x x! x= 0,1,2, ...
The Weighted Poisson distribution requires specification of three parameters, namely ω, α1, α2