2 ROP Project Categories
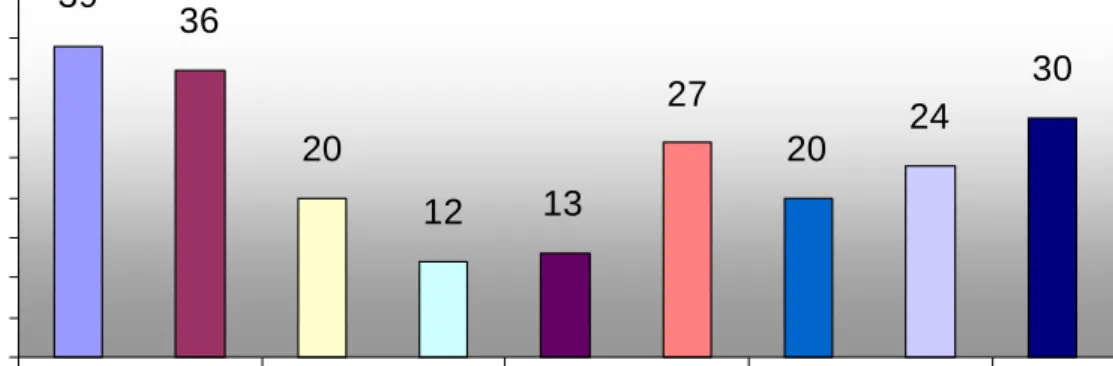
Each ROP report identifies a series of proposed projects consistent with regional and statewide operations objectives. From all the ROPs in total, there were 221 projects identified. The number of ROP projects identified in each region is indicated below in Figure 3.
ROP Projects per Region
N = 221
39 36 20 12 13 27 20 24 30 0 5 10 15 20 25 30 35 40 45 Nor thwes t D ist ri ct 2 N o rth C e n tra l N o rt heas ter n R e gi on 5 DVRPC/ Dist ri ct 6 S o ut h C e nt ra l S out her n A llegh eni es S out h w es ter n Region N o . of P roje c tsFigure 3: ROP Projects per Region
For analysis purposes, each ROP project has been associated with an operational category. The categories are:
• Incident Management
• Traveler Information
• Traffic Signals
• Other
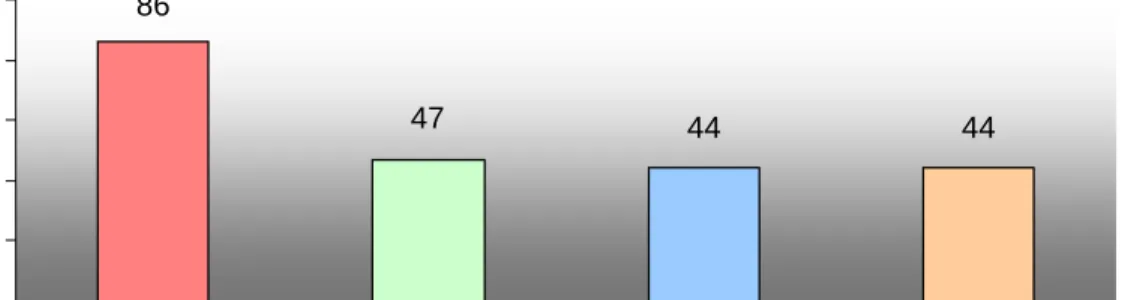
Although there was a great deal of overlap within ROP projects between categories, each project has been assigned to only one category. Figure 4 shows a high-level view of ROP project categories statewide.
ROP Projects by Category
N = 221
86 47 44 44 0 20 40 60 80 100 Incident ManagementTraveler Information Traffic Signals Other Categories RO P P ro je c ts
Figure 4: ROP Projects by Category
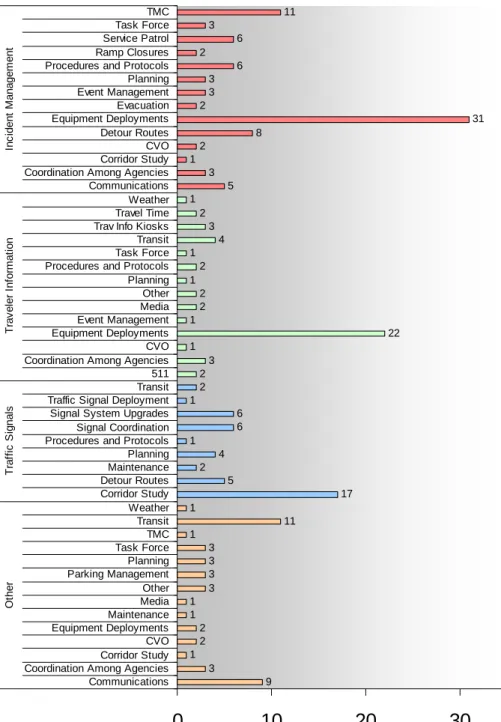
Each project has also been assigned to a subcategory, allowing a deeper level of analysis to the ROP effort. As with the project categories, ROP projects showed a large amount of overlap between subcategories, but for consistency were assigned to only one subcategory. Some subcategories, however, may exist under several different categories. For example, the “transit” subcategory has projects under both the “Incident Management” and “Traveler Information” categories, depending on the nature of the ROP project. A count of ROP projects statewide, both by category and subcategory, is displayed in Figure 5.
ROPs by Category and Subcategory
N = 221
9 3 1 2 2 1 1 3 3 3 3 1 11 1 17 5 2 4 1 6 6 1 2 2 3 1 22 1 2 2 1 2 1 4 3 2 1 5 3 1 2 8 31 2 3 3 6 2 6 3 11 0 10 20 30 Communications Coordination Among Agencies Corridor Study CVO Equipment Deployments Maintenance Media Other Parking Management Planning Task Force TMC Transit Weather Corridor Study Detour Routes Maintenance Planning Procedures and Protocols Signal Coordination Signal System Upgrades Traffic Signal Deployment Transit 511 Coordination Among Agencies CVO Equipment Deployments Event Management Media Other Planning Procedures and Protocols Task Force Transit Trav Info Kiosks Travel Time Weather Communications Coordination Among Agencies Corridor Study CVO Detour Routes Equipment Deployments Evacuation Event Management Planning Procedures and Protocols Ramp Closures Service Patrol Task Force TMC O th e r T raf fi c S ign al s T rav e le r I n fo rm a ti o n Inc id e n t M a nag em en t C a te gor ie s ROP ProjectsThe following figures list ROP project counts by category and subcategory according to its region. Each of the nine ROP regions has its own figure, as shown in the following charts.
Northwest ROP Projects N = 39 1 5 12 6 1 1 7 1 1 2 2 0 2 4 6 8 10 12 14 Communications Transit Corridor Study Signal Coordination Signal System Upgrades 511 Equipment Deployments Trav Info Kiosks Detour Routes Equipment Deployments TMC O ther Tr a ff ic S ignal s T rav I n fo Inc ident M a nagem en t Ca te go ri e s ROP Projects
Figure 6: Northwest ROP Projects by Category
District 2 ROP Projects N = 36 1 2 4 5 1 9 2 1 1 1 1 4 1 1 1 1 0 2 4 6 8 10 CVO Other Transit Detour Routes Traffic Signal Deployment Equipment Deployments Transit Trav Info Kiosks Weather Communications Detour Routes Equipment Deployments Event Management Procedures and Protocols Ramp Closures TMC Ot her T ra ffi c S ignal s T rav I nf o Inc id ent M an agem ent Ca te g o ri e s ROP Projects
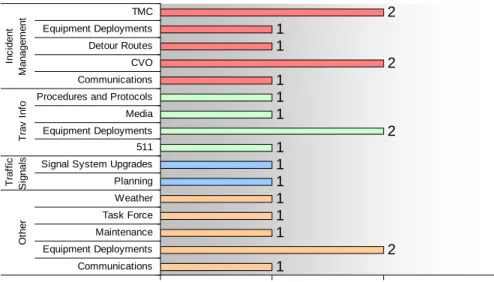
North Central ROP Projects N = 20 1 2 1 1 1 1 1 1 2 1 1 1 2 1 1 2 0 1 2 3 Communications Equipment Deployments Maintenance Task Force Weather Planning Signal System Upgrades 511 Equipment Deployments Media Procedures and Protocols Communications CVO Detour Routes Equipment Deployments TMC O ther Tr a ff ic S igna ls T rav I nf o Inc iden t M ana gem ent C a te gor ies ROP Projects
Figure 8: North Central ROP Projects by Category
Northeastern ROP Projects N = 12 1 1 1 1 1 1 1 2 1 1 1 0 1 2 3 Planning Procedures and Protocols Task Force Communications Detour Routes Event Management Planning Procedures and Protocols Service Patrol Task Force TMC O the r T ra v I n fo In c iden t M a nage m e nt Cat e gor ie s ROP Projects
Region 5 ROP Projects
N = 13
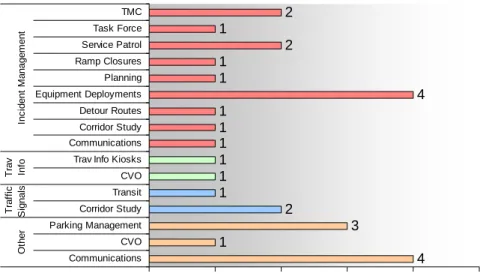
1 1 1 1 1 1 1 1 1 1 1 1 1 0 1 2 3 Corridor Study Coordination Among Agencies Event Management Media Transit Travel Time Communications Coordination Among Agencies Detour Routes Equipment Deployments Procedures and Protocols Service Patrol TMC Tr a ff ic S ignal s T rav I nf o Inc ident M anagem ent C a te gor ie s ROP ProjectsDVRPC/District 6 ROP Projects N = 27 4 1 3 2 1 1 1 1 1 1 4 1 1 2 1 2 0 1 2 3 4 5 Communications CVO Parking Management Corridor Study Transit CVO Trav Info Kiosks Communications Corridor Study Detour Routes Equipment Deployments Planning Ramp Closures Service Patrol Task Force TMC O ther T ra ffi c Si g n a ls Tr a v In fo In c iden t M ana gem ent Cat e gor ie s ROP Projects
Figure 11: DVRPC/District 6 ROP Projects
South Central ROP Projects N = 20 1 1 1 2 1 1 1 1 2 1 6 1 1 0 1 2 3 4 5 6 7
Coordination Among Agencies Corridor Study Planning Task Force Corridor Study Planning Signal System Upgrades Transit Other Coordination Among Agencies Equipment Deployments Planning Service Patrol O th e r T ra ffi c Si g n a ls Tr a v In fo Inc iden t M a na ge m e n t Cat e gor ie s ROP Projects
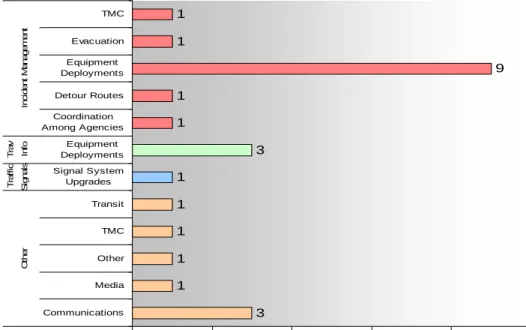
Southern Alleghenies ROP Projects N = 24 3 1 1 1 1 1 3 1 1 9 1 1 0 2 4 6 8 10 Communications Media Other TMC Transit Signal System Upgrades Equipment Deployments Coordination Among Agencies Detour Routes Equipment Deployments Evacuation TMC O ther Tr a ff ic S ign al s Tr av In fo Inc id ent M a nag em en t Ca te g o ri e s ROP Projects
Figure 13: Southern Alleghenies ROP Projects by Subcategory
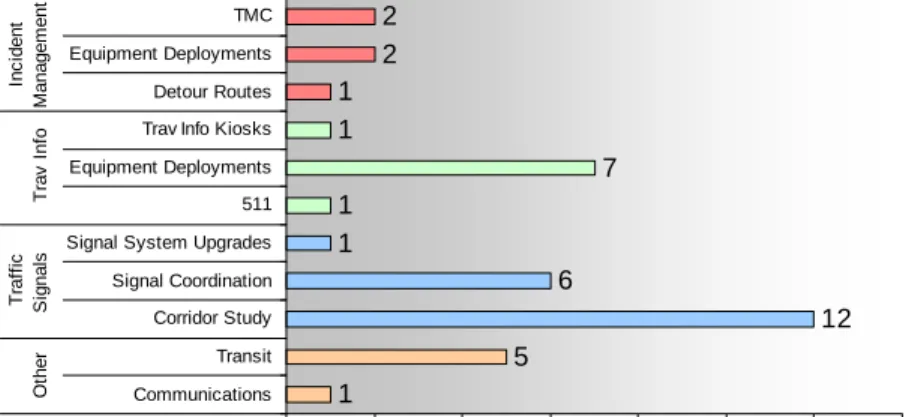
Southwestern ROP Projects N = 30 2 1 1 1 2 2 1 2 2 1 1 1 1 1 4 1 1 2 1 1 1 0 1 2 3 4 5
Coordination Among Agencies Planning Transit Corridor Study Maintenance Planning Procedures and Protocols Signal System Upgrades Coordination Among Agencies Equipment Deployments Planning Transit Travel Time Detour Routes Equipment Deployments Evacuation Event Management Procedures and Protocols Service Patrol Task Force TMC O ther T ra ffi c S ignal s T rav I nf o Inc ident M anagem ent Ca te go ri e s ROP Projects h