Performance Evaluation of Multi-Stage
Change-Point Detection Scheme against
DDoS Attacks by Random Scan Worms
Tutomu Murase*, Yukinobu Fukushima**, Masayoshi Kobayashi*, Sakiko Nishimoto**, Ryohei Fujimaki* and Tokumi Yokohira**
*NEC Corporation, 1753 Shimonumabe, Nakahara-ku, Kawasaki, Kanagawa, 211-8666, Japan **Okayama University, 3-1-1 Tsushima-naka, Okayama, Okayama, 700-8530, Japan
E-mail: [email protected], Tel: +81-86-251-8248, FAX: +81-86-251-8255
Abstract- As a promising approach for large-scale simultaneous events (e.g., DDoS attacks by unknown worms), we have proposed a multi-stage change-point detection scheme. In the scheme, the global detector gathers information from distributed change-point detectors and detects simultaneous occurrence of change-points as target events. Because the scheme neglects sporadic false-positive change-points, which are caused by non-target events such as hardware troubles and normal traffic changes, the scheme can achieve low false-positive rate. In the previous paper, we investigated the performance of the scheme against DDoS attacks by a real worm, MSBLAST. In this paper, we investigate the performance of the scheme against general DDoS attacks with various scales and simultaneities. In addition, we investigate the effect of the length of detection-period for the global detector on detection performance, where the detection-period means the period during which the global detector regurarly checks whether or not target events occur. The simulation results show that (1) our multi-stage change-point detection scheme achieves lower false-positive rate than a stand-alone change-point detector scheme under the constraint that detection rate must be 1.0, (2) even if the length of detection-period for the global detector is not appropriately set, our scheme can achieve better performance than a stand-alone change-point detector scheme thanks to filtering effect of the global detector.
I. INTRODUCTION
With the development of the Internet into a widely used information exchange infrastructure, there has been a marked increase in malicious activity. In particular, large-scale simultaneous events, such as distributed denial of service (DDoS) attacks and worm epidemics, cause catastrophic damage. A detection scheme that is capable of detecting these events is required.
Intrusion detection systems (IDSs) are mainly used for the detection of large scale simultaneous events. There are two types of detection schemes used on IDSs: signature-based schemes [1, 2] and change-point detection schemes [3-7]. Signature-based schemes detect those events with a signature that uniquely identifies a specific malicious activity. Ref. [2] proposes a detection scheme that collects information and performs signature-based detection in a distributed manner. Although signature-based schemes can detect known viruses and worms, they cannot detect unknown or novel variants. On the other hand, change-point detection schemes can detect unknown viruses and worms as a change-point in a monitored metric, such as traffic rate or the number of accesses to a certain port.
However, they may detect change-points caused by non-target events, such as hardware problems and natural traffic changes. Such misdetection occurs because change-point detection schemes simply detect change-change-points in a monitored metric and do not take into account causes of change-points. Here, we consider change-points caused by non-target events to be false-positive change-points.
One way to reduce the number of false-positive change-points is to take into account the correlation among multiple change-points. True-positive change-points, which are caused by target events (i.e., DDoS attacks), tend to occur simultaneously and intensively in very large numbers, while false-positive change-points tend to occur independently. We can exclude false-positive change-points by excluding those that occur independently, based on information gathered from distributed sensor nodes. We call the distributed change-point detection scheme as the multi-stage change-point detection scheme and call the central device which gathers information from distributed change-point detectors as the global detector.
In the previous study [8], we showed the effectiveness of the multi-stage change-point detection scheme against DDoS attacks by a real worm, MSBLAST.
In this paper, we investigate the performance of our scheme against DDoS attacks by general random scan worms. The detection performance of our scheme depends on the following parameters: the scale of DDoS attacks (i.e., the number of subnets that have attack hosts), the simultaneity of DDoS attacks (i.e., the number of attack hosts that perform an attack behavior at the same time), and the length of detection-period for the global detector where the detection-period means the period during which the global detector regurarly checks whether or not target events occur. Thus, we try to answer the following questions:
• How much do the scale and the simultaneity of DDoS attacks affect the performance of the multi-stage change-point detection scheme?
• How much does the length of detection-period for the global detector affect performance of the multi-stage detection scheme?
We describe our multi-stage change-point detection scheme in section II. In section III, we present our simulation model and evaluation results. Section IV concludes the paper.
Fig. 1. Multi-stage change-point detection mechanism.
II. DETECTION SCHEME FOR LARGE-SCALE
SIMULTANEOUS EVENTS
A. Multi-Stage Change-Point Detection Mechanism We use a multi-stage change-point detection mechanism consisting of one global detector (GD) and many local detectors (LDs) to detect large-scale simultaneous events (Fig. 1). A local detector is deployed on each monitored network and performs change-point detection. Whenever a local detector detects a change-point, it informs the global detector by sending an alert. The global detector then judges whether large-scale simultaneous events are occurring based on the aggregated alerts.
B. Change-Point Detection at Local Detectors
For our scheme, we can use any change-point detection scheme; we use ChangeFinder [5] here as a change-point detection scheme because it detects unknown events as change-points immediately with on-line processing.
The detection process of ChangeFinder is as follows. Given time series data of a target metric, ChangeFinder first learns the probability density function of the data using stochastic models. Next, it calculates an outlier score for each input data point so that data points with lower probability obtain higher scores. It then calculates moving averages of outlier scores and generates new time series data. Then, it again learns the probability density function for the new time series data and outputs an outlier score for each data point of the new time series data. We call each data-point of the new time series a change-point candidate. Finally, for each change-point candidate, if its score is greater than or equal to a pre-determined threshold value, then ChangeFinder considers the change-point candidate to be a change-point and reports it to the global detector as an alert. On the other hand, when ChangeFinder is not used in a multi-stage change-point detection mechanism but used in a stand-alone way, it considers change-point candidates with a large score as an occurrence of target events.
Examples of worm detection using ChangeFinder are described in [6, 7]. In [6], ChangeFinder immediately detects the infection behavior of MSBLAST by monitoring the number of accesses per minute to port 135. In [7], ChangeFinder immediately detects LOVGATE, which was an unknown worm at that time, by monitoring the number of mails sent per minute.
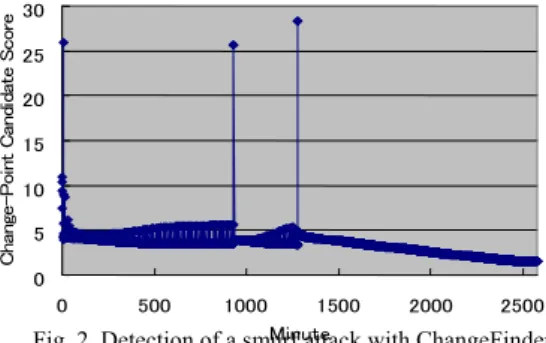
Fig. 2. Detection of a smurf attack with ChangeFinder.
Fig. 2 shows another example of the detection of a Smurf attack by ChangeFinder, which is a type of DDoS attacks. In the example, we used traffic data included in the 1999 DARPA intrusion detection evaluation test set [10]. We used the ICMP traffic volume per minute over a two-day interval of the data set; the time series data of the first day only includes normal traffic, while that of the second day includes Smurf attack events. The change-point candidate score of the y-axis is normalized between 0 and 30. In Fig. 2, we can see two change-point candidates with high scores after the learning period. The change-point candidate at minute 1277 catches the Smurf attack. On the other hand, another change-point candidate at minute 933 catches a change in the volume of normal traffic.
As shown in Fig. 2, we can easily distinguish the two change-point candidates described above from the other change-point candidates using an appropriate pre-determined threshold value, and we can easily determine that the two change-point candidates are change-points. However, the existence of change-points such as that at minute 933 highlights the difficulty in classifying the causes of change-points when we use time series data that can change due to multiple causes.
C. Detection of Large-Scale Simultaneous Events at the Global Detector
The global detector checks whether the proportion of local detectors that have sent alerts during the latest detection-period Δ is greater than or equal to a pre-determined threshold value. The proportion is expressed as follows:
∑
= L iL
i
t
A
1/
]
,
[
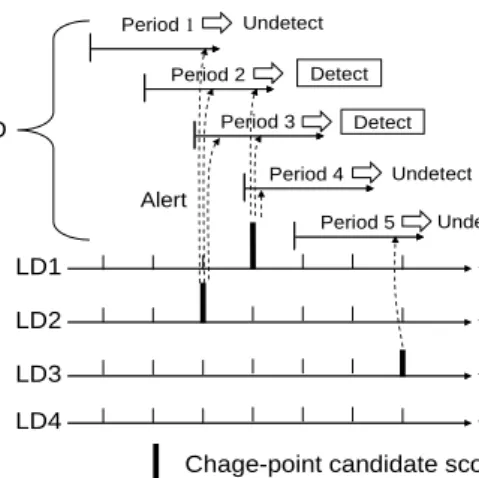
(1) where t is the time for the global detector to determine if large-scale simultaneous events are occurring, A[t,i] is set to 1 if local detector i sends an alert to the global detector between t-Δ and t, and A[t,i] is set to 0 otherwise, and L is the total number of local detectors. If the proportion is greater than or equal to the threshold value, the global detector judges that large-scale simultaneous events are occurring, and otherwise it judges that they are not occurring.Fig. 3 shows an example of the detection of large-scale simultaneous events. The threshold value of the global detector is set to 0.5, and the number of local detectors is four. Although one local detector sends an alert to the global detector during detection-periods 1, 4, and 5, the global detector neglects each alert. That is, the global detector judges that large-scale simultaneous events are Local Detector Local Detector Local Detector Local Detector Global Detector Result
Alert Alert Alert Alert
Network Network Network Network
Local Detector Local Detector Local Detector Local Detector Global Detector Result
Alert Alert Alert Alert
Network Network Network Network
0 5 10 15 20 25 30 0 500 1000 1500 2000 2500 Minute C h an ge -P o in t C an di da te S c o re
not occurring, because the proportion of local detectors sending alerts during each period is below 0.5. This situation is referred to as “Undetect.” On the other hand, the global detector judges that large-scale simultaneous events are occurring during detection-periods 2 and 3 because the proportion is greater than or equal to 0.5. This situation is referred to as “Detect.”
III. PERFORMANCEEVALUATION
We compare Detection Rate (DR) and False-Positive Rate (FPR) of our multi-stage change-point detection scheme with those of a detection scheme in which each LD independently determines occurrence of events in the corresponding subnet. We call the latter scheme the stand-alone LD scheme. As large-scale simultaneous events, we use DDoS attacks by hosts infected with random scan worms.
A. Behavior of a Host Infected with a Random Scan Worm We suppose that a host infected with a random scan worm performs TCP SYN flood attack, which is one of the most common DoS attack, to a certain target host. We consider that an infected host or an infection target host can become abnormal because of an infection failure (e.g., RPC failure in the infection behavior of MSBLAST [8]). We assume that such host is not able to infect other hosts and also does not perform DoS attacks.
B. Simulation of DDoS Attacks by Hosts Infected with Random Scan Worms
We simulate DDoS attacks by hosts infected with random scan worms as follows.
Step-1: Simulating the spread of random scan worms in the Internet using the modified Analytical Active Worm Propagation (modified AAWP) model [8] Step-2: Determining attack start time (i.e., infection time)
of each infected host that is monitored by LDs Step-3: Generating time series data of the number of
outgoing SYN packets monitored by each LD Step-4: Obtaining DRs and FPRs for our multi-stage
change-point detection scheme and the stand-alone LD scheme
In Step-1, we simulate the spread of random scan worms in the Internet. The modified AAWP (Analytical Active Worm Propagation) model [8], that is a modification of the AAWP model [11], provides a change in the number of hosts infected by the worm that employs random scanning. The model uses a discrete time and continuous state deterministic approximation model. The model gives the number of infected hosts at each time tick, regarding one time tick as the time for an infected worm to compete infection.
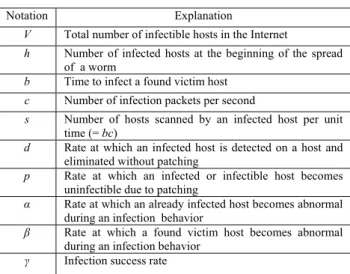
Given parameters for the infection behavior of a host infected by random scan worms in Table I, our modified AAWP model expresses the number (ni+1) of total infected hosts at the i+1st time tick as follows:
i i i
i d p n f g
n+1=(1− − ) −α +γ (i≥0) (2) where fi is the number of infected hosts that find any
Fig. 3. Detection of large-scale simultaneous events by aggregating information.
infectible host at the ith time tick, gi is the number of infectible hosts that are found by any infected host at the ith time tick and n0 = h, which is the number of infected hosts at the beginning of the spread of a worm. In approximating the number of infected/infectible hosts that become abnormal, we assume that an infected host finds at most one infectible host and an infectible host is found by at most one infected host. Thus, fi = gi.
The second term (αfi) in (2) corresponds to the number of infected hosts that become abnormal because of infection failures at the i+1st time tick. The third term (γgi) in (2) means the number of infectible hosts that are newly infected at the i+1st time tick.
gi is expressed as follows: ] ) 2 1 1 ( 1 [ ] ) 1 [( 1 32 0 1 0 i sn i j i j j j i i i p V n f g g = − − −
∑
− −∑
− − = − = β α (3)where i≥1. For i = 0, because any hosts are not patched and do not become abnormal, g0 is expressed as follows.
] ) 2 1 1 ( 1 )[ ( 0 32 0 0 sn n V g = − − − (4)
As shown in (3), gi is calculated as the product of the number of infectible hosts and the probability that an infectible host is found by any infected hosts. The number of infectible hosts at the ith time tick is calculated as the total number of non-patched hosts minus the sum of the number (ni) of infected hosts and the number
(
∑
−∑
= − = + 1 0 1 0 i j i j j j g f β α ) of abnormal hosts.Fig. 4 shows an example of the change in the number of hosts infected by random scan worms, which are obtained with our modified AAWP model. Because a random scan worm spreads in the Internet in a logistic way, the number of infected hosts (i.e., attack hosts) follows a logistic curve. That is, the increase is exponential in the initial phase and slows down in the later phase because the number of infection targets decreases.
Using this graph, we can derive the infection time (i.e., attack start time) of each infectible host monitored by LDs in Step-2. First, we obtain infection time of the jth infected host, tj (1≤ j≤V), which is an inverse function of the number of infected hosts in Fig. 4. We next obtain the infection time of each infectible host monitored by LDs. We set the time that is uniformly selected among tj s
LD1 time LD2 time LD3 time time LD4 Alert
Chage-point candidate score
GD Detect Period 1 Period 2 Period 3 Period 4 Period 5 Undetect Undetect Undetect Detect
TABLE I
PARAMETERS FOR MODIFIED AAWP MODEL
to the infection time of such host because any infected host uniformly selects the victim host.
After determining the attack start time of each infectible host monitored by LDs, we make time series data of the number of outgoing SYN packets per minute monitored by each LD in Step-3.
As normal traffic, that is, as the number of outgoing SYN packets per minute which are generated by all the non-infected hosts in the corresponding subnet, we use the numbers of outgoing SYN packets in a virtual subnet of 5 weekdays in a week included in the 1999 DARPA intrusion detection evaluation set [10]. The number of SYN packets per minute in the dataset ranges between 0 and about 300.
As attack traffic, we use the number of outgoing SYN packets generated by the attack behavior of an infected host. The number (a) is different worm by worm. In this paper, we determined the values by an experiment using a real worm, MSLBAST.
In Step-4, we obtain DRs and FPRs for our multi-stage change-point detection scheme and the stand-alone LD scheme based on their detection results against the number of outgoing SYN packets described above. For more information about definitions of DR and FPR, the reader can refer to [8].
C. Evaluation Result
In our scheme, the number of LDs should be as large as possible. However, due to the limit of deployment cost, we set the number of LDs to 100. We assume that each LD monitors a subnet with 256 hosts (Class C network). We set the total number of infectible hosts (V) to 8,663,863, assuming that 2% [12] of all the hosts in the Internet (433,193,199 [13]) are infectible.
The detection performance of our scheme depends on the following parameters: the scale of a DDoS attack (i.e., the number of subnets that have attack hosts), the simultaneity of a DDoS attack (i.e., the number of attack hosts that perform an attack behavior at the same time), and the length of detection-period (Δ) for a global detector. The scale of DDoS attacks depends on the number (e) of subnets that have infectible hosts. The simultaneity of DDoS attacks depends on the worm spread speed (c in Table I).
Fig. 4. Change in the number of hosts infected by random scan worms
First, we investigate the effect of the scale (e) and the simultaneity (c) of DDoS attacks on DR and FPR. We evaluate our scheme in the following cases; 1) small scale and low simultaneity, 2) large scale and low simultaneity, and 3) small scale and high simultaneity. We set e to 50 for large scale DDoS attacks, while we set e to 10 for small scale DDoS attacks.We set c to 11 (i.e., the same spread speed as MSBLAST) for DDoS attacks with high simultaneity, while we set c to 2.75 (i.e., one-fourth spread speed of MSBLAST) for DDoS attacks with low simultaneity.
We determine parameter values for modified AAWP model based on MSBLAST’s infection behavior [8]: b = 15 [s], d = 0, p = 0, α= 0.18, β= 0.18, γ= 0.68. We set a to about 1700, which is the same as the number generated by a host infected by MSBLAST.
We set simulation time to 1320 min, which is as long as the one-day data in the 1999 DARPA intrusion detection evaluation set. We divide the time into two periods: the normal period 1120 min in duration and the attack period, where a random scan worm spreads and the infected hosts perform an attack behavior, 200 min in duration. The duration of the attack period is sufficient for all of the monitored subnets to be infected by random scan worms. We set the initial number of infected hosts (h) to 1.
In this evaluation, we set the length of the detection-period (Δ) for GD to 5 min, to catch realistic DDoS attacks, because the durations of DDoS attacks monitored on the Internet from 2001 to 2003 mostly ranged around 5 min [9]. We set the detection cycle of the global detector to 1 min. The detection cycles of local detectors (δ) are assumed to be identical and are set to 1 min, because local detectors should perform change-point detection several times during a detection-period for GD, and because we succeeded in detecting a Smurf attack with the detection cycle in Section II.B. Threshold values of local detectors are assumed to be identical.
We first evaluate our multi-stage change-point detection scheme when the scale of DDoS attacks is small (e = 10) and the simultaneity of DDoS attacks is low (c = 2.75). Figs. 5 and 6 show ROC curves (Receiver Operating Characteristic curves), which is used as the performance metric of IDS in Ref. [10]. The x-axis of ROC curve is the average value of the false-positive rate and the y-axis of that is the average value of the detection rate. The closer the graph gets to the upper left corner (0,1), the better a detection scheme discriminates between normal behavior and large-scale simultaneous events. In the figures, label “stand-alone LD” shows detection using the stand-alone LD scheme and label “GD+LD” shows detection using our multi-stage change-point detection scheme. Label “th” refers to the threshold value of the global detector. In each curve, each plotted point represents the average value of the detection rate and the false-positive rate when the local detector’s threshold value is set to each value between 2 and 30. As the local
Notation Explanation V Total number of infectible hosts in the Internet
h Number of infected hosts at the beginning of the spread of a worm
b Time to infect a found victim host c Number of infection packets per second
s Number of hosts scanned by an infected host per unit time (= bc)
d Rate at which an infected host is detected on a host and eliminated without patching
p Rate at which an infected or infectible host becomes uninfectible due to patching
α Rate at which an already infected host becomes abnormal during an infection behavior
β Rate at which a found victim host becomes abnormal during an infection behavior
γ Infection success rate
0 2000000 4000000 6000000 8000000 0 600 1200 1800 2400 3000 Time [s] N um b er of infec te d ho st s j tj
detector’s threshold value increases, the plotted point moves from the upper right region to the lower left region.
Fig. 6 is an enlargement of the upper left corner of Fig. 5. 95% confidence intervals for DRs and FPRs of both schemes are very small in all cases. For example, Table II depicts 95% confidence intervals of DRs and FPRs for point A (stand-alone LD scheme) and point B (our scheme) in Fig. 6. Thus, we only show the average values of DRs and FPRs, hereafter.
In Fig. 6, our scheme with the global detector’s threshold values between 0.04 and 0.08 shows better detection performance compared to the stand-alone LD scheme.
We next evaluate the reduction in FPR with our scheme. Table III shows FPR values when DR of 1.0 is achieved with each scheme. In the stand-alone LD scheme, the local detectors’ threshold values are set to 4. In our scheme, the thresholds of local detectors and the global detector are set to 14 and 0.04, respectively. Our scheme yields a lower FPR (0.0047) compared with the stand-alone LD scheme because of the filtering effect against false-positive change-points at the global detector.
Fig. 7 shows ROC curves when the scale of DDoS attacks is large (e = 50) and the simultaneity of DDoS attacks is low (c = 2.75). With the increase in the scale of the attacks, our scheme plots closer to the upper left corner in Fig. 7 than in Fig. 6. Table IV shows FPR values when DR of 1.0 is achieved with each scheme. In the stand-alone LD scheme, the local detectors’ threshold values are set to 4. In our scheme, the thresholds of the local detectors and the global detector are set to 18 and 0.04, respectively. Our scheme does not yield any false-positives.
Further, we evaluate our scheme when the scale of DDoS attacks is small (e = 10) and the simultaneity of DDoS attacks is high (c = 11). Fig. 8 depicts the change in the numbers of hosts infected by random scan worms with high/low simultaneity. Most of infectible hosts are intensively infected within 10 minutes (between minute 20 and minute 30) in DDoS attacks with high simultaneity (c = 11) while most of them are infected within 40 minutes (between minute 70 and minute 110) in the attack with low simultaneity (c = 2.5). Fig. 9 shows ROC curves when the scale of DDoS attacks is small (e = 10) and the simultaneity of DDoS attacks is high (c = 11). With the increase in the simultaneity of the attacks, our scheme plots closer to the upper left corner in Fig. 9 than in Fig. 6. Table V shows FPR values when DR of 1.0 is achieved with each scheme. In stand-alone LD scheme, the local detectors’ threshold values are set to 2. In our scheme, the thresholds of the local detectors and the global detector are set to 10 and 0.08, respectively. Our scheme does not yield any false-positives.
Lastly, we investigate the effect of the length of the detection-period (Δ). Figs. 10 and 11 show ROC curves when Δis set to 1 and 10, respectively. The scale of DDoS attacks is large (e = 50) and the simultaneity of DDoS attacks is high (c = 11). When the threshold value of GD is 0.02, our scheme shows worse detection performance as the length of detection-period becomes larger. This is because our scheme with large detection-period tends to regard a set of sporadic false-positive change-points as DDoS attacks that occur simultaneously. However, when the threshold value of GD is large enough, our scheme can achieve better performance than the stand-alone scheme because filtering effect of GD works well.
Fig. 5. ROC curve (e = 10, c = 2.75).
Fig. 6. Enlargement of Fig. 6. TABLE II
95% confidence interval of DRs and FPRs for points A and B in Fig. 6. DR 0.995±2.1×10⁻³ A FPR 0.00848±3.1×10⁻⁶ DR 0.950±2.1×10⁻² B FPR 4 10 4 . 1 0559 . 0 ± × − TABLE III FPR when DR of 1.0 is achieved (e = 10, c = 2.75) IV. CONCLUSIONS
In this paper, we evaluated a multi-stage change-point detection scheme against DDoS attacks by random scan worms. We showed that the scheme achieves better performance than a stand-alone change-point detection scheme against DDoS attacks with various scales an simultaneities. We also showed that, even if the length of detection-period for GD is not appropriately set, our scheme can achieves better performance by the filtering effect of GD.
In our future work, we plan to propose a scheme that determines the optimal threshold values for LD and GD.
ACKNOWLEDGMENT
The authors gratefully acknowledge the contribution of Dr. Hideyuki Shimonishi of System Platforms Research Laboratories in NEC Corporation, Dr. Kenji Yamanishi and Mr. Takayuki Nakata of Common Platform Software Research Labs in NEC Corporation. The authors wish to thank Dr. Shinsuke Miwa of National Institution of Information and Communications Technology in Japan for providing a virus sample.
FPR Stand-alone LD scheme 0.017 Our scheme 0.0047 0.9 0.95 1 0 0.05 0.1 FPR DR stand-aloneLD GD+LD (th=0.02) GD+LD (th=0.04) GD+LD (th=0.06) GD+LD (th=0.08) GD+LD (th=0.10) A B 0 0.1 0.2 0.3 0.4 0.5 0.6 0.7 0.8 0.9 1 0 0.2 0.4 FPR0.6 0.8 1 DR stand-aloneLD GD+LD (th=0.02) GD+LD (th=0.04) GD+LD (th=0.06) GD+LD (th=0.08) GD+LD (th=0.10)
Fig. 7. ROC curve (e = 50, c = 2.75). TABLE IV
FPR WHEN DR OF 1.0 IS ACHIEVED (e = 50, c=2.75)
Fig. 8. Change in the number of hosts infected by random scan worms (c = 11: high simultaneity, c = 2.75: low simultaneity).
Fig. 9. ROC curve (e = 10, c = 11). TABLE V
FPR WHEN DR OF 1.0 IS ACHIEVED (e = 10, c=11)
REFERENCES
[1] M. Roesch, “Snort-Lightweight Intrusion Detection for Networks,” in Proc. of Usenix LISA ’99 Conf., November 1999.
[2] V. Yegneswaran, P. Barford and S. Jha, “Global Intrusion Detection in the DOMINO Overlay System,” in Proc. of Network and Distributed Security Symposium (NDSS), February 2004.
Fig. 10. ROC curve (Δ= 1).
Fig. 11. ROC curve (Δ= 10).
[3] V. Guralnik and J. Srivastava, “Event detection from time series data,” in Proc. of the fifth ACM SIGKDD Int’l Conf. on Knowledge Discovery and Data Mining (KDD99), pp. 33-42, August 2002.
[4] K. Yamanishi and J. Takeuchi, “A Unifying Framework for Detecting Outliers and Change-Points from Non-stationary Data,” in Proc. of the Eighth ACM SIGKDD Int’l Conf. on Knowledge Discovery and Data Mining (KDD2002), pp. 676-681, 2002.
[5] J. Takeuchi and K. Yamanishi, “A Unifying Framework for Detecting Outliers and Change Points from Time Series,” IEEE Tran. on Knowledge and Data Engineering, Vol. 18, No.4, pp.482
-492, April 2006.
[6] K. Yamanishi, J. Takeuchi and Y. Maruyama, “Three Methods for Statistical Anomaly Detection,” IPSJ Magazine, Vol. 46, No. 1, January 2005.
[7] K. Yamanishi, “Applications of Data Mining to Information Security,” Journal of Japanese Society for Artificial Intelligence, Vol. 21, No. 5, pp.570-576, September 2006.
[8] T. Murase, et al., “Performance Evaluation of a Multi-Stage Network Event Detection Scheme against DDoS Attacks,” to be presented at the 7th Asia-Pacific Symposium on Information and
Telecommunication Technologies (APSITT), April 2008.
[9] D. Moore, C. Shannon, D. Brown, G. M. Voelker and S. Savage, “Inferring Internet Denial-of-Service Activity,” ACM Transactions on Computer Systems, Vol. 24, No. 2, pp. 115-139, May 2006.
[10]“MIT Lincoln Laboratory – DARPA Intrusion Detection Evaluation,” http://www.ll.mit.edu/IST/ideval/index.html.
[11]Z. Chan, L. Gao and K. Kwiat, “Modeling the Spread of Active Worms,” in Proc. of the 22nd Annual Joint Conference of the IEEE
Computer and Communications Societies (INFOCOM), Vol. 3, 1890-1900, April 2003.
[12]M. Takahashi, J. Murakami, T. Sudou, N. Hirahara and R. Sasaki, “Behavioural Analysis of Botnet based on Field Research,” Trans. of Information Processing Society of Japan, Vol. 47, No. 8, pp. 2512-2523, August 2006.
[13]Inc. Internet Systems Consortium.
http://www.isc.org/index.pl?/ops FPR Stand-alone LD scheme 0.017 Our scheme 0 FPR Stand-alone LD scheme 0.042 Our scheme 0 0 1000000 2000000 3000000 4000000 5000000 6000000 0 10 20 30 40 50 60 70 80 90 100 110 120 c=11 c=2.75 Time [minute] N u mb er o f in fe cte d h o st s 0.9 0.95 1 0 0.05 0.1 FPR DR stand-aloneLD GD+LD (th=0.02) GD+LD (th=0.04) GD+LD (th=0.06) GD+LD (th=0.08) GD+LD (th=0.10) 0.9 0.95 1 0 0.05 0.1 FPR DR stand-aloneLD GD+LD (th=0.02) GD+LD (th=0.04) GD+LD (th=0.06) GD+LD (th=0.08) GD+LD (th=0.10) 0.9 0.95 1 0 0.05 0.1 FPR DR stand-aloneLD GD+LD (th=0.02) GD+LD (th=0.04) GD+LD (th=0.06) GD+LD (th=0.08) GD+LD (th=0.10) 0.9 0.95 1 0 0.05 0.1 FPR DR stand-aloneLD GD+LD (th=0.02) GD+LD (th=0.04) GD+LD (th=0.06) GD+LD (th=0.08) GD+LD (th=0.10)