Sains Malaysiana 39(3)(2010): 485–489
Setting Targets with Interval Data Envelopment Analysis Models
via Wang Method
(Menetapkan Sasaran dengan Model Analisis Pengumpulan Data Selang melalui Kaedah Wang)
NAJMEH MALEKMOHAMMADI*, AZMI B.JAAFAR & MANSOR MONSI
ABSTRACT
Data envelopment analysis (DEA) is a mathematical programming for evaluating the relative efficiency of decision making units (DMUs). The first DEA model (CCR model) assumed for exact data, later some authors introduced the applications of DEA which the data was imprecise. In imprecise data envelopment analysis (IDEA) the data can be ordinal, interval and fuzzy. Data envelopment analysis also can be used for the future programming of organizations and the response of the different policies, which is related to the target setting and resource allocation. The existing target model that conveys performance based targets in line with the policy making scenarios was defined for exact data. In this paper we improved the model for imprecise data such as fuzzy, ordinal and interval data. To deal with imprecise data we first established an interval DEA model. We used one of the methods to convert fuzzy and ordinal data into the interval data. A numerical experiment is used to illustrate the application to our interval model.
Keywords: Imprecise data; interval data envelopment analysis model; target setting
ABSTRAK
Analisis Pengumpulan Data (DEA) ialah pengaturcaraan bermatematik bagi menilai kecekapan relatif unit pembuat keputusan (DMU). Model DEA pertama (model CCR) mengandaikan data tepat, kemudian beberapa pengarang memperkenalkan penggunaan DEA dengan data tak tepat. Dalam Analisis Pengumpulan Data Taktepat (IDEA), data boleh dalam bentuk ordinal, selang dan kabur. Analisis tak pengumpulan data juga boleh digunakan bagi perancangan masa depan sesebuah organisasi dan sebagai maklum balas bagi pelbagai polisi, yang berkait rapat dengan penentuan sasaran dan pengagihan sumber. Model sasaran tersedia yang mengeluarkan prestasi berdasarkan sasaran selari dengan situasi membuat polisi yang ditakrifkan ke atas data tepat. Dalam kertas ini, penambahbaikan model dilaksanakan bagi data taktepat seperti data kabur, ordinal dan data selang. Bagi mengendalikan data taktepat ini, pertamanya dibina sebuah model Analisis Pengumpulan Data Selang. Kami menggunakan salah satu kaedah untuk menukarkan data kabur dan ordinal data kepada data selang. Satu eksperimen berangka dijalankan untuk menunjukkan penggunaannya terhadap model data selang yang dicadangkan kami.
Kata kunci: Data tak tepat; Model Analisis Pengumpulan Data Selang; penentuan sasaran
INTRODUCTION
Data envelopment analysis (DEA) is a mathematical programming for evaluating the relative efficiency of decision making units (DMUs). The first DEA model (CCR model), introduced by Charnes et al. (1978), assumed for exact data, then Cooper et al. (1999) introduced the applications of DEA in which the data was imprecise. In imprecise data envelopment analysis (IDEA) the data can be ordinal, interval and fuzzy. In dealing with this data the obtained models are usually non-linear. Cooper et al. (2001) proposed some methods to convert the non-linear model to a linear one. Zhu (2003, 2004) on the other hand shows that the non-linear IDEA can be solved in the standard linear CCR model via identifying a set of exact data from the imprecise input and output data. Despotis and Smirlis (2002) converted a non-linear DEA model to a
LP equivalent by transforming only on the variables. The resulting efficiency scores were intervals. According to their approach, Wang et al. (2005) developed a new pair of interval DEA models that can both overcome some of the shortcomings of the previous interval efficiency models in a simple, rational and effective way. Their new pair of interval DEA models were developed for interval input and output data rather than for crisp input and output data. The final efficiency score for each DMU will be characterized by an interval bounded by the best lower bound efficiency and the best upper bound efficiency of each DMU, which they refer to as interval efficiency or efficiency interval.
The DEA can also be used for the future programming of organizations and the response of the different policies which is related to target setting and resource allocation. The development of the scenario based target setting
process will be pursued by demonstrating some of the features of data envelopment analysis in a target setting mode. Previous research by Golany (1988), Thanassoulis and Dyson (1992) and Athanassopoulos (1995, 1996, 1998) have introduced models for assessing targets an allocating resources based on data envelopment analysis, the proposed model conveying performance based targets in line with the policy making scenarios, but their model defined for exact data.
In this paper, we improved Thanassoulis and Dyson (1992) and Athanassopoulos (1995, 1996), for imprecise data such as fuzzy, interval and ordinal data by using Wang et al. (2005) method. Our model is also based on interval efficiency which relates to both the lower and upper bound efficiencies. Although in existing interval DEA models we are able to compute the best lower bound efficiency and the best upper bound efficiency for DMUs, but if the manager or decision maker (DM) cannot improve the lower bounds of outputs to upper bounds and also the upper bounds of inputs to lower bounds, in this situation our approach will be more considerable.
DATA ENvELOPMENT ANALySIS AND TARGET SETTING The DEA model (CCR model), introduced by Charnes et al. (1978), is a fractional non-linear programming model. The objective function in the model is to maximize the single ratio of the weighted outputs over weighted inputs for a particular DMU, referred to as an observed DMU and denoted by DMUo.
Data Envelopment Analysis can also be used for the future programming of organizations and the response of the different policies which is related to target setting and resource allocation. The development of the scenario based target setting process will be pursued by indicating some of the features of data envelopment analysis in a target setting mode.
DATA ENvELOPMENT SCENARIO ANALySIS (DESA) Let us consider a set of j = 1, …, nDMUs and each unit uses input quantities X∈R+m to deliver output quantities
Y∈R+s. We can also consider the index sets of inputs, I = 1, …, m and outputs, O = I, …, s and their subsets I = If
∪Ῑf and O = Of∪Ōf where Ifand Ofare used to indicate
inputs and outputs where bounds of target achievements will be imposed in the construction of the following target model:
Model (1): Data envelopment scenario analysis model
s.t
(1)
where xij is the quantity of input i of unit j; yjk the quantity of output k of unit j; Pi–, Pk+ the user specified constants reflecting the decision makers’ preferences over the improvement of input/output components; θi, Zk the
contraction rate of input i and expansion of output k; Ki,
Kkthe bounds for estimated targets of input i and output
k; Ai, Bi the lower and upper bounds considered for θi, and
Γk, Δk the lower and upper bounds of Zk.
Some characteristics of the DESA model are, (i) the dichotomy between inputs and outputs in DESA can be relaxed, (ii) upper and lower bounds (Ki, Kk) are imposed on the assessed targets of individual inputs/outputs, (iii) decision makers (DMs) are actively involved in the target setting process (Athanassopoulos et al. 1999).
TARGET MODEL WITH IMPRECISE DATA
We improved model (1) such that it can be defined for imprecise data such as, fuzzy, ordinal and interval data.
All of the supposal are like model (1) but we imposed (λ1, λ2, ... λn) such that mentioned as a vector for
convex combination between inputs or outputs for nDMUs that is related to Variable Return to Scale (VRS). All the input and output data xijand ykj, (i = 1,…,m; k = 1,…,s; j =
1,…,n) cannot be exactly obtained due to the existence of uncertainty. They are only known to lie within the upper and lower bounds represented by the intervals and where xijL ≥ 0, ykjL ≥ 0. So in our constraints we have:
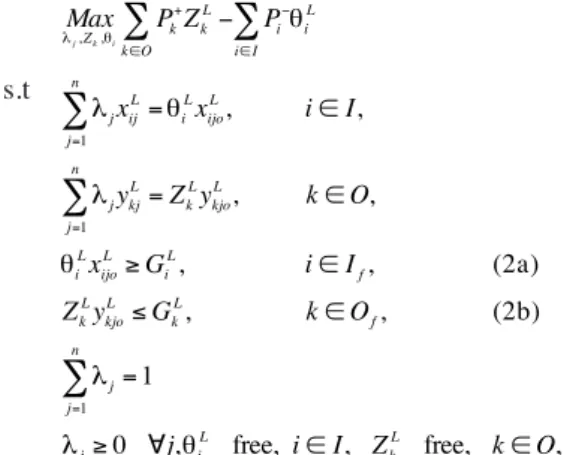
According to the above constraints we can establish model (2) and model (3) for transferring the interval data to the exact one. In model (2), θiL, Z
kL indicates the efficiency score when we choose the lower bound of the interval data, and also θiU, Z
kU in model (3) indicates the efficiency score for the upper bound of the interval data. As it is clear in models the lower bounds of data are compared with each other and also for upper bounds of data. This approach helps managers or decision maker (DM) to improve the lower bounds of outputs to lower bounds and also the upper bounds of inputs to upper bounds; in this situation they are able to have more realistic targets.
487 numbers. The product quality is a qualitative index and is given as strong ordinal preference information that is obtained from the evaluation of customers to their products. Since the GOv index for DMU2, DMU4 and DMU6 is given in the form of triangular fuzzy number, i.e. GOvj = (GOvjL, GOvjM, GOv
jU) (j = 2, 4, 6), their membership functions can be expressed as
where GOvjL,GOv
jM and GOvjU are the lower bound, most likely and upper bound values of GOvj, respectively. For a given a-level, the corresponding a-level sets are given
by,
(5) By the above formula we can transform fuzzy data into the interval data.
According to Wang et al. (2005) method for strong ordinal preference information yk1 > yk2 … > ykn we have the following ordinal relationships after scale transformation:
where χk is a preference intensity parameter satisfying χk > 1 provided by the DM and σk is the ratio parameter
also provided by the DM. The resultant permissible interval for each ŷrj can be derived as follows:
We suppose the preference intensity parameter and the ratio parameter about the strong ordinal preference information are given (or estimated) as χ =1.12 and σ =
0.1, respectively. As for exact data, they can be viewed as a special case of interval data with the lower and upper bounds being equal.
Table 2 reports the input-output data for the five DMUs after the transformation of ordinal preference information, according to the Wang et al. method (2005). Table 3 reports the results from models (2) and (3) and also formulas (4), respectively (solved by LINGO) used the exact and interval data from Table 2. We have chosen, Pk+ = Pi– = 1 for i = 1, …, m and k = 1, …, s. We also suppose for the first inputs (PC) the targets for each of them to be more than 1000. Therefore the DM decides to put G1U = G
1L = 1000.
Since it is not possible for each units to have purchase cost less than 1000. So, we can have realistic targets. To deal with fuzzy data, we let α=0.75 and used formula (5) to get the interval data.
(3) s.t
where GiL, GkL, indicates the bounds for estimated targets of input and output
s.t
where GiU, GkU indicates the bounds for estimated targets of input and output
By solving model (2) and (3), we will reach the target input and output using the formulas below:
(4)
We have to mention that our targets are introduced with exact data. In the case of interval target we can define
and as our interval targets. NUMERICAL ILLUSTRATION
Table1 presents the data set used by Wang et al. (2005). There are eight manufacturing enterprise (DMUs). Each manufacturing enterprise manufactures the same type of product, but the qualities are different. Therefore, both the gross output value (GOv) and the product quality (PQ) are considered as outputs. The inputs include purchase cost (PC) and the number of employees (NOE), whose data are known exactly. The data about the gross output values, however, are imprecise due to the unavailability at the moment and are thus estimated. Some of them are given as interval numbers and some as triangular fuzzy (2)
488
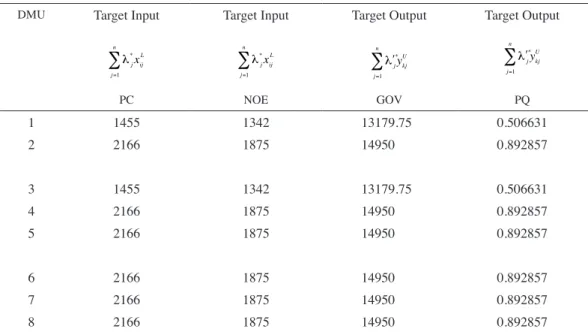
TABLE 3. The target input–output data for the eight DMUs
DMU Target Input Target Input Target Output Target Output
PC NOE GOv PQ 1 1455 1342 13179.75 0.506631 2 2166 1875 14950 0.892857 3 1455 1342 13179.75 0.506631 4 2166 1875 14950 0.892857 5 2166 1875 14950 0.892857 6 2166 1875 14950 0.892857 7 2166 1875 14950 0.892857 8 2166 1875 14950 0.892857
TABLE 1. Data for eight DMUs with two inputs and two outputs
DMU Input
PC InputNOE OutputGOv OutputPQa
a
1 2166 1875 [14548, 14950] 2 2 1455 1342 [12468, 13045, 13584] 7 3 2562 2359 [17896, 18452] 1 4 2346 2018 [14968, 15673, 15900] 3 5 1517 1548 [13980, 14638] 8 6 2034 1760 [14026, 14324, 14582] 6 7 2256 1982 [16542, 17169] 5 8 2465 2254 [17600, 18256] 4a Ordinal scale from 1 = best to 8 = worst with the preference intensity parameter χ = 1.12 and the ratio parameter σ = 0.1. (Wang et al. 2005)
a
TABLE 2. The input/output data for the eight DMUs after the transformation of ordinal preference information
DMU InputPC InputNOE OutputGOv OutputPQ
1 2166 1875 [14548, 14950] [0.1973823, 0.892857] 2 1455 1342 [12468, 13045, 13584] [0.1120000, 0.506631] 3 2562 2359 [17896, 18452] [0.2210681, 1.000000] 4 2346 2018 [14968, 15673, 15900] [0.1762342, 0.797194] 5 1517 1548 [13980, 14638] [0.1000000, 0.452349] 6 2034 1760 [14026, 14324, 14582] [0.1254400, 0.567427] 7 2256 1982 [16542, 17169] [0.1404928, 0.635518] 8 2465 2254 [17600, 18256] [0.1573519, 0.711780]
489 Since the minimum inputs and the maximum outputs
are important for decision makers (DMs) in Table 3 we just considered the lower bounds of the inputs and the upper bounds of the outputs as targets. In some cases the DMs may need interval targets, for example, ordinal data. Therefore we can consider lower and upper bounds of inputs and outputs in formulas (4) and define interval targets. One of our main difficulties for ordinal data is the conversion of their interval targets to ordinal one. In our future paper we will rectify this problem.
Through model (2) and (3) and formulas (4) we projected all the DMUs to DMU 1 and 2 which is efficient and considered as a reference point.
CONCLUSION
In this paper we have established a target model which is the improvement of the Thanassoulis and Dyson (1992) model for imprecise data such as, fuzzy, ordinal and interval data. Our model was an interval DEA model which was suitable for interval data. In our model we compare the lower bound of interval data with themselves and also the upper bounds of data with each other. This approach has more advantages than the previous interval DEA models since we are able to compute more realistic targets. To deal with ordinal and fuzzy data we used Wang et al. (2005) method that converts them into the interval data. We have chosen the lower target input and the upper target output as our ideal point. Eventually our targets were introduced as exact data. With our suggested formulas we also can define interval targets. As the existing DEA target models were not defined for imprecise data, our main approach was to define the target models for fuzzy, ordinal and interval data as the new subject in DEA target models.
ACKNOWLEDGMENT
The authors would like to appreciate the editor and anonymous referee for their useful comments that helped us in improving the quality of the paper.
REFERENCES
Athanassopoulos, A.D. 1995. Goal programming and Data Envelopment Analysis (GoDEA) models for multi-level multi-unit organizations: An application to Greek local authorities. European Journal of Operational Research 87(3): 535-550.
Athanassopoulos, A.D. 1996 Assessing the comparative spatial disadvantage of European using non-radial data envelopment analysis models. European Journal of Operational Research 94: 439-452.
Athanassopoulos, A.D. 1998. A network representation of decentralized target-based resource management of public services. Management Science 44(2): 173-187.
Athanassopoulos, A.D., Lambroukos, N. & Seiford, L.M. 1999. Data envelopment scenario analysis for setting targets to electricity generating plants. European Journal of Operational Research 115: 413-428.
Charnes, A., Cooper, W.W. & Rhodes, E. 1978. Measuring the efficiency of decision making units. European Journal of Operational Research 2(6): 429-444.
Cooper, W.W., Park, K.S. & yu, G. 1999. IDEA and ARIDEA: models for dealing with imprecise data in DEA. Management Science 45: 597-607.
Cooper, W.W., Park, K.S. & yu, G. 2001. An illustrative application of IDEA to a Korean mobile telecommunication company. Operations Research 49: 807-820.
Despotis, D.K. & Smirlis, y.G. 2002. Data envelopment analysis with imprecise data. European Journal of Operational Research 140: 24-36.
Golany, B. 1988. An interactive MOLP procedure for the extension of DEA to effectiveness analysis. Journal of the Operational Research Society 39: 725-734.
Lingo. 2004. www.lindo.com.
Thanassoulis, E. & Dyson, R. 1992. Estimating preferred targets input-output levels using data envelopment analysis. European Journal of Operational Research 56: 80-97. Wang, y.M., Greatbanksa, R. & yang, J.B. 2005. Interval
efficiency assessment using data envelopment analysis. Fuzzy Sets and Systems 153: 347-370.
Zhu, J. 2003. Imprecise data envelopment analysis (IDEA): A review and improvement with an application. European Journal of Operational Research 144: 513-529.
Zhu, J. 2004. Imprecise DEA via standard linear DEA models with a revisit to a Korean mobile telecommunication company, Operations Research 52: 323-329.
Najmeh Malekmohammadi* Institute for Mathematical Research Universiti Putra Malaysia
43400 Serdang, Selangor D.E. Malaysia
Azmi B Jaafar
Faculty of Computer Science and Information Technology Universiti Putra Malaysia
43400 Serdang, Selangor D.E. Malaysia
Mansor Monsi
Institute for Mathematical Research Universiti Putra Malaysia
43400 Serdang, Selangor D.E. Malaysia
*Corresponding author; email:n.malekmohammadi@gmail.
com
Received: 27 February 2009 Accepted: 2 October 2009