Colorado Reading Corps Evaluation
2012-2013
TABLE OF CONTENTS
DESCRIPTION OF COLORADO READING CORPS... 3
INTRODUCTION TO THE EVALUATION ... 6
EVALUATION RESULTS ... 7
What is the scope of the Reading Corps program in the state of Colorado?...7
What are the primary literacy outcomes of the Colorado Reading Corps?...10
How well is the Reading Corps program implemented in Colorado?...19
What do key stakeholders and implementers report regarding how participation in Reading Corps has affected their beliefs, opinions, and/or professional practices?...21
APPENDIX A—ADDITIONAL ASSESSMENT INFORMATION ...26
APPENDIX B—ADDITIONAL INTERVENTION INFORMATION ...33
Prepared by ServeMinnesota staff. Send questions to [email protected].
Colorado Reading Corps
COLORADO READING CORPS EVALUATION 2012-2013 3
DESCRIPTION OF COLORADO READING CORPS
Colorado Reading Corps (CRC) is an AmeriCorps program that provides schools with literacy tutors to support reading development for students in kindergarten through grade 3. Reading Corps tutors are trained to implement evidence-based literacy instruction and assessment protocols. Tutors are also supported by a multi-level coaching model that includes site-based (“Internal”) and external (“Master”) coaches.Effective Service-Delivery
The CRC model aligns with response-to-intervention (RTI), which is a framework for delivering educational services effectively and efficiently (Burns, Deno, & Jimerson, 20071). The key aspects of that alignment include the following:
• Clear literacy targets at each age level from K through grade 3
• Benchmark assessment three times a year to identify students eligible for one-on-one interventions
• Scientifically based interventions
• Frequent progress monitoring during intervention delivery
• High quality training in program procedures, coaching, and observations to support fidelity of implementation
In the RtI framework, data play the key roles of screening student eligibility for additional services and monitoring student progress towards achieving
academic goals (i.e., benchmarks). The CRC screens students for program eligibility three times a year (i.e., fall, winter, spring) using empirically-derived grade- and content-specific performance benchmarks. Eligible students
(defined as students below target scores) are determined potential candidates
1 Burns, K.M., Deno, S.L., & Jimerson, S.R. (2007). Toward a unified Response-to-Intervention
model. In S.R. Jimerson, M.K. Burns, & A. VanDerHeyden (Eds.), Handbook of Response to Intervention (pp. 428-440). New York: Springer.
Colorado Reading Corps
COLORADO READING CORPS EVALUATION 2012-2013 4
to receive Reading Corps support, which is often referred to as Tier 2 within an RTI framework.
The CRC program is focused on the “Big Five Ideas in Literacy” as identified by the National Reading Panel, including phonological awareness, phonics, fluency, vocabulary, and comprehension. Full-time tutors work with
approximately 15-18 K-3 students daily for 20 minutes each. The tutoring
interventions align with the Big Five literacy targets and are supplemental to the core reading instruction provided at each school. The goal of the tutoring is to raise individual students’ literacy levels so that they are on track to meet or exceed the next program-specified literacy benchmark.
Coaching and Support
As mentioned above the CRC provides multiple layers of supervision to ensure integrity of program implementation. Site-specific Internal Coaches, who are typically staff literacy specialists, teachers, or curriculum directors, serve as immediate on-site supervisors, mentors, and advocates for members. The Internal Coach’s role is to monitor members and provide guidance in the implementation of CRC’s literacy rich schedule (PreK only), assessments and interventions. As the front-line supervisor, the Internal Coach is a critical component of the supervisory structure. The external, or Master Coach, is a contracted literacy experts who provides site staff (i.e., Internal Coaches and AmeriCorps members) with expert consultation on literacy instruction and
ensures implementation integrity of CRC program elements. In addition to these two coaching layers, a third layer consisting of AmeriCorps program support helps ensure a successful year of AmeriCorps service. Program staff are CRC employees who provide administrative oversight for program implementation to sites participating in CRC.
Training
Prior to each school year beginning, CRC hosts a four day Summer Institute to train returning and new Master Coaches, Internal Coaches, and AmeriCorps members. This intensive, information-filled conference provides foundational training in the research-based literacy interventions employed by CRC. During several sessions at the Summer Institute, members learn the skills, knowledge, and tools needed to serve as literacy interventionists. Members are provided with detailed Literacy Handbooks as well as online resources that mirror and
Colorado Reading Corps
COLORADO READING CORPS EVALUATION 2012-2013 5
supplement the contents of the Handbooks (e.g., videos of model interventions and best practices). Both the Handbooks and website are intended to provide members with just-in-time support, and opportunities for continued professional development and skill refinement.
Colorado Reading Corps
COLORADO READING CORPS EVALUATION 2012-2013 6
INTRODUCTION TO THE EVALUATION
The Colorado Reading Corps evaluation addresses four broad questions with data collected during the 2012-2013 school year. The evaluation report is organized around each of these questions. Prior to presenting the results for each, a brief description of the data sources and collection methods is included. Following the results is an interpretation.
1. What is the scope of the Reading Corps program in the state of Colorado? 2. What are the primary literacy outcomes of the Colorado Reading Corps? 3. How well is the Reading Corps program implemented in Colorado?
4. What do key stakeholders and implementers report regarding how
participation in Reading Corps has affected their beliefs, opinions, and/or professional practices?
Colorado Reading Corps
COLORADO READING CORPS EVALUATION 2012-2013 7
EVALUATION RESULTS
1. What is the scope of the Reading Corps program in the state of
Colorado?
Table 1: Summary of Tutors, Internal Coaches, Master Coaches, and Schools Schools (Districts) Internal Coaches Master Coaches Number of Tutors*
12 (1) 12 1 19
*NOTE: Includes only tutors who entered student literacy data.
Data Source and Collection Methods: Data for evaluating the scope of the Reading Corps program in Colorado come from records kept and
maintained by the Reading Corps tutors. Each tutor recorded basic student information and data on their tutoring activities.
Table 1: Presents summary of the people and schools involved Table 2: Presents summary of student participation
Table 3: Presents average tutoring participation levels for students Table 4: Presents demographic information for students
Colorado Reading Corps
COLORADO READING CORPS EVALUATION 2012-2013 8
Table 2: Kindergarten through Grade 3 Student Participation
Total Students* Served by Colorado Reading Corps
Grade Level Total Number Served*
Kindergarten 77
1st Grade 128
2nd Grade 133
3rd Grade 134
TOTAL 472
*NOTE: Includes only students with at least one data point entered progress monitoring system.
Table 3: Participation Levels in Reading Corps Tutoring
Grade Mean Weeks per Student Mean Sessions per Student Mean Minutes per Week
K 11.74 39.86 63.53 1 20.30 75.70 70.51 2 23.17 88.19 74.17 3 21.46 78.65 70.37 TOTAL 20.05 74.25 70.38
Table 4: Kindergarten - Grade 3 Participant Demographic Data (Reported by Reading Corps Tutors)
Gender Ethnicity Language
52.54% Male 47.46% Female
1.48% American Indian or Alaskan Native 2.33% Asian or Pacific Islander
25.85% Hispanic
1.91% Black, Not of Hispanic Origin
72.46% English 2.12% Spanish 1.48% Other 23.94% No Report
Colorado Reading Corps
COLORADO READING CORPS EVALUATION 2012-2013 9
55.90% White, Not of Hispanic Origin 4.66% Multiple Reports
7.80%% No Report or unknown
Interpretation: Results in Tables 1 and 2 indicate tutors were able to provide services to nearly 500 students in 12 different elementary schools. Grades 1-3 had similar numbers of students served while kindergarten had relatively fewer students served. Internal Coaches make decisions about which grades will be provided Reading Corps services, and lower numbers in kindergarten may reflect school staff interest in providing students exposure to quality core instruction in order to identify students needing Reading Corps, but may also reflect other factors (e.g., greater availability of other school-based resources at the kindergarten level).
Table 3 shows relatively consistent tutoring participation across grades 1-3, and lower levels in kindergarten. Differences between kindergarten and older grades may be due to similar factors as discussed above. Results show that the Reading Corps program was able to provide an average of nearly 20 weeks of support for students in grades 1-3 (over 11 weeks for kindergarten students), with over 70 minutes of tutoring provided each week (over 63 minutes for kindergarten students).
Table 4 shows slightly more boys than girls received Reading Corps, and that the two primary ethnicities served were white (>55%) and Hispanic (>25%).
2. What are the primary literacy outcomes of the Colorado Reading
Corps?
Data Source and Collection Methods: Data for literacy outcomes come from two sources that are maintained by the Reading Corps tutors. Each tutor recorded the status of students who were served by Reading Corps, noting if (and when) students met criteria for exiting the program. In addition, tutors also recorded student literacy data from triannual benchmark screenings, which were used to determine if students were at or above year-end (i.e., Spring) benchmark targets. Tutors also collected weekly literacy data that were stored and graphed using an internet-based progress monitoring
system. The assessments used at each grade are listed in Appendix A (and in the parentheses of the Table 7 column headers).
Table 5: Presents conservative exit statistics for students (see NOTE for details about “exiting” students)
Table 6:Presents percentage of students who exited and reached spring literacy targets
Table 7:Presents average growth statistics using weekly literacy data from progress monitoring measures at each grade
Figures 1-5: Show linear growth curve estimates for weekly data from progress monitoring measures at each grade
Colorado Reading Corps
COLORADO READING CORPS EVALUATION 2012-2013 11
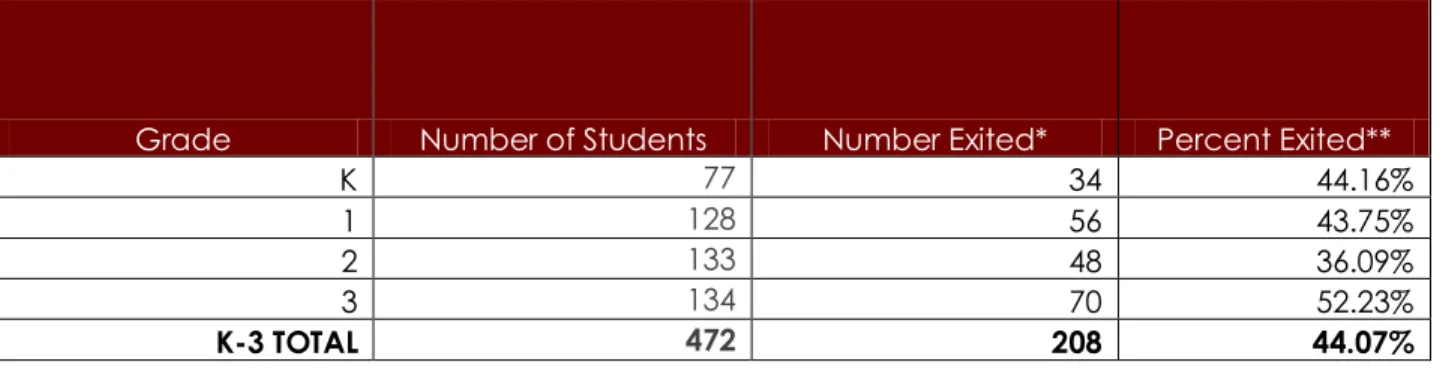
Table 5: Percentage of Students Who Exited Reading Corps*
Grade Number of Students Number Exited* Percent Exited**
K 77 34 44.16%
1 128 56 43.75%
2 133 48 36.09%
3 134 70 52.23%
K-3 TOTAL 472 208 44.07%
* “Exited” indicates student progress was at or above grade-level trajectories, which is the criterion for exiting Reading Corps. Practically, Reading Corps determines at or above grade-level trajectory as having 3-5 consecutive weekly points above a target growth line (as depicted on the internet-based progress monitoring system) plus 2 points above an upcoming seasonal benchmark target score.
**NOTE: Tutors are required to maintain a full caseload at all times, including at the end of the school year. Students in Reading Corps exit, and therefore enter, on a rolling basis, and each tutor has a full caseload (>15 students) at the end of the school year. Thus, it is reasonable to assume that many of the students at the end of the year have not had sufficient tutoring to meet the exit criteria described above. Given that “Percent Exited” is computed based on all students who were provided services, including students on a tutor’s caseload at the end of the school year, it is considered a conservative estimate.
Table 6: Percentage Who Exit Who Also Meet or Exceed Spring Benchmark
Grade Number Exited
Number Exited with Spring Benchmark* Number Above Spring Benchmark Percent Above Spring Benchmark K 34 32 28 87.50% 1 56 53 49 92.45% 2 48 38 34 89.47% 3 70 66 44 66.67% K-3 Total 208 189 155 82.01%
*NOTE: Accounts for students who may have not have a score for the spring benchmark assessments for various reasons (e.g., moved, extended absence).
Colorado Reading Corps
COLORADO READING CORPS EVALUATION 2012-2013 12
Table 7: Kindergarten - Grade 3 Participant Growth*
Grade K (Letter Sound Fluency) Grade 1 (Nonsense Word
Fluency) (R-CBM)** Grade 1 Grade 2 (R-CBM) Grade 3 (R-CBM)
Mean Growth Rate 1.58 1.63 1.55 1.49 1.38
Target Growth Rate 1.15 1.11 1.67 1.31 1.08
Number of Students 76 117 83 88 104
Percentage of Students Above Target Growth
Rate 65.8% 70.1% 43.4% 66.2% 75.4%
* Only students with 3 or more data points on the given measure were included in growth rate calculations ** Students in this group may have also participated in Grade 1 NWF
Figure 1: Grade K: Letter Sound Fluency Growth Curve Estimate -20 -10 0 10 20 30 40 50 L e tte r So u n d s C o rr e c t p e r Mi n u te
Grade K: Letter Sound Fluency Growth Curve Estimate
TOTAL
Colorado Reading Corps
COLORADO READING CORPS EVALUATION 2012-2013 14
Figure 2: Grade 1 Nonsense Word Fluency Growth Curve Estimate
0 10 20 30 40 50 60 70 80 C o rr e c t So u n d s p e r Mi n u te
Grade 1: Nonsense Word Fluency Growth Curve Estimate
TOTAL
Colorado Reading Corps
COLORADO READING CORPS EVALUATION 2012-2013 15
Figure 3: Grade 1: Oral Reading Fluency Growth Curve Estimate
0 10 20 30 40 50 60 W o rd s C o rr e c t p e r Mi n u te
Grade 1: Oral Reading Fluency Growth Curve Estimate
TOTAL TARGET
Colorado Reading Corps
COLORADO READING CORPS EVALUATION 2012-2013 16
Figure 4: Grade 2: Oral Reading Fluency Growth Curve Estimate
0 10 20 30 40 50 60 70 80 90 100 W o rd s C o rr e c t p e r Mi n u te
Grade 2: Oral Reading Fluency Growth Curve Estimate
TOTAL
Colorado Reading Corps
COLORADO READING CORPS EVALUATION 2012-2013 17
Figure 5: Grade 3: Oral Reading Fluency Growth Curve Estimate
0 20 40 60 80 100 120 140 160 W o rd s C o rr e c t p e r Mi n u te
Grade 3: Oral Reading Fluency Growth Curve Estimate
TOTAL
Colorado Reading Corps
COLORADO READING CORPS EVALUATION 2012-2013 18
Interpretation: Results from Table 5 indicate that, overall, approximately 44% of the 472 students served met criteria for exiting Reading Corps, which
indicates these students had demonstrated sufficiently strong reading growth to warrant no longer receiving support. It is important to note that the overall percentage (44%) is based on total students served, which is a conservative estimate of student performance (see “Note” below table). The percentage of students who did not exit (approximately 56%) likely includes many students who would benefit from CRC services in the following year.
Table 6 shows that, overall, more than 80% of students who exited
subsequently met the spring benchmark target for their grade. Students in kindergarten through grade 2 had similar performance, with 87% to 92% of students meeting spring benchmarks, whereas the proportion of students in grade 3 (66%) who met spring benchmark targets was lower. Reading Corps works exclusively with students who are initially below grade-level
benchmarks, and these data suggest performance consistent with grade-level expectations for a relatively high proportion of students who meet exit criteria.
The growth data presented in Table 7 and Figures 1-5 demonstrate that for most grades average growth rates on the progress monitoring measures exceeded target growth rates. For example, Table 7 shows the average growth rate for kindergarten students was 1.58 correct letter sounds (CLS) per week, compared to a target growth rate of 1.15 CLS per week. This is further reflected in Figure 1, which illustrates mean growth (red line labeled “Total”) compared to the seasonal targets (short black lines labeled “Target”) for kindergarten students. It shows that in the fall, average student performance (approximately 1-3 CLS) was well below the target (10 CLS), but that by spring average student performance (approximately 43 CLS) exceeded the target (41 CLS). Table 7 further reflects average student performance by showing approximately 66% of kindergarten students had individual growth rates that exceeded the target growth rate. Although a similar trend is found in other grades, Figure 4 shows that the average performance across grade 2 did not exceed the spring target (although it did narrow the gap that existed at fall and winter benchmarks), and Figure 3 shows performance in grade 1 on the curriculum-based measure for reading (R-CBM) was not as strong.
Colorado Reading Corps
COLORADO READING CORPS EVALUATION 2012-2013 19
3. How well is the Reading Corps program implemented in
Colorado?
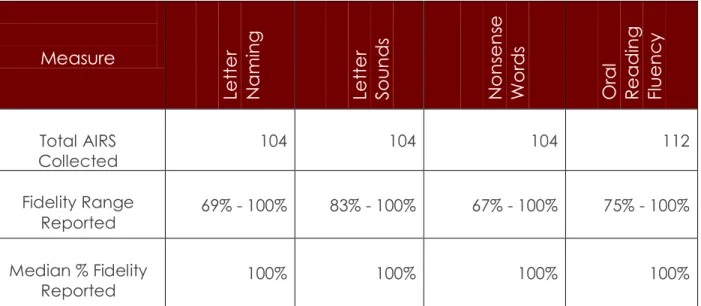
Table 8: Fidelity of Assessment Data Collection Procedures
Measure Le tte r Na min g Le tte r So un d s No n se n se Wo rd s O ra l Re a d in g Flu e n c y Total AIRS Collected 104 104 104 112 Fidelity Range Reported 69% - 100% 83% - 100% 67% - 100% 75% - 100% Median % Fidelity Reported 100% 100% 100% 100%
Data Source and Collection Methods: Implementation data are collected by Reading Corps Master and Internal Coaches. Coaches observe Members administer each assessment at least 3 times each year, prior to collecting benchmark data. Coaches also observe Members administer interventions at least monthly. During both types of observations, coaches complete fidelity checklists that produce data on implementation quality (see tables below). Assessment fidelity data are collected using the Accuracy of Implementation Rating Scales (AIRS), and intervention fidelity data are collected using
structured checklist protocols that correspond to key aspects of implementation for each intervention.
Table 8: Presents fidelity data for assessment observations. Table 9: Presents fidelity data for intervention observations.
Colorado Reading Corps
COLORADO READING CORPS EVALUATION 2012-2013 20
Mean % Fidelity
Reported 95.38% 97.00% 95.73% 97.33%
Standard Deviation 8.32% 4.92% 7.00% 4.59%
Table 9: Fidelity of Intervention Implementation Procedures
Intervention Total Complete Fidelity Checks Fidelity Range Reported Median Percent Fidelity Reported Mean Percent Fidelity Reported Standard Deviation Blending Words 77 57% - 100% 100% 93.61% 10.53% Duet Reading 144 56% - 100% 100% 94.23% 8.16% Great Leaps 133 50% - 100% 100% 94.68% 8.49%
Letter / Sound Correspondence 39 25% - 100% 100% 90.38% 17.74%
Newscaster Reading 6 91% - 100% 100% 98.48% 3.71%
Pencil Tap 7 60% - 88% 79% 79.27% 10.06%
Phoneme Blending 14 75% - 100% 100% 96.30% 7.81%
Phoneme Segmenting 13 43% - 100% 75% 74.88% 19.52%
Repeated Reading with Comprehension
89 33% - 100% 92% 87.85% 12.28%
Interpretation: Results from Table 8 show that assessment data were collected with very high levels of fidelity, which suggests that the student outcome data are accurate.
Results from Table 9 show that most interventions were conducted with high degrees of fidelity, which means they were implemented as intended. Given that each intervention has an extensive evidence-based (see Appendix B), this indicates the interventions were implemented in accordance with their established evidence-base. Two interventions had relatively low fidelity for implementation: pencil tap and phoneme segmenting. These were two of the three least-used interventions, but data suggest a need for more tailored coaching and training for these interventions.
Colorado Reading Corps
COLORADO READING CORPS EVALUATION 2012-2013 21
4.
What do key stakeholders and implementers report regarding
how participation in Reading Corps has affected their beliefs,
opinions, and/or professional practices?
Table 10: Internal Coach Survey Results
The following questions capture the overall opinions of Internal Coaches regarding the Reading Corps Program.
Answer Options Strongly Agree Agree Disagree Disagree Strongly Overall, the Reading Corps program has influenced
systems change at my site. 41.7% 50.0% 8.30% 0.00%
Reading Corps is a good fit with my school or center. 100.00% 0.00% 0.00% 0.00%
Reading Corps adds value to the instructional
program at this school or center 100.00% 0.00% 0.00% 0.00%
Data Source and Collection Methods: Data for stakeholder and implementer beliefs, opinions, and professional practices come from participant surveys. Reading Corps Internal Coaches and tutors completed surveys in the spring of the 2012-2013 school year.
A total of 12 Internal Coaches and 17 tutors completed surveys. Bolded
survey items indicate items reflecting the impact of Reading Corps. Select unbolded items can be compared with corresponding bolded items to further understand the Reading Corps impact on certain educational practices. Table 10: Presents survey results from Internal Coaches
Colorado Reading Corps
COLORADO READING CORPS EVALUATION 2012-2013 22
The following questions are designed to capture Internal Coach perceptions regarding changes to their local system resulting from participation in the Reading Corps program.
Answer Options Strongly Agree Agree Disagree Strongly Disagree
Prior to participating in the CRC program, our building collected fluency based screening measures for all students K-3 at least 3 times per year.
83.33% 16.67% 0.00% 0.00%
Due (at least in part) to our participation in the CRC program, our building has begun or will begin collecting fluency based screening measures for all students K-3 at least 3 times per year.
0.00% 41.67% 50.00% 8.33%
Prior to participating in the CRC program, teachers in our building used screening data to assist in identifying students for supplemental interventions.
16.67% 75.00% 8.33% 0.00%
Due (at least in part) to our participation in the CRC program, teachers in our building now use screening data to assist in identifying students for supplemental interventions.
16.67% 75.00% 8.33% 0.00%
Prior to participating in the CRC program, teachers regularly reviewed progress-monitoring data (weekly graphs) of students receiving supplemental
interventions.
8.33% 41.67% 33.33% 16.67%
Due (at least in part) to our participation in the CRC program, teachers now regularly review progress- monitoring data (weekly graphs) of students receiving supplemental interventions.
25.00% 66.67% 8.33% 0.00%
Prior to participating in the CRC program, teachers viewed progress monitoring (weekly data) as an important method to evaluate the impact of instruction on students.
16.67% 58.33% 16.67% 8.33%
Due (at least in part) to our participation in the CRC program, teachers now view progress monitoring (weekly data) as an important method to evaluate the impact of instruction on students.
16.67% 75.00% 8.33% 0.00%
Prior to participating in the CRC program, our school used aggregated data as one way to evaluate the instructional practices of the site.
33.33% 33.33% 33.33% 0.00%
Due (at least in part) to our participation in the CRC program, our school now uses aggregated data as one way to evaluate the instructional practices of the site.
8.33% 83.33% 8.33% 0.00%
Prior to participating in the CRC program, the building principal shared data on student performance with the superintendent or school board.
Colorado Reading Corps
COLORADO READING CORPS EVALUATION 2012-2013 23 Due (at least in part) to our participation in the CRC
program, the building principal now shares data on student performance with the superintendent or school board.
0.00% 36.36% 63.64% 0.00%
Prior to participating in the CRC program, teachers
shared progress monitor graphs with parents. 8.33% 66.67% 16.67% 8.33%
Due (at least in part) to our participation in the CRC program, teachers now share progress monitor graphs with parents.
16.67% 58.33% 25.00% 0.00%
Due (at least in part) to our participation in the CRC program, greater emphasis has been placed on selecting reading interventions for students that have a scientific research base.
16.67% 75.00% 8.33% 0.00%
Prior to participating in the CRC program, instruction was modified if student performance was not improving based on the progress monitoring data collected.
16.67% 58.33% 16.67% 8.33%
Due (at least in part) to our participation in the CRC program, instruction is now modified if student performance is not improving based on the progress monitoring data collected.
45.45% 45.45% 9.09% 0.00%
Prior to participating in the CRC program, the district had adopted its own data warehouse system for efficiently storing and accessing data.
50.00% 50.00% 0.00% 0.00%
Due (at least in part) to our participation in the CRC program, the district has now adopted its own data warehouse system for efficiently storing and accessing data.
0.00% 33.33% 50.00% 16.67%
Due (at least in part) to our participation in the CRC program, the district has taken concrete steps I am aware of to formally link Pre-K with K-3 literacy instruction.
Colorado Reading Corps
COLORADO READING CORPS EVALUATION 2012-2013 24
Table 11: CRC Tutor Impact Survey Results
The following items capture the overall opinions of Tutors regarding the Reading Corps Program.
Answer Options Strongly Agree Agree Disagree Disagree Strongly
Participation in Reading Corps had a
positive impact on me this school year. 70.59% 29.41% 0.00% 0.00%
Participation in Reading Corps had a positive impact on the site I served this school year.
76.47% 23.53% 0.00% 0.00%
Participation in Reading Corps had a positive impact on the students I served this year.
76.47% 23.53% 0.00% 0.00%
The following items asked Reading Corps Tutors to rate their agreement was based on their experience in 2012-2013.
Answer Options Strongly Agree Agree Disagree Disagree Strongly
As a result of my participation in the CRC program, I am considering a career involving children
35.29% 52.94% 11.76% 0.00%
As a result of my participation in the CRC program, I am considering a career in teaching or education
35.29% 47.06% 17.65% 0.00%
As a result of my participation in the CRC program, I am committed to continued volunteering in schools
29.41% 47.06% 23.53% 0.00%
As a result of my participation in the CRC program, I am committed to ongoing promotion of childhood literacy.
64.71% 35.29% 0.00% 0.00%
As a result of my participation in the CRC program, I am committed to continued community service.
29.41% 52.94% 17.65% 0.00%
As a result of my participation in the CRC program, if a job I hold in the future does not have community service as part of its mission, I will encourage the organization to include opportunities for community service.
Colorado Reading Corps
COLORADO READING CORPS EVALUATION 2012-2013 25
Interpretation: Results shown in Table 10 indicate Internal Coaches strongly agreed that Reading Corps had a positive overall impact on their school. Results for non-bolded items show that the schools in which Reading Corps operated had already begun systems change related to the procedures used by Reading Corps. For example, 100% of Internal Coaches agreed that their building used fluency-based screening measures, and approximately 85% agreed that teachers at their schools viewed progress monitoring data as an important tool for evaluating the impact of instruction on students.
However, bolded items indicate Reading Corps was considered at least part of the reason for positive system change toward integrating these procedures within the school. For example, nearly 93% of Internal Coaches reported that Reading Corps contributed to teachers viewing progress monitoring data to evaluate instruction.
Table 11 displays results for Reading Corps tutors. It shows that the experience of Reading Corps tutors was unequivocally positive and that tutors agreed Reading Corps had a positive impact at the schools in which they worked. Additional survey items note that tutors consider their experience as
contributing to ongoing commitments to promote childhood literacy and engage in continued community service. Further, over 80% of tutors indicated they are considering a career in education due to their participation in Reading Corps.
Colorado Reading Corps
COLORADO READING CORPS EVALUATION 2012-2013 26
APPENDIX A—ADDITIONAL ASSESSMENT INFORMATION
Assessment Measures and ProceduresThe assessment tools used to determine literacy progress of CRC-participating students include the following measures:
Letter Naming Fluency
Letter Sound Fluency
Nonsense Word Fluency
Oral Reading Fluency
The following table depicts which measures are used at each grade across the school year. BOLDED measures are used to progress monitor (1st grade students are monitored for progress with two measures during part of the winter).
Fall Winter Spring
Kindergarten Letter Naming Fluency
Letter Sound Fluency
Letter Naming Fluency
Letter Sound Fluency
Nonsense Word Fluency
Letter Naming Fluency
Letter Sound Fluency
Nonsense Word Fluency
Grade 1 Letter Naming Fluency Letter Sound Fluency Nonsense Word Fluency Nonsense Word Fluency Oral Reading Fluency (3 passages) Oral Reading Fluency (3 passages)
Grade 2 Oral Reading Fluency (3 passages) Oral Reading Fluency (3 passages) Oral Reading Fluency (3 passages) Grade 3 Oral Reading
Fluency (3 passages) Oral Reading Fluency (3 passages) Oral Reading Fluency (3 passages)
Colorado Reading Corps
COLORADO READING CORPS EVALUATION 2012-2013 27
Assessment Research Base
Assessment tools were selected for use in the Reading Corps because of their well-established statistical reliability and validity for screening and progress monitoring purposes. Letter Naming, Letter Sounds, and Nonsense Words are measures of early literacy skills thoroughly researched by many groups, but most famously packaged by two assessment programs: DIBELS and AIMSweb. Oral Reading Fluency provides an assessment of connected text reading. Early and ongoing research on this measure has also been conducted at the University of Minnesota. All these measures fit under the umbrella of “Curriculum-Based Measurement (CBM), and are fluency based assessments, meaning that
students respond to an unlimited number of items within a fixed amount of time, and the number of correct responses is counted. The information that follows summarizes empirical findings related to the statistical reliability and validity of the measures used in the Reading Corps.
Letter Naming Fluency:
r= .94 inter rater reliability
r= .90 2 week test retest reliability r= .88 1 month alternate reliability r=.93 alternate forms reliability r= .70 with WJ-R Readiness Cluster
r= .70 with WJ Psychoeducational Battery r= .53 to .58 with CTOPP Composite
Predictive r= .65 with WJ Total Reading Cluster Predictive r= .71 with R-CBM
ELL Predictive r = .67 with a composite of DIBELS NWF and R-CBM Sources:
Assessment Committee Report for Reading First. (2002). Analysis of Reading Assessment Measures. Retrieved February 21, 2007, from http://dibels/uoregon.edu/techreports/dibels_5th_ed.pdf
Good, R.H., Kaminski, R.A., Shinn, M. Bratten, J., Shinn, M., & Laimon, L. (in preparation). Technical Adequacy and Decision Making Utility of DIBELS (Technical Report). Eugene, OR: University of Oregon
Colorado Reading Corps
COLORADO READING CORPS EVALUATION 2012-2013 28
Good, R.H. III., Kaminski, R.A., Simmons, D., Kame’enui, E.J. (2001). Using Dynamic Indicators of Basic Early Literacy Skills (DIBELS) in an outcomes-driven model: Steps to reading outcomes. Unpublished manuscript, University of Oregon at Eugene.
Elliot, J., Lee, S.W., Tolefson, N. (2001). A Reliability and Validity Study of the Dynamic Indicators of Basic Early Literacy Skills – Modified. School Psychology Review, 30 (1), 33-49.
Haager, D. & Gersten, R (April, 2004). Predictive Validity of DIBELS for English Learners in Urban Schools. DIBELS Summit conference
presentation, Albuquerque, NM
Hintz, J.M., Ryan, A.L., & Stoner, G. (2003). Concurrent Validity and Diagnostic Accuracy of DIBELS and the CTOPP. School Psychology Review
Kaminski, R.A. & Good, R.H. (1996). Toward a Technology for Assessment Basic Early Literacy Skills. School Psychology Review, 25, 215-227.
Rouse, H., Fantauzzo, J.W. (2006). Validity of the Dynamic Indicators of Basic Early Literacy Skills as an Indicator of Early Literacy for Urban Kindergarten Children. School Psychology Review 35 (3)3 341-355. Letter Sound Fluency:
r= .83 2-week test-retest reliability r=.80 alternate form reliability r= .79 with Letter Naming Fluency Predictive r=.72 with R-CBM
Sources:
Elliott, J., Lee, S.W., & Tollefson, N. (2001). A Reliability and Validity Study of the Dynamic Indicators of Basic Early Literacy Skills – Modified. School Psychology Review, 30 (1), 33-49.
Fuchs, L., Fuchs D. (2004). Determining Adequate Yearly Progress from Kindergarten through Grade 6 with Curriculum Based Measurement. Assessment for Effective Intervention 29 (4) 25-37.
Colorado Reading Corps
COLORADO READING CORPS EVALUATION 2012-2013 29
Howe, K. B., Scierka, B. J., Gibbons, K. A., & Silberglitt, B. (2003). A School-Wide Organization System for Raising Reading Achievement Using General Outcome Measures and Evidence-Based Instruction: One
Education District’s Experience. Assessment for Effective Intervention, 28, 59-72.
Scott, S.A., Sheppard, J., Davidson, M.M., & Browning, M.M. (2001). Prediction of First Graders’ Growth in Oral Reading Fluency Using
Kindergarten Letter Naming Fluency. Journal of School Psychology, 39(3), 225-237.
Ritchey, K.D (2008). Assessing Letter Sound Knowledge: A Comparison of Letter Sound Fluency and Nonsense Word Fluency. Exceptional Children 74 (4) 487-506.
Nonsense Word Fluency:
r= .83 one month alternate form reliability r=.36 to .59 with WJ-R Readiness Cluster
Predictive r= .82 with Spring R-CBM in Spring of grade 1
Predictive r = .65 with oral reading and .54 with maze in grade 3 Ell Predictive r= .63 with a composite of DIBELS NWF and R-CBM Sources:
Burke, M. D., Hagan-Burke, S. (2007). Concurrent criterion-Related validity of early literacy indicators for middle of first grade. Assessment for
Effective Intervention. 32(2), 66-77.
Good, R.H., Kaminski, R.A., Shinn, M. Bratten, J., Shinn, M., & Laimon, L. (in preparation). Technical Adequacy and Decision Making Utility of DIBELS (Technical Report). Eugene, OR: University of Oregon
Good, R.H., Kaminski, R.A., Simmons, D., & Kame-enui, E.J. (2001). Using DIBELS in an Outcomes Driven Model: Steps to Reading Outcomes. Unpublished manuscript, University of Oregon, Eugene.
Haager, D. & Gersten, R (April, 2004). Predictive Validity of DIBELS for English Learners in Urban Schools. DIBELS Summit conference
Colorado Reading Corps
COLORADO READING CORPS EVALUATION 2012-2013 30
Howe, K. B., Scierka, B. J., Gibbons, K. A., & Silberglitt, B. (2003). A School-Wide Organization System for Raising Reading Achievement Using General Outcome Measures and Evidence-Based Instruction: One
Education District’s Experience. Assessment for Effective Intervention, 28, 59-72
Kaminski, R.A. & God, R.H. (1996). Toward a Technology for Assessment Basic Early Literacy Skills. School Psychology Review, 25, 215-227.
Ritchey, K.D (2008). Assessing Letter Sound Knowledge: A Comparison of Letter Sound Fluency and Nonsense Word Fluency. Exceptional Children 74 (4) 487-506.
Rouse, H., Fantauzzo, J.W. (2006). Validity of the Dynamic Indicators of Basic Early Literacy Skills as an Indicator of Early Literacy for Urban Kindergarten Children. School Psychology Review 35 (3)3 341-355. Vanderwood, M.., Linklater, D., Healy, K. (2008). Predictive Accuracy of
Nonsense Word Fluency for English Language Learners. School Psychology Review 37 (1) 5-17.
Oral Reading Fluency:
r= .92 to .97 test retest reliability r= .89 to .94 alternate form reliability
r= .82 to .86 with Gates-MacGinite Reading Test r= .83 to Iowa Test of Basic Skills
r = .88 to Stanford Achievement Test
r= .73 to .80 to Colorado Student Assessment Program r= .67 to Michigan Student Assessment Program
r=.73 to North Carolina Student Assessment Program r=74 to Arizona Student Assessment Program
r=.61 to .65 to Ohio Proficiency Test, Reading Portion
r= .58 to .82 with Oregon Student Assessment Program (SAT 10) Sources:
Barger, J. (2003). Comparing the DIBELS Oral Reading Fluency indicator and the North Carolina end of grade reading assessment (Technical Report). Ashville, NC: North Carolina Teacher Academy.
Colorado Reading Corps
COLORADO READING CORPS EVALUATION 2012-2013 31
Baker S. et. al,. (2008). Reading Fluency as a Predictor of Reading
Proficiency in Low-Performing, High-Poverty Schools. School Psychology Review 37 (1) 18-37.
Burke, M. D., Hagan-Burke, S. (2007). Concurrent criterion-Related validity of early literacy indicators for middle of first grade. Assessment for
Effective Intervention. 32(2), 66-77.
Deno, S. L., Mirkin, P. K., & Chiang, B. (1982). Identifying valid measures of reading. Exceptional Children, 49. 36-45.
Howe, K. B., Scierka, B. J., Gibbons, K. A., & Silberglitt, B. (2003). A School-Wide Organization System for Raising Reading Achievement Using General Outcome Measures and Evidence-Based Instruction: One
Education District’s Experience. Assessment for Effective Intervention, 28, 59-72
Hintze, J.M, et al (2002). Oral Reading Fluency and Prediction of Reading Comprehension in African American and Caucasian Elementary School Children. School Psychology Review, 31 (4) 540-553
Hintze, J. M. & Silberglitt, B. (in press). A Longitudinal Examination of the Diagnostic Accuracy and Predictive Validity of R-CBM and High-Stakes Testing. School Psychology Review.
Marston, D., Fuchs, L., & Deno, S. (1987). Measuring pupil progress: a comparison of standardized achievement tests and curriculum-related measures. Diagnostique, 11, 77-90.
Marston, D. (1989). Curriculum-based measurement: What is it and why do it? In M. R. Shinn (Ed.), Curriculum-based measurement: Assessing special children (pp. 18-78). New York: Guilford Press.
McGlinchey, M. T., & Hixson, M. D. (2004). Contemporary research on curriculum-based measurement: Using curriculum-based measurement to predict performance on state assessments in reading. School Psychology Review, 33(2), 193-204.
Colorado Reading Corps
COLORADO READING CORPS EVALUATION 2012-2013 32
Schilling, S. G., Carlisle, J. F., Scott, S. E., & Zeng, J. (2007). Are fluency measures accurate predictors of reading achievement? The Elementary School Journal, 107(5), 429-448.
Silberglitt, B. & Hintze, J. M. (in press). Formative Assessment Using Oral Reading Fluency Cut Scores to Track Progress Toward Success on State-Mandated Achievement Tests: A Comparison of Methods. Journal of Psychoeducational Assessment.
Shaw, R., & Shaw, D. (2002). DIBELS Oral Reading Fluency-Based Indicators of the third-grade reading skills for Colorado State Assessment Program (CSAP) (Technical Report). Eugene, OR: University of Oregon.
Shinn, M., Good, R., Knutson, N., Tilly, W., & Collins, A. (1992). Curriculum-based measurement of oral reading fluency: A confirmatory analysis of its relation to reading. School Psychology Review, 21, 459-479.
Stage, S. A., & Jacobsen, M. D. (2001). Predicting student success on a state-mandated performance-based assessment using oral reading fluency. School Psychology Review, 30(3), 407-420.
Tindal, G., Germann, G., & Deno, S. (1983). Descriptive research on the Pine County Norms: A compilation of findings (Research Report No. 132). Minneapolis, MN: University of Minnesota Institute for Research on Learning Disabilities.
Vander Meer, C. D., Lentz, F. E., & Stollar, S. (2005). The relationship between oral reading fluency and Ohio proficiency testing in reading (Technical Report). Eugene, OR: University of Oregon.
Wilson, J. (2005). The relationship of Dynamic Indicators of Basic Early Literacy Skills (DIBELS) Oral Reading Fluency to performance on Arizona Instrument to Measure Standards (AIMS). Tempe, AZ: Tempe School District No. 3.
Colorado Reading Corps
COLORADO READING CORPS EVALUATION 2012-2013 33
APPENDIX B—ADDITIONAL INTERVENTION
INFORMATION
Intervention Research Base
The interventions used in the Reading Corps program are designed to provide additional practice that is supplemental to the core reading instructional
program offered by the local school site. The interventions target automaticity and fluency of important reading skills that have been introduced by local classroom teachers. It is important to note that Reading Corps participation is in
addition to, not in replacement of, a comprehensive core reading instructional
program, and that the Reading Corps program should in no way be viewed as a substitute for high quality core instruction. Reading Corps (for more
information, see: Harn, B.A., Linan-Thomson, S., & Roberts G. (2008). Intensifying Instruction: Does Additional Instructional Time Make a Difference for the Most At-Risk First Graders? Journal of Learning Disabilities 41(2).)
A unique feature of Reading Corps is the consistent use of research-based intervention protocols with participating students to provide this additional support. School-based Internal Coaches select from a menu of research-based supplemental reading interventions for use with participating students as listed below. For each intervention protocol, a description of the research base, and/or sources of empirical evidence of intervention effectiveness are listed. Repeated Reading with Comprehension Strategy Practice
Nelson, J. S., Alber, S. R., & Grody, A. (2004). Effects of systematic error correction and repeated readings on reading accuracy and proficiency of second graders with disabilities. Education and Treatment of Children, 27, 186–198.
Staubitz, J. E., Cartledge, G., Yurick, A., & Lo, Y. (2004). Repeated reading for students with emotional or behavioral disorders: Peerand
Colorado Reading Corps
COLORADO READING CORPS EVALUATION 2012-2013 34
Therrien, W. J. (2004). Fluency and comprehension gains as a result of repeated reading: A meta-analysis. Remedial and Special Education, 25, 252–261.
Moyer, S.B. (1982). Repeated reading. Journal of Learning Disabilities, 45, 619-623
Rashotte, C.A., & Torgeson, J.K. (1985). Repeated reading and reading fluency in learning disabled children. Reading Research Quarterly. 20, 180-188
Samuels, S. J. (1979). The method of repeated reading. The Reading Teacher, 32, 403-408.
Samuels, S.J., (1987). Information processing abilities and reading. Journal of Learning Disabilities, 20(1), 18-22.
Sindelar, P.T., Monda, L.E., & O’Shea, L.J. (1990). Effects of repeated reading on instructional and mastery level readers. Journal of Educational Research, 83, 220-226.
Therrien, W.J. (2004). Fluency and comprehension gains as a result of repeated reading: A meta-analysis. Remedial and Special Education. 25(4) 252-261
Morrow, L. M. (1985). Retelling stories: A strategy for improving young children’s comprehension, concept of story structure, and oral language complexity. The Elementary School Journal, 85, 646–661.
Duet Reading
Aulls, M.W., (1982). Developing Readers in Today’s Elementary Schools. Allyn & Bacon: Boston.
Blevins, W. (2001). Building Fluency: Lessons and Strategies for Reading Success. New York: Scholastic Professional Books.
Dowhower, S.L. (1991). Speaking of prosody: Fluency’s unattended bedfellow. Theory into Practice, 30 (3), 165-175.
Colorado Reading Corps
COLORADO READING CORPS EVALUATION 2012-2013 35
Mathes, P.G., Simmons, D.C., & Davis, B.I. (1992). Assisted reading techniques for developing reading fluency. Reading Research and Instruction, 31, 70-77.
Weinstein, G., & Cooke, N. L. (1992). The effects of two repeated reading interventions on generalization of fluency. Learning Disability Quarterly, 15,
21–27.
Newscaster Reading
Armbruster, B.B., Lehr, F., & Osborn, J. (2001). Put reading first: The
research building blocks for teaching children to read. Washington, DC: US Department of Education, National Institute for Literacy.
Dowhower. S.L. (1987). Effects of repeated reading on second-grade transitional readers’ fluency and comprehension. Reading Research Quarterly. 22, 389-406. (listening to a tape)
Heckelman, R.G. (1969). A neurological-impress method of remedial reading instruction. Academic Therapy, 4, 277-282.
Daly, E. J., III, & Martens, B. (1994). A comparison of three interventions for increasing oral reading performance: Application of the instructional hierarchy. Journal of Applied Behavior Analysis, 29, 507–518.
Skinner, C. H., Adamson, K. L., Woodward, J. R., Jackson, R. R., Atchison, L. A., & Mims, J. W. (1993). The effects of models’ rates of reading on
students’ reading during listening previewing. Journal of Learning Disabilities, 26, 674–681.
Rasinski, T.V. (2003). The fluent reader: Reading strategies for building word recognition, fluency, and comprehension. New York, NY: Scholastic
Professional Books.
Searfoss, L. (1975). Radio Reading. The Reading Teacher, 29, 295-296. Stahl S. (2004). What do we Know About Fluency?: Findings of the
National Reading Panel. In McCardle, P., & Chhabra, V. (Eds) The Voice of Evidence in Reading Research. Brookes: AU.
Colorado Reading Corps
COLORADO READING CORPS EVALUATION 2012-2013 36
Stop Go
Blevins, W. (2001). Building Fluency: Lessons and Strategies for Reading Success. New York: Scholastic Professional Books.
Rasinski, T., & Padak, N. (1994). Effects of fluency development on urban second-graders. Jorunal of Education Research, 87.
Rasinski, T.V. (2003). The fluent reader: Reading strategies for building word recognition, fluency, and comprehension. New York, NY: Scholastic
Professional Books. Pencil Tap
Hattie, J., & Timperley, H. (2007). The power of feedback. Review of Education Research. 77(1), 81-112.
Howell, K., W., & Nolet. V., (2000). Curriculum-Based Evaluation: Teaching and Decision Making 3rd Ed. Belmont, CA: Wadsworth.
Lysakowski, R.S., & Walberg, H.J. (1982). Instructional effects of cues, participation, and corrective feedback: A quantitative synthesis. American Educational Research Journal Vol 19(4), 559-578
Tenenbaum, G., & Goldring, E. (1989). A meta-analysis fo the effecta of enhanced instruction: Cues, participation, reinforcement and feedback and correctives on motor skill learning. Journal of Research &
Development in Education. Vol 22(3) 53-64. Letter Sound Identification
Adams, M.J. (1990). Beginning to read: Thinking and learning about print. Cambridge, MA: MIT Press.
Adams, M.J. (2001).Alphabetic anxiety and explicit, systematic phonics instruction: A cognitive science perspective. In S.B. Neuman & D.K. Dickinson (eds.), Handbook of Early Literacy Research (pp. 66-80). New York: Guilford Press.
Colorado Reading Corps
COLORADO READING CORPS EVALUATION 2012-2013 37
Chard, D.J., & Osborn, J. (1999). Word Recognition: Paving the road to successful reading. Intervention in school and clinic, 34(5), 271-277. Word Blending
Adams, M.J. (2001).Alphabetic anxiety and explicit, systematic phonics instruction: A cognitive science perspective. In S.B. Neuman & D.K. Dickinson (eds.), Handbook of Early Literacy Research (pp. 66-80). New York: Guilford Press.
Goswami, U. (2000). Causal connections in beginning reading: The importance of rhyme. Journal or Research in Reading, 22(3) 217-240. Greaney, K.T., Tunmer, W.E., & Chapman, J.W., (1997). Journal of
Educational Psychology, 89(4) 645-651. Phoneme Blending
Adams, M.J. (1990). Beginning to read: Thinking and learning about print. Cambridge, MA: MIT Press.
Bos, C.D., & Vaughn, S. (2002). Strategies for teaching students with learning and behavioral problems (5th Ed.). Boston: Allyn & Bacon. Ehri, L.C., Nunees, S.R., & Willows, D.M. (2001). Phonemic awareness
instruction helps children learn to read: Evidence from the National Reading Panel’s meta-analysis. Reading Research Quarterly, 36(3). 250-287.
Elkonin, D.B. (1973). U.S.S.R. In J. Downing (Ed.), Comparative Reading (pp.551-579). New York: MacMillan.
National Reading Panel. (2000). Teaching children to read: An evidence-based assessment of the scientific research literature on reading and its implications for reading instruction. Bethesda, MA: National Institutes of Health.
Santi, K.L., Menchetti, B.M., & Edwards, B.J. (2004). A comparison of eight kindergarten phonemic awareness programs based on empirically
Colorado Reading Corps
COLORADO READING CORPS EVALUATION 2012-2013 38
validated instructional principals. Remedial and Special Education, Vol 25(3) 189-196.
Smith, C.R. (1998). From gibberish to phonemic awareness: Effective decoding instruction. Exceptional Children, Vol 30(6) 20-25
Smith, S.B., Simmons, D.C., & Kame’enui, E, J. (1998). Phonological Awareness: Research bases. In D.C. Simmons & E.J. Kame’enui (Eds.), What Reading research tells us about children with diverse learning needs: Bases and basics. Mahwah, NJ: Lawrence Erlbaum Associates.
Snider, V. E. (1995). A primer on phonemic awareness: What it is, why it is important, and how to teach it. School Psychology Review, 24, 443–455. Phoneme Segmentation
Adams, M.J. (1990). Beginning to read: Thinking and learning about print. Cambridge, MA: MIT Press.
Blachman, B. A. (1991). Early intervention for children’s reading problems: Clinical applications of the research on phonological awareness. Topics in
Language Disorders, 12, 51–65.
Bos, C.D., & Vaughn, S. (2002). Strategies for teaching students with learning and behavioral problems (5th Ed.). Boston: Allyn & Bacon. Ehri, L.C., Nunees, S.R., & Willows, D.M. (2001). Phonemic awareness
instruction helps children learn to read: Evidence from the National Reading Panel’s meta-analysis. Reading Research Quarterly, 36(3). 250-287.
National Reading Panel. (2000). Teaching children to read: Anevidence-based assessment of the scientific research literature on reading and its implications for reading instruction. Bethesda, MA: National Institutes of Health.
Santi, K.L., Menchetti, B.M., & Edwards, B.J. (2004). A comparison of eight kindergarten phonemic awareness programs based on empirically
validated instructional principals. Remedial and Special Education, Vol 25(3) 189-196.
Colorado Reading Corps
COLORADO READING CORPS EVALUATION 2012-2013 39
Smith, C.R. (1998). From gibberish to phonemic awareness: Effective decoding instruction. Exceptional Children Vol 30(6) 20-25.
Smith, S.B., Simmons, D.C., & Kame’enui, E, J. (1998). Phonological Awareness: Research bases. In D.C. Simmons & E.J. Kame’enui (Eds.), What Reading research tells us about children with diverse learning needs: Bases and basics. Mahwah, NJ: Lawrence Erlbaum Associates.
Snider, V. E. (1995). A primer on phonemic awareness: What it is, why it is important, and how to teach it. School Psychology Review, 24, 443–455.