MBA STUDENTS WANTS AND NEEDS: A KANO APPROACH
Ajay K. Aggarwal, Else School of Management, Millsaps College, Jackson, MS 39210-0001, (601) 974-1270, [email protected]
Raymond A. Phelps, Else School of Management, Millsaps College, Jackson, MS 39210-0001, (601) 974-1273, [email protected]
ABSTRACT
The paper presents a Japanese technique called the Kano method to conduct and analyze three surveys aimed at improving the MBA program at a small, private, AACSB-accredited school. Details of the Kano method, relevant analysis, and decision-making have been presented. The simplicity of the approach has been touted as its strength. The example presented examines survey results based upon 42 factors and recommends 9 factors for consideration at three different priority levels.
INTRODUCTION
As kids we learn the difference between wants and needs. Wants constitute a wish list of desired items, while needs normally denote the essentials. Parents can generally tell the two apart with little effort. For instance, a simple functional calculator may constitute a need for school, while the latest, sheikh-looking, calculating gizmo may be a want. The Kano method, in a simplistic generalization, offers this discerning parental wisdom to surveys. This research paper attempts to use the Kano method to distinguish between the wants and needs of MBA students based upon results of three surveys at a small, private, AACSB-accredited school.
Literature Review
Professor Nariaki of Tokyo Rika University is often credited with developing a method for sorting and prioritizing consumer perceptions about their requirements for a product or service [10]. The Kano method helped broaden the traditional quality mindset that regarded customer satisfaction as being proportional to product functionality [11]. Key concepts and ideas in this method were originally developed in a series of presentations by Kano and his colleagues [4] [12].
Historically, as a component in concept engineering, the Kano method has been used to help engineers understand the customer’s needs along with the factors that understand their satisfaction or dissatisfaction [1]. Over the years Chen and Su [13] have reported on the use of Kano method in academic [16], industrial [15][19][20], and governmental settings [14]. Kano method provides a methodology for addressing the issue of customer satisfaction and dissatisfaction [17], relationship between degrees of satisfaction and their causes [18], and attribute importance [21][22].
The MBA degree is quite popular across the globe. It is often touted as one of the best ways to prepare business students for the real world. Factors such as globalization, technology [5], curriculum of competitor schools, delivery methods, accreditation, diversity issues, faculty
development, and school mission [6], among others, have often led to changes in the program. Student feedback [9], assessment studies [8], and learning approaches [7] sometimes offer useful suggestions for improving the program. The task of deciding which factors to incorporate into an existing MBA program is quite daunting for decision makers.
Problem Description
The declining enrollment in the MBA program of a small, private, AACSB-accredited school greatly concerned the faculty and administrators. Faculty meetings, brainstorming sessions with students, suggestions from administrators appeared to offer conflicting reasons for the downward trend. The suggestions for reversing the trend varied even more, offering little direction for realigning the college resources. For instance, there were basic questions regarding the tuition charged, the value of being accredited in a marketplace that seemed reluctant to pay a premium for it, and having a study abroad program.
Methodology
A list of important program attributes for areas was identified and 42 survey questions were generated. Since the Kano method doubles the number of questions (see the Kano method section), it was decided to break the survey into three survey instruments having 24, 30, and 30 questions respectively. All surveys were conducted electronically, and the mailing list included all previous graduates of the program. The three surveys yielded 114, 98, and 79 responses respectively.
The Kano Method
The Kano method presents each survey question to the respondents in two forms - functional and dysfunctional. In the functional approach, the subjects rate the questions on a 5-point scale. For instance, a typical question may be as follows:
How important is it that your MBA program is well-known nationally? 1: I like it 2: I expect it 3: I’m neutral 4: I can tolerate it 5: I dislike it
In the dysfunction approach, the subjects rate the same question presented in a negated form. For instance, a dysfunctional form of the above question would be as follows:
How important is it that your MBA program is not well-known nationally? 1: I like it 2: I expect it 3: I’m neutral 4: I can tolerate it 5: I dislike it
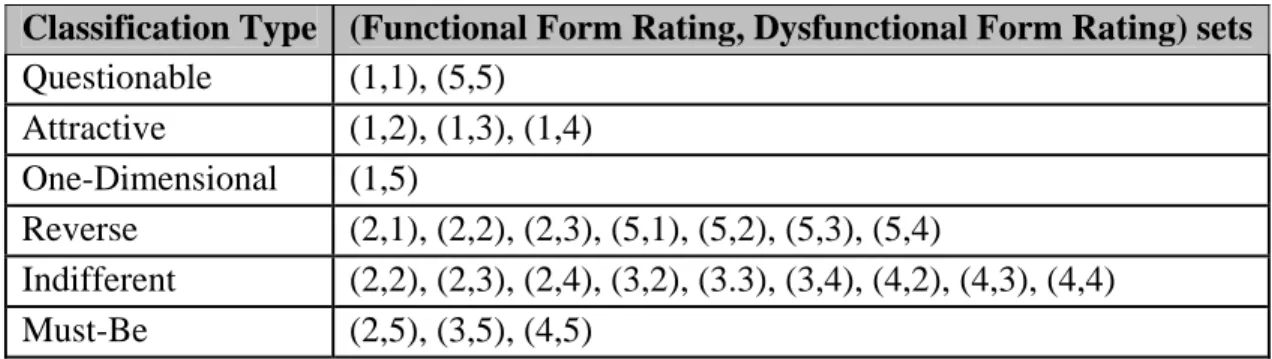
Responses on the two forms of the question, according to the Kano method, classify the response into one of six types – questionable, attractive, one-dimensional, reverse, indifferent, or must-be. For instance, if the dysfunctional performance rating for a factor is 2, 3, or 4, and the functional performance rating for the same factor is 1, it is classified as an “A” (Attractive). Table 1 shows the classifications for all combination of ratings.
Classification Type (Functional Form Rating, Dysfunctional Form Rating) sets Questionable (1,1), (5,5) Attractive (1,2), (1,3), (1,4) One-Dimensional (1,5) Reverse (2,1), (2,2), (2,3), (5,1), (5,2), (5,3), (5,4) Indifferent (2,2), (2,3), (2,4), (3,2), (3.3), (3,4), (4,2), (4,3), (4,4) Must-Be (2,5), (3,5), (4,5)
Table 1: Classification Types for the Kano Method
Different classification types are interpreted differently. For instance, the “one-dimensional” classification implies that the factor’s presence will increase customer satisfaction but its absence will hurt it. Other factors, similarly, have different interpretations and are shown in Table 2.
Classification Type
Impact of Factor Presence on Customer Satisfaction
Impact of Factor Absence on Customer Satisfaction
Questionable Increase or Decrease Increase or Decrease
Attractive Increase Decrease
One-Dimensional Increase Strong Decrease
Reverse Decrease Increase
Indifferent No Impact No Impact
Must-Be Strong Increase Strong Decrease
Table 2: Interpretation of Different Classification Types
Every question presented in two forms generates ratings that results in a certain Kano classification. When several individuals take a survey, the end result is a frequency distribution of different Kano classifications for every question. To help study the impact of each question, the Kano technique computes a measure of customer satisfaction and dissatisfaction based upon frequencies of the different classification types for each question.
Customer Satisfaction = [(#A + #D) / (#A +#D + #M + #R + #I)]*100
Customer Dissatisfaction = [(#D + #M + #R) / (#A + #D + #M + #R + #I)]*(-100)
In addition, to facilitate decision making, the priorities associated with each question may be solicited independently in the survey instrument. By focusing on factors that increase customer satisfaction, decrease customer dissatisfaction, and enjoy a high priority rating, effective decision making is supported.
DATA ANALYSIS
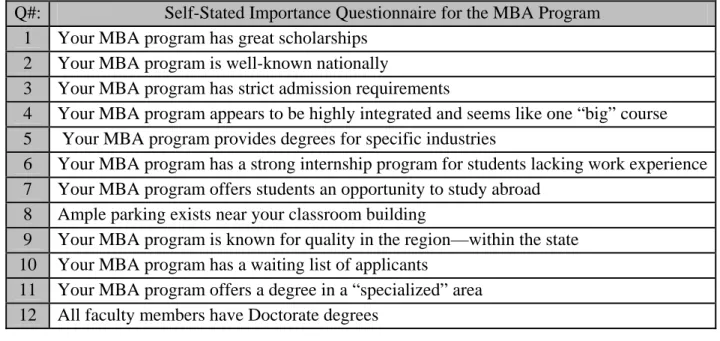
The first questionnaire was designed to get feedback on 12 factors. These are all represented in Table 3.
Q#: Self-Stated Importance Questionnaire for the MBA Program 1 Your MBA program has great scholarships
2 Your MBA program is well-known nationally
3 Your MBA program has strict admission requirements
4 Your MBA program appears to be highly integrated and seems like one “big” course 5 Your MBA program provides degrees for specific industries
6 Your MBA program has a strong internship program for students lacking work experience 7 Your MBA program offers students an opportunity to study abroad
8 Ample parking exists near your classroom building
9 Your MBA program is known for quality in the region—within the state 10 Your MBA program has a waiting list of applicants
11 Your MBA program offers a degree in a “specialized” area 12 All faculty members have Doctorate degrees
Table 3: First Survey Instrument
Computation of Decision Mode and Customer Satisfaction and Dissatisfaction
#Q #A #1-D #R #I #M Decision Mode Customer Satisfaction Customer Dissatisfaction #1 1 34 21 0 44 14 I 49 -31 #2 0 0 0 99 15 0 R * * #3 1 63 21 0 20 9 A 74 -27 #4 0 1 0 51 62 0 I 1 -45 #5 0 15 18 1 43 37 I 29 -49 #6 3 1 0 60 47 3 R * * #7 2 12 2 10 83 5 I 13 -15 #8 5 7 0 29 71 2 I 6 -28 #9 1 23 4 2 82 2 I 24 -7 #10 0 0 0 64 50 0 R * * #11 0 37 22 0 42 13 I 52 -31 #12 0 0 0 64 49 1 R * *
The survey was mailed to 326 students electronically. 114 valid responses were received. These were recorded in EXCEL. All responses were converted into one of six types Q (Question mark), A ( Attractive), D (One dimensional), R (Reverse), I (Indifferent), and M (Must Have) using the Kano definitions. Using the COUNTIF and the MAX functions of EXCEL, and the mathematical definitions of Customer Satisfaction and Customer Dissatisfaction, the frequency table and modal class were identified for each question. Table 4 shows the results achieved.
Most of the responses fell in the “Indifference” or “I” category under the Decision Mode. This is indicative of ambivalence about those factors in the population surveyed. Four responses fell in the “R” (Reversible) category, and one response made it to the “A” (Attractive) category. The attractive category implies that increasing the factor will increase customer satisfaction and vice versa. The reversible category implies that there is a diversity of opinion about the factor with some responders arguing for an increase in its influence and others for its decrease. As an end result, the factor is termed neutral and deemed to have little impact of customer satisfaction.
It should be noted that the customer satisfaction numbers in Table 4 are all positive, while the customer dissatisfaction numbers are negative. This is the direct result of the formula that computes these measures. The negative sign is contained in the multiplier for customer dissatisfaction. This is actually helpful at the decision making stage, since it enables to tell the two numbers apart.
Q#: Self-Stated Importance Questionnaire for the MBA Program 1 Your MBA program is intellectually challenging
2 Your MBA has a strong writing program with a commitment to producing clear and concise written communications
3 Your MBA program uses wireless technology
4 Your MBA program emphasizes “Real World” applications 5 MBA program has “High Tech” classrooms
6 Teamwork skills are stressed in your MBA program 7 Your MBA has a strong quantitative orientation
8 Your MBA program offers on-line “electronic” courses 9 Your MBA program has faculty that interacts with students 10 Your MBA program is part of a Liberal Arts college 11 Your MBA program is AACSB accredited
12 Business leaders and employers regularly speak to classes 13 Employers recommend your MBA program
14 Your MBA program has part-time and week-end courses 15 Your MBA program uses Distance Learning
The survey generated 98 valid responses. This number is lower than the 114 responses obtained for the first survey since everyone didn’t participate. It should also be indicated that not everybody who participated in the second survey took part in the first survey. In the Kano method, this is not perceived as a limitation. An analysis similar to the one conducted with the first survey was performed on the data. Table 6 shows the results of the analysis.
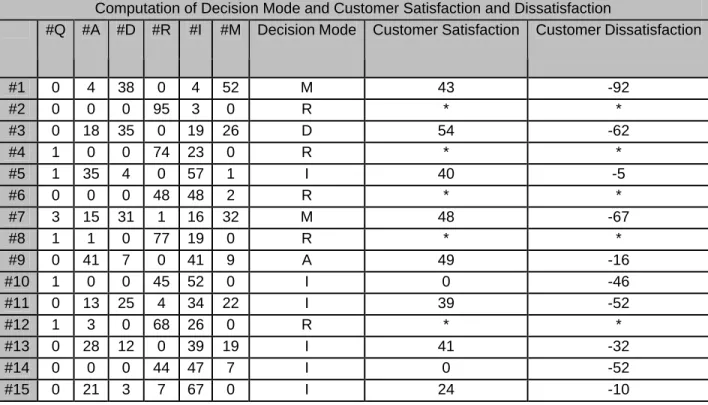
Computation of Decision Mode and Customer Satisfaction and Dissatisfaction
#Q #A #D #R #I #M Decision Mode Customer Satisfaction Customer Dissatisfaction
#1 0 4 38 0 4 52 M 43 -92 #2 0 0 0 95 3 0 R * * #3 0 18 35 0 19 26 D 54 -62 #4 1 0 0 74 23 0 R * * #5 1 35 4 0 57 1 I 40 -5 #6 0 0 0 48 48 2 R * * #7 3 15 31 1 16 32 M 48 -67 #8 1 1 0 77 19 0 R * * #9 0 41 7 0 41 9 A 49 -16 #10 1 0 0 45 52 0 I 0 -46 #11 0 13 25 4 34 22 I 39 -52 #12 1 3 0 68 26 0 R * * #13 0 28 12 0 39 19 I 41 -32 #14 0 0 0 44 47 7 I 0 -52 #15 0 21 3 7 67 0 I 24 -10
Table 6: Results of Second Survey
The second questionnaire was sent to the same group of 326 students electronically. The questionnaire dealt with factors such as intellectually challenging nature of the program, emphasis on real world problems, faculty interaction with students, and distance learning. Table 5 shows the factors evaluated in the second survey.
The results show that the 15 questions received responses that were widely varied. The decision mode were not limited to “I”, “A”, and “D” classifications. Questions 1 and 7 received the “M” (Must have) response, while questions 2, 4, 6, 8, and 12 received the “R” (Reverse) response. The “M” response indicates that increasing the factor will increase customer satisfaction while not doing so would strongly increase customer dissatisfaction. Since the decision mode “R” results no change in customer satisfaction, no computations are done for the last two columns.
The third survey, like the second one, had 15 factors of interest. The factors included strong job placement program, graduation rates, job in field of interest, diversity of student body, and years of business experience at the entry point. Table 7 shows all 15 factors represented in the survey.
Q#: OUTPUTS: Importance Questionnaire for the MBA Program 1 Your MBA program has a strong job placement program
2 The graduates of your MBA program are heavily recruited 3 The alumni provide great support for the MBA program
4 Your MBA program appears to be highly integrated and seems like one “big” course 5 Alumni are frequently requested to “give” to the MBA program
6 Once accepted into your MBA program most students do complete the program and obtain the degree
7 Graduates of your MBA program do get jobs in a field of their choice
8 Graduates of your MBA program do get jobs making 10 percent more than they were making before the degree
9 Graduates of your MBA program do get jobs making 20 percent more than they were making before the degree
10 Graduates of your MBA program do get jobs making 30 percent more than they were making before the degree
11 Your MBA program has a geographically diverse student body 12 Your MBA program has an ethnically diverse student body 13 Your MBA program has an Executive MBA
14 Administrators listen to students in your MBA program
15 Your classes have students with two or more years of business experience
Table 7: Third Survey Instrument
The third survey was electronically mailed to the same 326 students as the first two surveys. A total of 79 valid responses were received. An analysis similar to one performed on the first two surveys was conducted on the survey data. The end results are shown in Table 8.
The results show that the survey responders were indifferent to 8 factors out of 15. They identified three one-dimensional factors, and four reverse factors. Since all the survey results have been obtained, the decisions regarding the MBA program will be made. This will be done in two steps. In the first step, all useful information will be presented together. In the second step, this information will be synthesized. Table 9 presents all the useful information.
Computation of Decision Mode and Customer Satisfaction and Dissatisfaction
#Q #A #D #R #I #M Decision Mode Customer Satisfaction Customer Dissatisfaction
#1 0 16 30 1 17 15 D 58 -58 #2 1 0 0 67 11 0 R * * #3 0 20 32 0 11 16 D 66 -61 #4 0 0 0 62 17 0 R * * #5 0 22 13 0 34 10 I 44 -29 #6 0 0 0 30 47 2 I 0 * #7 0 11 3 3 59 3 I 18 -11 #8 1 1 0 30 47 0 I 1 -38 #9 0 21 9 0 46 3 I 38 -15 #10 0 0 0 34 45 0 I 0 -43 #11 0 15 13 0 26 25 I 35 -48 #12 0 0 0 64 14 1 R * * #13 0 22 28 1 8 20 D 63 -62 #14 0 0 1 60 18 0 R * * #15 0 10 17 1 26 25 I 34 -54
Table 8: Third Survey Results
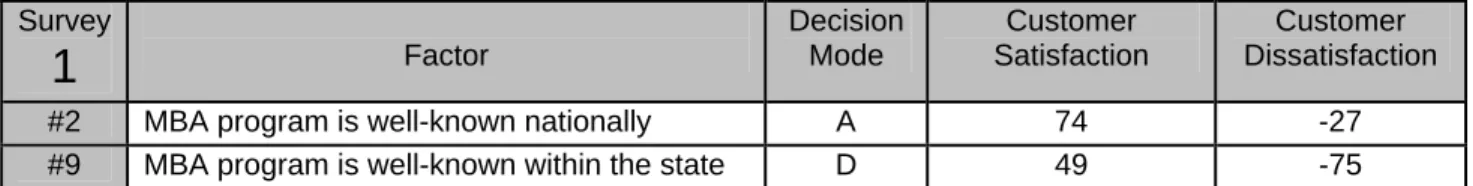
From the first survey two questions had decision modes “A” or “D”. From the second survey, four questions, two having the decision mode “M”, one with the decision mode “D”, and one with the decision code “A” were selected. Finally, from the third survey, three questions, all of them having the decision mode “D” were selected. The range for customer satisfaction and customer dissatisfactory varied widely for the selected questions in each survey. Taking a close look at the all the selected entries, the general sense of what the survey takers are recommended for the MBA program may be discerned. Table 10 assembles these thoughts in three categories: the one’s that are basic to the existence of the MBA program, the must haves, and the suggestions for consideration.
Survey
1
Factor Decision Mode Customer Satisfaction Customer Dissatisfaction #2 MBA program is well-known nationally A 74 -27 #9 MBA program is well-known within the state D 49 -75Survey
2
Factor Decision Mode Customer Satisfaction Customer Dissatisfaction #1 MBA program is intellectually challenging M 43 -92 #3 MBA program uses wireless technology D 54 -62 #7 MBA program has a strong quantitativeorientation
M 48 -67
#9 MBA program faculty interact with students A 49 -16
Survey
3
Factor Decision Mode Customer Satisfaction Customer Dissatisfaction #1 MBA program has strong job placement D 58 -58 #3 Alumni provide great support for program D 66 -61 #13 MBA program has an Executive option D 63 -62
Table 9: Overall Survey Results
MBA PROGRAM WON’T WORK WITHOUT THESE
• MBA program needs to be well-known in the state
• MBA alumni need to provide great support for the program • MBA program needs to have an Executive MBA option • MBA program needs to have a strong job placement • MBA program needs to use wireless technology
MUST HAVES FOR THE MBA PROGRAM
• MBA program should be intellectually challenging
• The MBA program should have a strong quantitative orientation
MBA PROGRAM SUGGESTIONS TO CONSIDER
• Promote the MBA program nationally
• MBA faculty need to interact more with the students
CONCLUSIONS
The Kano approach is quite helpful. In the opinion of the authors it works well with the administrators who often distrust recommendations mired in complex statistical reasoning. What did we accomplish by using Kano? The 42 factors whose impact on the MBA program had to be studied were reduced to just 9. In addition, based on the Kano classifications, they were arranged into three categories. The prioritization is helpful, especially in an era of limited budgets.
BIBLIOGRAPHY
[1] Best, R.J., “Market-Based Management: Strategies for Growing Customer Value and Profitability,” Pearson-Prentice Hall, Fourth Edition, p 100-105.
[2] Martensen, A. & Gronholdt, L, “Using Employee Satisfaction Measurement to Improve People Management: An Adaptation of Kano’s Quality Types, Total Quality Management, Vol. 12, No. 7&8, p949-957, 2001.
[3] Tan, K. C. & Shen, X. X., “Integrating Kano’s Model in the Planning Matrix of Quality Functional Deployment,” Total Quality Management, Dec 2000, Vol. 11, Issue 8.
[4] Kano, N., Seraku, N., Takahashi, F., & Tsuji, S., “Attractive Quality and Must-Be Quality, Hinshitsu (Quality, Journal of Japanese Society for Quality Control), 14, pp. 39-48, 1984. [5] Muuka, G. N., “International Business in American MBA Programs – Can We Silence the Critics,” Journal of Education for Business, Mar/Apr, 1999, Vol. 74, No. 4, p237-242. [6] Richards-Wilson, S., “Changing the Way MBA Programs Do Business-Lead or Languish,” Journal of Education for Business, May/Jun, 2002, p. 296-300.
[7] Duff, A., “Quality of Learning on an MBA Programme: The Impact of Approaches to Learning on Academic Performance,” Educational Psychology, Vol. 23, No. 2, 2003. [8] Haksever, C. & Muragishi, Y., “Measuring Value in MBA Programmes,” Education Economics, Apr, 1998, Vol. 6, No. 1, p11-25.
[9] Shekshnia, S. “The American MBA Program: A Russian Student’s View,” Russian Social Science Review, Mar/Apr, 1992, Vol. 33, No. 2, p27-35.
[10] Kano, N., Seraku, N., Takahashi, F. and Tsuji, S. (1984) Attractive quality and must-be quality, Hinshitsu (Quality, Journal of Japanese Society for Quality Control), 14 pp.39-48. [11] David Walden, Chairman of the Editorial Board, “A Special Issue on: Kano’s Methods for Understanding Customer-defined Quality.” Center for Quality of Management Journal, Volume 2, Number 4, Fall 1993, p 3.
[12] Noriaki Kano et al., “Attractive Quality and Must-Be Quality,” research summary of a presentation given at Nippon QC Gakka: 12th Annual Meeting (1982), January 18, 1984. Presentations given at the Japanese Society of Quality Control Annual meetings, Noriaki Kano, and Fumio Takahashi, “Himshitsu no M-H Sei Ni Tsuite” (Motivator and Hygiene Factor in Quality) October 1979; Noriaki Kano, Shimichi Tsuji, Nobuhiko Seraku, and Fumio Takashi, “Miryokuteki Himshitsu to Atarimae Himshitsu (1), (2) “(Attractive Quality and Must-Be Quality [1], [2]), October 1982.
[13] Yung-Hsin Chen and Chao-Ton Su, “A Kano-CKM Model for Customer Knowledge Discovery” Total Quality Management, Vol. 17, No. 5, 589-608, June 2006.
requirement in NASA’s microgravity science program, Quality Management Journal, 4(3), pp. 95-106.
[15] Huiskonen, J. & Pirttila, T. (1998) “Sharpening logistic customer service strategy planning by applying Kano’s quality element classification” International Journal of Production Economics, 56-57, pp. 253-260.
[16] Tan, K. C. & Shen, X. X. (2000) “Integrating Kano’s model in the planning matrix of quality function deployment,” Total Quality Management, 11(8), pp. 141-151. [17] Jane, Antoni Corbella & Dominquea, Savador Maturana. “Citizens’ Role in Health Services: Satisfaction Behavior: Kanos Model, Part 2. Q Manage Health Care Vol.12, No.1, pp.72-80. 2003
[18] Jane, Antoni Corbella & Dominquea, Savador Maturana. “Citizens’ Role in Health Services: Satisfaction Behavior: Kanos Model, Part 1. Q Manage Health Care Vol.12, No.1, pp.64-71. 2003
[19] Ying-Feng Kuo, “Integrating Kano’s Model into Web-community Service Quality” Total Quality Management, Vol. 15, No. 7, 925-39, September 2004.
[20] Vasilash, G. “From Kano Models to Bulls-Eyes: Hau Thai-Tang on Product Development, Automotive Design & Production, 118(2), 52-53. February 2006.
[21] Ching-Chow Yang, “The Refined Kano’s Model and its Application” Total Quality Management, Vol. 16, No. 10, 1127-1137, December 2005.
[22] Vontivilu, Hareash Nandalal, “Kano Model—Manage Quality Through Measurement” ASQ World Conference on Quality and Improvement Proceedings, pp. 557-566, 2005.