Procedia Computer Science 50 ( 2015 ) 456 – 465
1877-0509 © 2015 The Authors. Published by Elsevier B.V. This is an open access article under the CC BY-NC-ND license (http://creativecommons.org/licenses/by-nc-nd/4.0/).
Peer-review under responsibility of scientific committee of 2nd International Symposium on Big Data and Cloud Computing (ISBCC’15) doi: 10.1016/j.procs.2015.04.015
ScienceDirect
2nd International Symposium on Big Data and Cloud Computing (ISBCC’15)
Unstructured Data Analysis on Big Data using Map Reduce
Subramaniyaswamy V
a, Vijayakumar V
b, Logesh R
cand Indragandhi V
da,cSchool of Computing, SASTRA University, Thanjavur-613401, India bSchool of Computer Science and Engineering, VIT University, Chennai-600127,India dSchool of Electrical and Electronics Engineering, SASTRA University, Thanjavur-613401, India
Abstract
In the real time scenario, the volume of data used linearly increases with time. Social networking sites like Facebook, Twitter discovered the growth of data which will be uncontrollable in the future. In order to manage the huge volume of data, the proposed method will process the data in parallel as small chunks in distributed clusters and aggregate all the data across clusters to obtain the final processed data. In Hadoop framework, MapReduce is used to perform the task of filtering, aggregation and to maintain the efficient storage structure. The data are preferably refined using collaborative filtering, under the prediction mechanism of particular data needed by the user. The proposed method is enhanced by using the techniques such as sentiment analysis through natural language processing for parsing the data into tokens and emoticon based clustering. The process of data clustering is based on user emotions to get the data needed by a specific user. The results show that the proposed approach significantly increases the performance of complexity analysis.
© 2015 The Authors. Published by Elsevier B.V.
Peer-review under responsibility of scientific committee of 2nd International Symposium on Big Data and Cloud Computing
(ISBCC’15).
Keywords: Hadoop; MapReduce; Collaborative Filtering; Mahout; Maven; Sentiment Analysis
1. INTRODUCTION
A research work in 2013 by SINTEF (Stiftelsen for Industriell Og Teknisk Forskning), illustrates the largest independent research organization in Scandinavia proved that 90% of the world's entire data had been generated within the last two years 2011 and 2012. This fact helps us to think about the drastic rise in the generation of data across the globe. Generally the growing data are normally unstructured. Every day the users of social media like Facebook and Twitter are growing in an unimaginable range. The social networking media provides the services to
© 2015 The Authors. Published by Elsevier B.V. This is an open access article under the CC BY-NC-ND license (http://creativecommons.org/licenses/by-nc-nd/4.0/).
Peer-review under responsibility of scientific committee of 2nd International Symposium on Big Data and Cloud Computing (ISBCC’15)
the people relying on them with advanced features like time saving and easy to surf in a very attractive manner. Since the generated data is unstructured, data should be managed in order to satisfy our future needs.
Legacy Systems is not much helpful in structural analysis of big data. Hadoop is a parallel programming platform built on the Hadoop Distributed File Systems (HDFS) and also the MapReduce computations. According to Lee et al. (2013) distributed Systems are widely used for processing large amount of data which supports high – level operations and hold some distributed computing aspects such as scheduling and fault tolerance. This MapReduce computation processes the data and gives us the (key, value) pairs. Hadoop helps us to process terabytes of data by using computer clusters made of normal, commodity hardware. One of the main advantages of Hadoop is inbuilt fault tolerance and runs on a normal commodity behave in a redundant manner.
1.1. Objective of study
With the concern of big data, the three main challenges being faced are volume, velocity and variety. Volume refers to the amount of data to be processed, velocity refers to the speed at which the data are processed and variety is the ability to manage different types of data. Veracity is the abnormality or uncertainties of the data. The big data capture, manage and process the large data in an efficient way. Nowadays, large volumes of data are in an unstructured manner. It is very difficult to perform the operation in unstructured data. So the data need to be structured in order to perform some operations. Hadoop Map Reduce and collaborative filtering approach are used to structure the data and generates recommendations based on user preferences. The sentiment analysis technique is used to analyze the sentiments of a user based on Text Analysis.
The persisting paper is devised as follows: Section 2 deals with the Hash Algorithm and MRAP (MapReduceAccessPatterns), Section 3 indulges the overview of Hadoop Map reduce and Collaborative Filtering, Section 4 describes the procedure of Hadoop Map reduce, Section 5 illustrates the Collaborative filtering and Recommendation generation, Section 6 demonstrates the Sentiment Analysis, Section 7 describes the performance evaluation and Section 8 reaches the conclusion of this paper.
2. RELATED WORK
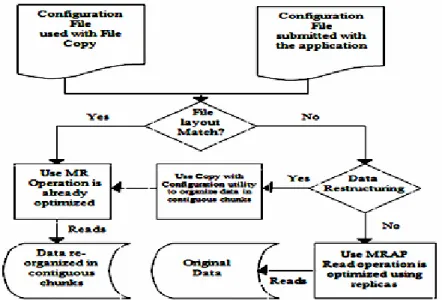
Hadoop is an open source framework which is used for big data analysis. Hadoop uses the universal hash algorithm H (x) to partition the data sets. The partition process includes the two hash functions (H1(x), H2(x)). H1(x) is calculated by the formula h(x) modn1 and similarly H2(x) can be calculated with the constraint n2. After calculating each hash value, the value is passed on to the reducer. For an aggregation of datasets, each has value is associated with each reducer task (Jiang et al. 2011). Data restructuring is performed by using Map Reduce Access Patterns (MRAP).It is implemented by calculating various map and reduce patterns and rearranging all the data tasks. The data restructuring using MRAP is shown in Figure 1. MRAP uses Map and Reduce optimizations.
In the early days of Google search, engineers needed a way to store and retrieve the data in an efficient way that would scale to very large sizes. In 2003, the highly regarded community-focused Doug Cutting created an open source version of the framework called Hadoop. Hadoop is created by Doug Cutting and Mike Cafarella in 2005,
developed to support distribution for the Nutch search engine project. Hadoop requires Java Runtime Environment (JRE) 1.6 or higher versions. The standard startup and shutdown script obliges secure shell to be set up between nodes and cluster. It consists of OS level Abstractions such as MapReduce Engine and Hadoop Distributed File System (HDFS). HDFS is a file System written in Java Hadoop Framework. The Evolution of Hadoop has an ardent development in the field of big data. Hadoop supports the structure of Big Data as it is a parallel programming platform (Afrati & Ullman 2011).
Figure 1. MRAP Technique for Data Restructuring
For a specific group of people the survey can be taken by asking their interest and displaying the things they like the next time when they try to access the same shop. These kinds of techniques applied in the web sites and social networking sites too. Sites perform some predictions in respective fields to satisfy the customers. Depends upon the suggestions or recommendations given by user, collaborative filtering technique predicts the data. The data may be in varied types. Paul Resnick et al proposed collaborative filtering concept called GroupLens- an open architecture for collaborative filtering of Netnews. Linden et al. (2003) proposed a concept of GroupLens helps the user to find the articles what they wants from a large set of articles and also helps them to rate the article based on the scores. Sentiment Analysis is used to discover the attitude of the user who is speaking or writing with respect to some theme or the polarity based contextual analysis of the document. The vital work of the polarity based Sentiment Analysis in our work is to classify the sentence into positive or negative or neutral one based on the polarity values of the sentence. The number of researches on sentiment analysis results in numerous advancements. One of the prominent developments was found in Delta TFIDF: An Improved Feature Space for Sentiment Analysis proposed by Justin Martineau and Tim Finin, presents a technique helps us to efficiently weight the scores of the words before
classification. “Opinion Mining and Sentiment Analysis” described by Bo Pang and Lillian Lee is another research work which explains the opinion-oriented information-seeking systems working methodology (Prabowo & Thelwall, 2009).
3. PROPOSED SYSTEM
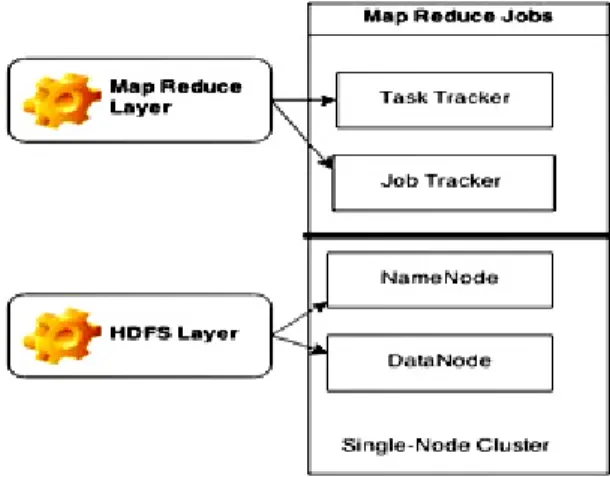
Large amount of unstructured data needs structural arrangement for processing the data. Hadoop is binary compatible with Map reduce. Map Reduce is a shuffling strategy to perform filtering and aggregation of data analysis tasks. Map is nothing but the filtering technique used for filtering the datasets and similarly Reduce is a technique used for aggregation of data sets. Collaborative Filtering and Sentiment Analysis Techniques can be used to generate efficient recommendation. Collaborative Filtering Technique is used to generate recommendations based on user data. Sentiment Analysis is a technique which uses natural language processing and Text analysis techniques for predicting the user sentiments based on polarity. The distributed system for the map reduce job is shown in Figure 2.
3.1. Volume, Velocity and Variety
The 3Vs mentioned in the heading are the basic necessities for grouping the data before the actual structuring process is done. Volume of data is represented by means of Big Data analytics. The number of people interacting with the social media (Twitter and Facebook) is increasing drastically everyday and as a result of this large volume of data.
By means of knowing the volume associated with data which indirectly explores the velocity of data. The data flow from the machine or the result of human interaction or any other possible, applications.
Next the variety, data may be from any source. The source may be structured data or unstructured data or a mixture of both (since we have to undergo the checking process in accordance with numerous criteria to judge whether the data is structured or unstructured). Sources like excel sheets and databases provides structured data , In the sense unstructured data is in various other forms like video, audio, pictures.
Figure 2. Map reduce Jobs 3.2. Processing Big Data from social sites
Social site data are the data items having some vulnerability that has to be processed and used efficiently. The data coming out from a single user's google or Facebook or Twitter accounts helps us to track the user's interests in various aspects. We collect those data items and place them in a repository for our future use. The repository used for collecting the data items and having the capability of avoiding the data loss or crash. The main purpose of data collection is to make things simple for the user. Big data classification can be a long and complex process (Tankard, 2012).
In the field of Big Data, a property called “Predictability”, which is a phenomenal feature. We can use the prediction to display the data to the user based on their requirements.
In general what the user needs? This question can be answered correctly to some extend by predicting their taste. A specific algorithm is designed for prioritizing the information in Hadoop. The data items can be processed in various ways for various uses. We can merge or arrange the information based on a property. Now the first step is we are trying to arrange the data items first (The data is the raw data obtained from the social sites) and then sort them based on any property. The third step is to create a database which consists of the processed data (of the previous users). When the data of a new user is processed, the comparison operation is performed with the information of other users in the database. When the user's interests or tweets or any other property (based on which we process the data) matches with any other users in the database, then based on their interests we display the next information to the new user. Now we add the new user's processed data to the database (Tankard, 2012). When the
next data is processed (for a new user) and when it matches some data items in the database which are the same as that of the previously mentioned user's matches then now it matches with the information of the new user. So now the interests of the users are checked and the pattern which matches almost to the new user is considered.
4. HADOOP
As it is a big data processing, it should be possible for us to run applications on systems that involve thousands of nodes containing terabytes of data. Hadoop makes it possible because of its distributed File System. It also helps us to continue operation even when there is node failure. A single point failure doesn't affect the catastrophic system failure. Hadoop is an open-source Map reduce implementation designed for large clusters. It consists of a single master node called the JobTracker and many slave nodes called the TaskTrackers. As defined in Zaharia et al. (2008) JobTracker is responsible for parallelizing the job execution across nodes and ensuring fault tolerance.
Hadoop runs at its best in Ubuntu. The data set obtained from the social sites (say Facebook or Twitter) should be processed in such a way that the randomness in the data should be removed. It has been done by arranging them according to the types. Now the arranged data are sorted. This sorting is done for better understanding. The user names are sorted according to the expressions they use or the departments to which they belong, or any other criteria. This processing of data has been done using the Map Reduce technique with suitable algorithm. The MapReduce processes the data to arrange them according to user specifications. The execution of the Map Reduce algorithm is done using the eclipse plug-in. This is because the error detection and correction becomes a tedious process in Ubuntu terminal when compared to eclipse plug-in . There are two types of HDFS nodes: DataNode and NameNode. The DataNode stores the data blocks of the files in HDFS and NameNode contains the metadata, with the enumeration of blocks of HDFS and a list of DataNode in the cluster (Bakshi, 2012).
4.1. MapReduce
MapReduce Framework is a methodology to process data paralleled by the distribution of data as small chunks across the clusters. The huge volume data divided into chunks has to be checked for interdependencies to avoid critical problems while aggregation of these resulting sets to get the required structured data. The data have to be clustered based on their deadline scheduled for processing, priorities and data dependencies. If processing of one data requires the output of other data as its input, then it can be combined together to form a cluster. The clusters can also be formed on the basis of priority and processing of the data clusters. MapReduce technique is mainly used for parallel processing of data sets across various clusters known as filtering, performed by the map function and generating computation result by aggregation, which is the reduce function.
The Map Join Reduce technique is used for the processing the heterogeneous data items. It does not shuffle the intermediate results that are to be passed from mapper to reducer and it avoids check pointing of results frequently. In MapReduce, the map tasks and incomplete reduce tasks will be re executed instead of the entire map and reduce tasks in case of a single node failure. We can achieve the minimum execution time. Some frameworks based on MapReduce are proposed which are capable of understanding data semantics, simplifying the writing of analytics applications and potentially improving performance by reducing MapReduce phases (Sehrish et al. 2013).
4.2. Processing flow of MapReduce jobs
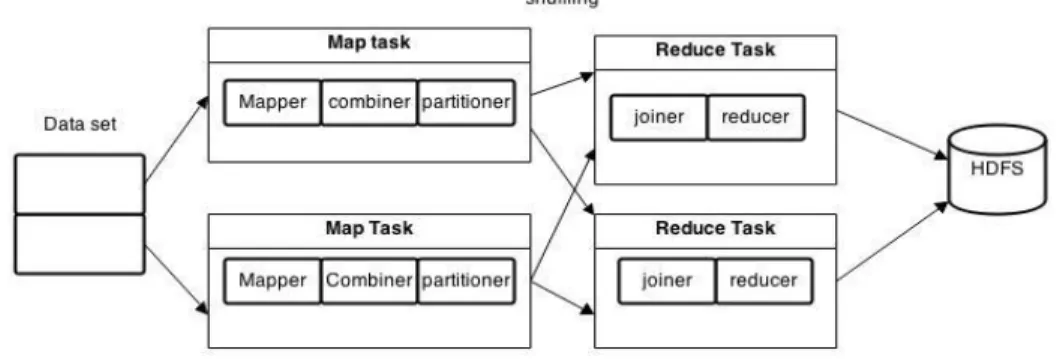
Map job involves 3 sub tasks such as Mapper, Combiner and Partitioner. Mapper involves the mapping of data, combiner combines the mapped data and partitions splits the data into small clusters, after which the shuffling key/value of map job to unique reduce job is done. Some studies show that short jobs, compose a large portion of MapReduce jobs (Jiang et al. 2011). For example, the average execution time of MapReduce jobs at Google in September 2007 is 395 seconds (Zaharia et al. 2008).
Reduce job involves 2 subtasks namely joiner and reducer. The joiner holds the joining of the intermediate results from the map jobs and reducer subtask is used for performing aggregation. After the map and reduce jobs, the end
result is stored in Hadoop Distributed File System [HDFS] (Gu et al. 2014). Figure 3 shows the execution flow of MapReduce process.
Figure 3. Execution Flow of a MapReduce process. 4.3. Datasets
Map reduce is applied in Twitter Datasets which consists of information like user name, location, department, tweet and expressions. Thus the Twitter dataset is given as input to map-reduce process for the refinement and structuring. 4.4. Running Hadoop MapReduce
The Twitter Dataset which is given as an input to the MapReduce process. The Hadoop MapReduce program is
supplied with the above twitter data sets as input and the MapReduce process is run for the ‘N’ number of data in the
dataset. This process can be executed for inputs of any size. It supports fast and efficient processing of the data, by which unstructured data on any volume can be structured successfully. The output file generated by this MapReduce Technique has to be removed every time before running it in order to avoid File already exist exception.
4.5. HDFS Results
The Hadoop distributed File system output for a MapReduce job can be used to store the final results of map reduce process and the output can be viewed by browsing the file system in the name node log. The jobs that are completed while processing of the MapReduce process is given by job details log. NameNode log also contains information about the cluster summary, capacity of the file systems, distributed file system used and remaining and also the number of live nodes and dead nodes (Tankard, 2012). The NameNode and JobTracker Details obtained as the result of the execution of Map Reduce process. NameNode log can be used to locate the output directory of the file system and the output of the map reduce job.
Job Details log: Log contains information about the kind of jobs and reports the user whether the job is completed or running or killed.
4.6. Structuring of the unstructured data
After the successful execution of the map reduce program, the resulting data set is structured with a particular order according to the user requirements.
5. PREDICTION BASED ON COLLABORATIVE FILTERING
Once the data is structured by MapReduce, technique of collaborative filtering is applied to the structured data in order to have an effective processing of queries in the big data and to maintain efficient storage structure. Collaborative filtering is a methodology of predicting the taste of an individual user by finding the similarity
between past data of all users and the data of the current user. Collaborative filtering practices to obtain the best recommendations possible. Model Based Collaborative Filtering, which is presented by Yang et al. (2011) is used in this application. The apache mahout performs the Collaborative filtering technique.
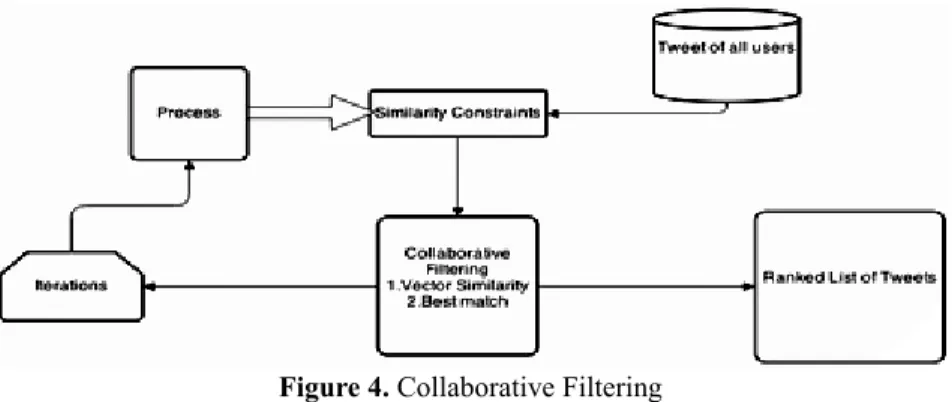
By finding the similarity constraints between the tweets of all users, which is maintained in a repository and that of a particular user, the prediction is done and the ranked list of the predicted data will be displayed to the particular user as shown in Figure 4 (Linden et al. 2013). In collaborative filtering, response observations {(u, i, y)} with each y being an observed response (e.g. The user’s rating to an item, or indication of whether user, you took an action on item i). For a user u, who performs some actions on the item i, Mapping is done as: (u,i)→ y. This y represents the key pair of the user and the item on which the user performs the actions (Yang et al. 2011). By using the response from the user and items, the predictions will be performed using collaborative filtering.
Figure 4. Collaborative Filtering
There are different types of collaborative Filtering techniques. The most efficient collaborative filtering technique is Item-Based Collaborative Filtering.
5.1. Maven and Mahout Tools
Mahout and maven are the software tools used in the implementation of the collaborative filtering algorithm. Mahout is distributed under a commercially friendly Apache Software license. Mahout is easily scalable for large datasets and the mahout tool comes with packages for User and Item based recommenders, clustering algorithms such as K-means and clustering K-means algorithm. It also includes classifier algorithms such as Naïve Bayesian, Regression classifier and forest algorithms. In this section we are only using Item based recommenders for the prediction of the taste of a user through collaborative filtering algorithm. The latest version is Apache Mahout-0.9. Maven is an open source build manager for mahout coding. Mahout should be integrated with maven for running the build and this integration is done by using mvn install within the mahout source file. Mahout can be integrated with eclipse by using an mvn eclipse. Maven used to build and manage projects written in many languages such as C, Ruby and Scala. It is also used for establishing and managing dependencies as well. These dependencies will be located in the pom.xml. Maven requires the structure and implementation details to be provided clearly in the pom.xml file. Maven follows a convention to list the workflows supported in a project. Recommendation Generation
Users can provide various tweets depending upon their mood. The tweets along with the emotions are taken as input for the collaborative filtering process. So the input, transforms into the collaborative filtering process, a list of recommendations for each twitter user will be generated using the caching Recommender. This recommender can be used to generate any number of recommendations for a particular user based on a given input.
6. SENTIMENT ANALYSIS
Sentiment analysis is a technique which involves natural language processing and text analysis. The sentiment content of the text is characterized by using techniques such as Natural Language Processing, statistics or any of the machine learning methods. Sentiment Analysis can also be proceeded by based on rule based classifier or supervised learning (Prabowo & Thelwall, 2009).
It is sometimes referred to as opinion mining, although the emphasis in this case is on extraction. This is used for predicting positivity of text by parsing the text or tweet into the number of words. It uses machine learning elements such as support vector machines or latent sentiment analysis for predicting the sentiments of a user. Sentiment analysis can be classified into three types such as polarity based sentiment analysis, subject or object based sentiment analysis and Aspect oriented sentiment analysis. We are dealing with polarity based Sentiment analysis, in which the words involved in a text file will be given a threshold value.
The threshold limit is set between -3 to +3. If the twitter dataset is given as input, then a score will be returned along with tweet of each user. Based on the score value, the tweet will be classified as positive, negative or neutral one. If the score is zero, the tweet will be classified as a neutral one and if the score returned is greater than zero, then the tweet will be chosen as positive tweet, and if the score returned is less than zero, the tweet will be considered as a negative one. A tweet with high positivity will be the most recommended one for any user and a tweet with high negativity will be the least recommended one. Data processing in Sentiment Analysis involves (i) Tokenization, (ii) Normalization, (iii) Tagging (Kouloumpis et al. 2012). The accuracy of the sentiment analysis of human perception varies from 70-79 %.
7. COMPARISION AND PERFORMANCE EVALUATION
In MRAP, it performs multiple sequential reads per map task, whereas in map reduce reads, It performs only single read for a single map task. For data restructuring, MRAP restructuring eliminates multiple map reduce phases to
improve the access patterns. But in Collaborative Filtering restructuring, the predicted is based on the user’s
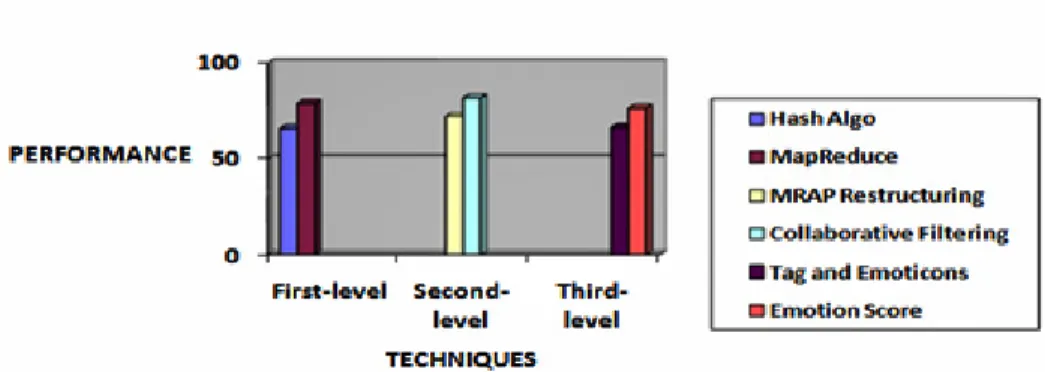
suggestions to generate a Recommendation System. The Figure 5. shows the comparison between the existing and proposed Systems. The Table 1. shows the comparison between the Existing and Proposed Systems.
Table.1 Comparison between Existing and Proposed Systems
Features Existing System Proposed System
Jobs Performed Hash Algorithm Map Reduce tasks Data Restructuring MRAP tasks Collaborative Filtering Recommendations
Based on
MRAP Restructuring User’s Prediction
Sentiment Analysis Emoticons and tagging Emotion Score
7.1. Complexity Analysis
In filtering and aggregation of jobs Map Reduce jobs is time consuming in nature than Hash algorithm in. The hash algorithm consumes more time because it has to calculate the hash values for both map and reduce operations and store it in a hash table. Whenever it performs the job execution, the hash value is taken from the hash table and combines it with the number of tasks it performs and produces the result.The MapReduce need not calculate the hash value and just it performs the mapping and reducing of the data.
The collaborative filtering technique takes less time because it uses a mahout tool called a caching recommender for predicting the tweet of the users (Figure 6). MRAP uses the Map Reduce Access Patterns which consumes more time because it is a more complex task to generate map and reduce patterns. The time complexity as a whole becomes O(log n).
The Hash algorithm consumes more space than the MapReduce because it needs a lot of space for storing the hash values and hash tables (Figure 7). It needs the space to store the hash value pairs, whereas in MapReduce, it does not require the space to be allocated separately for hash table and hash values. The MRAP requires a large amount of space to be owned for storing the large number of map and reduce access patterns. The collaborative filtering
does not require space for access patterns, but it occupies very low space for storing the recommendations. The Sentiment Analysis also requires very low space for storing the dictionary of words that expresses user emotions. The space complexity is O(n).
Figure 5. Comparison between existing and proposed Systems
Figure 6. Time Complexity Analysis
8. CONCLUSION AND FUTURE WORK
In this research work, the unstructured data is structured and processed by using MapReduce technique and the
automatic prediction of user’s taste is done through collaborative filtering. Map reduce is the most efficient technique for processing large volume of data and the application of collaborative filtering and sentiment analysis provides recommendation generation for any number of data provided as input. This MapReduce job can also be implemented in distributed mode in which we can use an N number of slaves for a single master. For lodging the huge data sets, Apache HBASE database support can be used. A pre-history, cache table can also be used for generating recommendations for a single user. By using Emoticon Based clustering and Tagging Techniques the developed method can be enhanced and the recommendation generation process can be even more efficient and optimized efficiently.
REFERENCES
1. Afrati, F.N. & Ullman, J.D. (2011) Optimizing Multiway Joins in a Map-Reduce Environment. IEEE Transactions on Knowledge and Data Engineering, 23(9), 1282-1298.
2. Bakshi, K. (2012) Considerations for Big Data: Architecture and Approach. IEEE Aerospace Conference, (pp.1-7). Big Sky, USA.
3. Gu, R., Yang, X., Yan, J., Sun, Y., Wang, B., Yuan, C. & Huang, Y. (2014) SHadoop: Improving MapReduce Performance by Optimizing Job Execution Mechanism in Hadoop Clusters. Journal of Parallel and Distributed Computing, 74(3), 2166-2179.
4. Jiang, D., Tung, A. & Chen, G. (2011) MAP-JOIN-REDUCE: Toward Scalable and Efficient Data Analysis on Large Clusters. IEEE Transactions on Knowledge and Data Engineering, 23(9), 1299-1311.
5. Kouloumpis, E., Wilson, T. & Moore, J. (2011) Twitter Sentiment Analysis: The Good the Bad and the OMG!. Fifth International AAAI Conference on Weblogs and Social Media, The AAAI Press, (pp.538-541). Barcelona, Spain.
6. Kraska, T. (2013) Finding the Needle in the Big Data Systems Haystack. IEEE Internet Computing, 17(1), 84-86.
7. Lee, D., Kim J-S. & Maeng, S. (2013) A Large-scale incremental processing with MapReduce. Future Generation Computer System, 36, pp 66-79.
8. Linden, G., Smith, B. & York, J. (2003) Amazon.com recommendations: Item-to-Item Collaborative Filtering. IEEE Internet Computing, 7(1), 76-80.
9. Prabowo, R. & Thelwall, M. (2009) Sentiment Analysis: A Combined Approach. Journal of Informetrics, 3(2), 143-157.
10. Sehrish, S., Mackey, G., Shang, P., Wang, J. & Bent, J. (2013) Supporting HPC Analytics Applications with Access Patterns Using Data Restructuring and Data-Centric Scheduling Techniques in Map reduce. IEEE Transactions on Parallel and Distributed Systems, 24(1), 158-168.
11. Tankard, C. (2012) Big data security. Network Security, 2012(7), 5-8.
12. Yang, S-H., Long, B., Smola, A.J., Zha, H. & Zheng, Z. (2011) Collaborative Competitive Filtering: Learning Recommender Using Context of User Choice. Proceedings of the 34th international ACM SIGIR conference on Research and development in Information Retrieval, (pp 295-304). Beijing, China.
13. Zaharia, M., Konwinski, A., Joseph, A.D., Katz, R. & Stoica, I. (2008) Improving Map reduce performance in heterogeneous environments. Proceedings of the 8th USENIX conference on Operating systems design and implementation (OSDI), (pp 29-42). San Diego, California, USA.