http://wrap.warwick.ac.uk
Original citation:
Luo, Xing, Wang, Jihong, Krupke, Christopher, Wang, Yue, Sheng, Yong, Li, Jian, Xu,
Yujie, Wang, Dan, Miao, Shihong and Chen, Haisheng. (2016) Modelling study,
efficiency analysis and optimisation of large-scale Adiabatic Compressed Air Energy
Storage systems with low-temperature thermal storage. Applied Energy, 162 . pp.
589-600.
Permanent WRAP url:
http://wrap.warwick.ac.uk/76075
Copyright and reuse:
The Warwick Research Archive Portal (WRAP) makes this work of researchers of the
University of Warwick available open access under the following conditions.
This article is made available under the Creative Commons Attribution 4.0 International
license (CC BY 4.0) and may be reused according to the conditions of the license. For
more details see:
http://creativecommons.org/licenses/by/4.0/
A note on versions:
The version presented in WRAP is the published version, or, version of record, and may
be cited as it appears here.
Modelling study, efficiency analysis and optimisation of large-scale
Adiabatic Compressed Air Energy Storage systems
with low-temperature thermal storage
Xing Luo
a, Jihong Wang
a,c,⇑, Christopher Krupke
a, Yue Wang
a, Yong Sheng
b, Jian Li
c, Yujie Xu
b,
Dan Wang
c, Shihong Miao
c, Haisheng Chen
baSchool of Engineering, University of Warwick, UK b
Institute of Engineering Thermophysics, Chinese Academy of Sciences, China c
School of Electrical & Electronic Engineering, Huazhong University of Science & Technology, China
h i g h l i g h t s
The paper presents an A-CAES system thermodynamic model with low temperature thermal energy storage integration. The initial parameter value ranges for A-CAES system simulation are identified from the study of a CAES plant in operation. The strategies of system efficiency improvement are investigated via a parametric study with a sensitivity analysis. Various system configurations are discussed for analysing the efficiency improvement potentials.
a r t i c l e
i n f o
Article history:
Received 6 August 2015
Received in revised form 10 October 2015 Accepted 12 October 2015
Available online 11 November 2015
Keywords:
Energy storage
Compressed Air Energy Storage Mathematical modelling Efficiency
Optimisation Power systems
a b s t r a c t
The key feature of Adiabatic Compressed Air Energy Storage (A-CAES) is the reuse of the heat generated from the air compression process at the stage of air expansion. This increases the complexity of the whole system since the heat exchange and thermal storage units must have the capacities and performance to match the air compression/expansion units. Thus it raises a strong demand in the whole system mod-elling and simulation tool for A-CAES system optimisation. The paper presents a new whole system math-ematical model for A-CAES with simulation implementation and the model is developed with consideration of lowing capital cost of the system. The paper then focuses on the study of system effi-ciency improvement strategies via parametric analysis and system structure optimisation. The paper investigates how the system efficiency is affected by the system component performance and parame-ters. From the study, the key parameters are identified, which give dominant influences in improving the system efficiency. The study is extended onto optimal system configuration and the recommenda-tions are made for achieving higher efficiency, which provides a useful guidance for A-CAES system design.
Ó2015 The Authors. Published by Elsevier Ltd. This is an open access article under the CC BY license (http:// creativecommons.org/licenses/by/4.0/).
1. Introduction
Power network reliability is facing a great challenge in coping with the rapid increase of intermittent renewable energy integra-tion. To address the challenge, various solutions are studied, among which Electrical Energy Storage (EES) has been recognized as one of the enabling technologies in supporting the current and
future grid operation [1–3]. Various EES technologies with a
comprehensive characteristic matrix can offer technical and eco-nomic benefits from generation, transmission and distribution to
demand side management[4]. Among all EES technologies,
Com-pressed Air Energy Storage (CAES) shows its distinguished merits, such as large-scale, low cost, long lifetime and the established
operation experience[4,5]. CAES is considered as one of the
cheap-est EES technologies in terms of capital cost ($/kW h) and
mainte-nance cost ($/kW-year)[4–6]. CAES works in the process as: the
ambient air is compressed via compressors into one or more stor-age reservoir(s) during the periods of low electricity demand (off-peak) and the energy is stored in the form of high pressure com-pressed air in the reservoir(s); during the periods of high electricity
http://dx.doi.org/10.1016/j.apenergy.2015.10.091
0306-2619/Ó2015 The Authors. Published by Elsevier Ltd.
This is an open access article under the CC BY license (http://creativecommons.org/licenses/by/4.0/). ⇑ Corresponding author at: School of Engineering, University of Warwick, UK.
E-mail addresses: [email protected], [email protected]
(J. Wang).
Contents lists available atScienceDirect
Applied Energy
demand (on-peak), the stored compressed air is released, heated by a heat source from the combustion of fossil fuels or other meth-ods, and then the energy in compressed air (or post-combustion gas) is captured by turbines/expanders to generate electricity.
The major concern in deployment of CAES is its relatively low cycle efficiency compared with other EES technologies as shown
inFig. 1 [4,6,7]. There are two large-scale CAES plants in
commer-cial operation worldwide, which are Huntorf CAES plant in Ger-many built in 1978 and McIntosh CAES plant in US built in 1991; both CAES plants burn gas as the heat source; the former has cycle efficiency around 42% and the latter is with around 53% cycle
effi-ciency (Fig. 1)[4,8,9]. To improve CAES efficiency and avoid using
fossil fuels, the Adiabatic CAES (A-CAES) system concept was
pro-posed[8,10–13]. A-CAES combined with Thermal Energy Storage
(TES) is to extract heat from the stage of air compression and store it in an adiabatic reservoir. The heat is then reused for the air
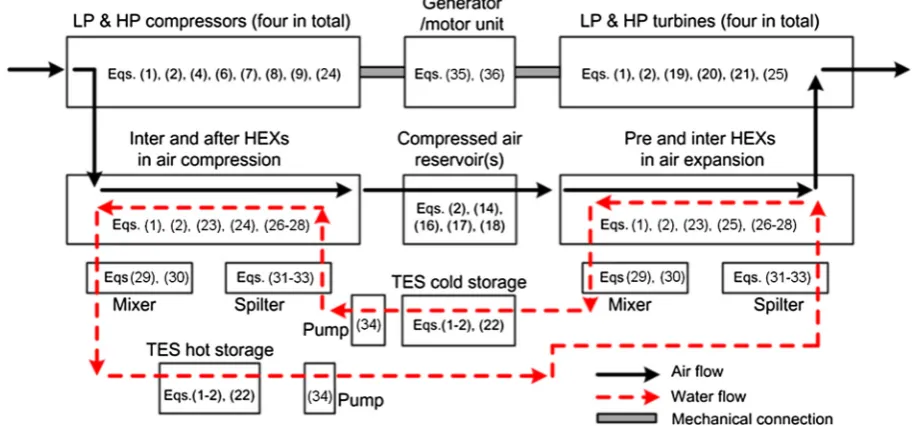
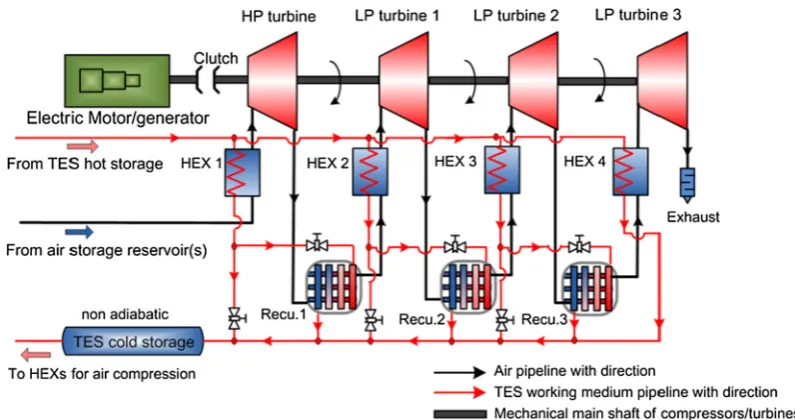
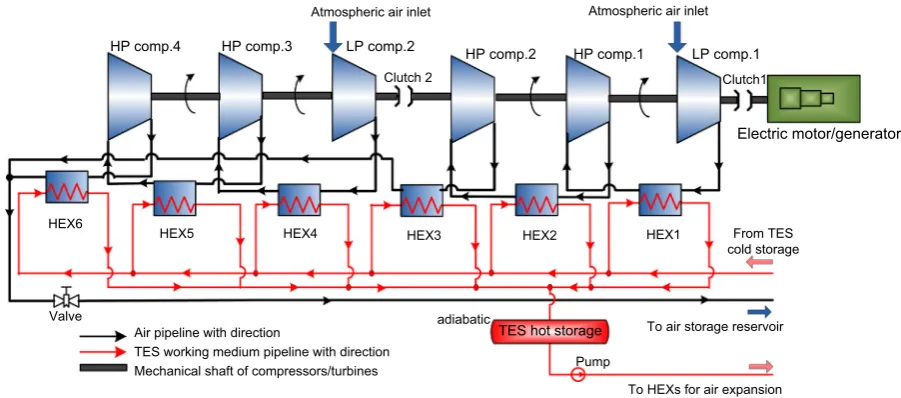
expansion and electricity generation process. Fig. 2 illustrates a
schematic layout for a typical A-CAES system, which is composed of: (i) a reversible motor/generator unit with clutch mechanisms to engage either with compressors or expanders; (ii) a multi-stage air compression unit operating with a group of Heat Exchangers (HEXs) to capture the heat produced; (iii) a multi-stage air expansion unit with another group of HEXs to heat the compressed air in the expansion stage; (iv) ‘‘hot” and ‘‘cold” ther-mal storage reservoirs working with the two groups of HEXs to form the TES cycle; (v) underground cavern(s) or aboveground tank(s) for storing compressed air; (vi) a power conditioning sys-tem for ensuring optimal generation of the electricity to match the requirements of the external power network; and (vii) a con-trol system for coordinative operation of the whole system.
With the strategy of re-using the heat energy generated from air compression, A-CAES has a great potential to achieve a higher cycle
efficiency compared to conventional CAES[4,10,14,15]. Currently,
there mainly are two technology trends reported: A-CAES with high temperature TES and A-CAES with low temperature TES
[10,12,16,14,15,17–20]. The research and development in this area
has been very active in recent years. Pickard et al. presented an
ini-tial energy and exergy analysis of an ideal A-CAES system[21].
Zhang et al. studied the effect of TES on A-CAES system efficiency and the influences of temperature and pressure variations on the
utilization of thermal energy from TES[22]. A hybrid EES system
consisting of A-CAES and flywheel energy storage for wind power
applications was proposed by Zhao et al.[16]. Following a
thermo-dynamic analysis of A-CAES with artificial reservoirs, Grazzini and Milazzo designed a set of criteria for the A-CAES system with
particular attention to HEXs [14]. Hartmann et al. contributed a
simulation study of cycle efficiency on A-CAES systems, which shows the efficiency of a polytropic configuration is about 60% and the efficiency of an ideal isentropic configuration is about
70%[15]. Wolf and Budt recently proposed a low-temperature
A-CAES design concept with the cycle efficiency in the range of 52–
60%, and a brief economic analysis was also given in[17]. It is
found that a number of A-CAES demonstration plants or facilities are under development or in early stage experiment around the world. A planned but currently paused large-scale A-CAES plant – ADELE in Germany was designed to have a capacity of 90 MW
and 360 MW h with the target of70% cycle efficiency[4,10]. A
1.5 MW A-CAES demonstration facility located near Beijing, China, was recently built by the Institute of Engineering Thermophysics, Chinese Academy of Sciences, and its initial experimental tests
are on-going[23]. LightSail Energy Ltd in US is developing the
A-CAES system via using reversible reciprocating piston machines [24].
This paper examines the potential of system efficiency improve-ment for adopting low temperature TES in A-CAES. The main con-tributions of the paper are: (1) it presents a set of mathematical models of the system components and develops a whole system model of A-CAES with low temperature TES integration; (2) with the study of the Huntorf CAES plant, the range of a set of system parameters are identified to give the initial condition parameters in A-CAES system simulation study, which also provides a useful guideline for other researchers in selecting initial condition param-eters; (3) with the simulation study using the whole system model, the optimal strategies for system efficiency improvements are investigated via a parametric study with sensitivity analysis of component parameters/performance indexes; and (4) following the achievements from the above study, the various system config-urations aiming for system efficiency improvement are designed and discussed, and the recommendations are made.
2. Mathematical modelling of A-CAES systems
This section begins with the description of the system govern-ing equations. Then the mathematical modellgovern-ing to A-CAES system components is presented. The ideal air is assumed to be used in the whole modelling process.
2.1. Governing equations of modelling of A-CAES systems
[image:3.595.82.506.67.239.2]In modelling all the system components, it is necessary to ensure the balance of the mass and energy flow in and out the
components. The following equations are the fundamental govern-ing equations to modellgovern-ing the whole system.
The rate of mass change to speciesjin a standard component
which uses fluid as its working medium can be described[25,26],
dmj
dt ¼m_in;jm_out;jþNj ð1Þ
wherem_in;jandm_out;jstand for the mass flow rates of speciesjat the
all inlets and outlets respectively;Njrepresents the net production
rate of speciesjby the chemical reaction(s);dmj
dt is also named the
mass accumulation of speciesj. When there is no chemical reaction
inside this component,Njequals to zero[25,26].
When there is a steady flow of fluid in and out of a thermody-namic system (or component), from the first law of
thermodynam-ics, the equation can be derived as ([26]),
_
min hinþ
C2in
2 þZing
!
þQ_ þW_ ¼m_out houtþ C2out
2 þZoutg
!
ð2Þ
where the subscripts ‘‘in” and ‘‘out” represent the system inlet and
outlet respectively;Q_ is the rate of change of heat transferred;W_ is
the rate of change in energy transfer because of work done;hstands
for the specific enthalpy of unit mass of the fluid;Z is the height
above a datum level;Zg is the potential energy of unit mass of
the fluid;Cis the fluid velocity;C2
2is the kinetic energy of unit mass
of the fluid. In theoretical calculation, it is normally assumed that Zin¼Zout.
2.2. Modelling of compressors
FromFig. 2, the multi-stage air compression unit is formed by a
group of Low Pressure (LP) and High Pressure (HP) compressors. Based on the mass balance of the compression process, the input mass flow rate of the compressors equals to the corresponding out-put mass flow rate at its steady state. Based on the properties of incoming flow and a given outlet pressure, the isentropic compres-sion approach has been adopted to calculate the ideal mechanical power consumption. Then an isentropic efficiency has been consid-ered in the modelling to calibrate the ideal mechanical power to be close to the practical working conditions. The isentropic efficiency (
g
s) is defined by,g
s¼hout;shin
houthin ð
3Þ
wherehout;sis the specific enthalpy of working medium at the outlet
in the ideal isentropic change of state, while hout is the specific
enthalpy at the outlet in the actual change of state.hinis the specific
enthalpy at the inlet.
The ideal mechanical power consumption (W_c;s) for
compress-ing the fluid can be calculated by ([16,26]),
_
Wc;s¼m_c
D
hin!out;s¼m_cZ Tc;out;s
Tc;in
CpdT ð4Þ
wherem_cis the mass flow rate of the compressor;Cpis the specific
heat capacity at a constant pressure to the fluid working medium;
Tc;in and Tc;out;s represent the compressor inlet temperature and
the compressor outlet temperature in the ideal isentropic change
of state; Dhin!out;s is the ideal enthalpy change from the inlet to
the outlet of the compressor in the ideal isentropic change of state. If this enthalpy change is calculated as a function of pressure ratio,
from the ideal gas law (P
v
c¼const:andPv
¼RT) and the isentropiccompression characteristics, Eq.(5)can be derived ([15,26]),
D
hin!out;s¼c
c
1RTin
Pc;out;s Pc;in
c1
c 1
" #
ð5Þ
whereRis the universal gas constant;
c
is specific heat ratio;Pc;inandPc;out;s represent the compressor inlet pressure and the
com-pressor outlet pressure in the ideal isentropic change of state.
From the energy balance Eq. (2) and assuming
_
Q¼0; Zin¼Zout; Cin¼Cout([26]), Eq.(4)can be simplified to the
following equation in terms of compressing the air if the process in each compressor is considered over a limited temperature
change (DT473 K) and the dry air is used ([14,26–29]),
_
Wc;s¼m_cðhout;shinÞ ð6Þ
From Eqs.(3) and (6), the actual power consumed by the
com-pressor can be calculated by, _
Wc¼m_cðhout;shinÞ=
gs
;c ð7Þwhere
gs
;cis the isentropic efficiency to the compressor. Thus, thetotal actual mechanical power consumption used by compressors is,
_
Wc;total¼
X
c;num
jc¼1 _
Wc;jc ð8Þ
whereW_ c;jcstands for the actual power consumption by
[image:4.595.57.551.71.239.2]compres-sor jc; c;num is the number of the compressors. Applying the
isentropic compression concept, the temperature at the compressor
outlet can be calculated by ([14,26,29]),
Tc;outTc;in 1þ Pc;out
Pc;in
c1
c ð Þ
1
" #,
gs
;c( )
ð9Þ
wherePc;outrepresent the compressor outlet pressure.
2.3. Modelling of compressed air storage reservoirs
To the compressed air storage process, the inner wall of the air storage reservoir(s) has been chosen as the controlled volume boundary for thermodynamic process analysis. It is assumed that there is no air leakage through the wall, and the air storage process is considered to have a constant volume in this paper. Considering the engineering feasibility and the capital cost, the compressed air storage reservoir(s) is set to be non-adiabatic.
The mass balance to the air storage reservoir(s) is,
d
q
st dt ¼_
min;st=Vst¼
q
_in;stAin;stCin;st=Vst air compression processm_out;st=Vst¼
q
_out;stAout;stCout;st=Vst air expansion processð10Þ
where
q
stis the density of air inside the storage reservoir(s);Vst isthe controlled volume of the storage reservoir(s); the subscripts ‘‘in, st” and ‘‘out, st” represent the incoming and the outgoing air flows
of the storage reservoir(s);Ais the cross sectional area of the flow
pipe;Cis the air flow velocity.
From the first law of thermodynamics and Eq.(2), the following
equation holds:
dðmuÞ
dt ¼m_inhinm_outhoutþQ_ þW_ ð11Þ
wheredðmuÞ
dt is the rate of increase in internal energy of the air inside
the storage cavern. For the energy balance of compressed air storage
reservoir,W_ ¼0. Thus Eq.(11)can be decreased as ([27,28]),
dðmuÞ
dt ¼m_in;sthin;stm_out;sthout;st
1
stAwall;stðTstTwall;stÞ ð12Þwhere
1
stis the heat transfer coefficient between the stored air andthe reservoir wall;Awall;st is the area of heat transfer between the
reservoir wall and the stored air;TstandTwall;stare the air
temper-ature inside the reservoir and the cavern wall tempertemper-ature. From
the definition of enthalpy, we can have ([26,27]),
dðmuÞ
dt ¼
d½mðhPV=mÞ
dt ¼
dðmhÞ
dt PV_ PV_ ð13Þ
As the air storage is considered as a constant volume process, _
Vst¼0. From Eqs.(12) and (13), the following equation to the air
storage reservoir can be derived,
dðmsthstÞ
dt ¼P_stVstþm_in;sthin;stm_out;sthout;st
1
stAwall;stðTstTwall;stÞ ð14ÞExpanding the enthalpy to show its relationship with the con-centration of air, the following equation can be obtained ([27,30,31]),
dðmsthstÞ
dt ¼
dð½XairVsth^stÞ dt
¼ ½X_airVst^hstþV_st½Xairh^stþnstCp;air;molT_st ð15Þ
where the subscript ‘‘st” stands for the storage reservoir;½Xairis the
molar volumetric concentration of air;nis the number of moles of
air;^his the specific enthalpy of air on a molar basis;Cp;air;molis the
specific heat of air on a molar basis. From Eqs. (14) and (15),
consideringV_st¼0, the change rate of the air pressure in the
stor-age reservoir can be derived as,
_
Pst¼ ½X_airh^stþ
1
Vstð
nstCp;air;molT_stm_in;sthin;stþm_out;sthout;stÞ
þ
1
stAwall;st VstðTstTwall;stÞ ð16Þ
In Eq.(16), the values of the heat transfer coefficient (
1
st) andthe area of heat transfer (Awall;st) are difficult to estimate[28]. If
considering combining them together, the effective heat transfer
coefficient can be defined as
sst
;eff¼1stAwall;st
Vst . From the ideal gas
law andV_st¼0, the rate of change of air temperature in the storage
reservoir can be obtained,
_
Tst¼
1
mstRð
MairP_stVstm_stPstTstÞ ð17Þ
whereMairstands for the molar mass of air.
Considering the processes of air compression and air expansion happening at different time periods, the mass balance related to the incoming and the outgoing air flows of the storage reservoir (s) need to be considered,
_
min;sttcharging¼m_out;sttdischarging ð18Þ
wheretcharging andtdischargingstand for the charging time of A-CAES
(i.e., the time of air compression) and the discharging time of A-CAES (i.e., the time of air expansion). The charging–discharging time ratio equals totcharging=tdischarging.
2.4. Modelling of turbines
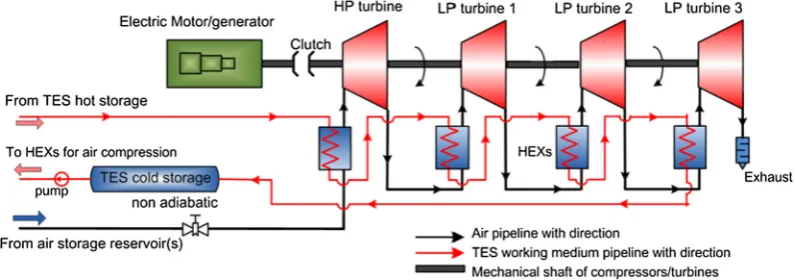
Multi-stage air expansion unit in an A-CAES system consists of a
group of HP and LP turbines (Fig. 2) and there is no fossil fuel
com-bustion in the A-CAES air expansion process. With pressure decreasing of the incoming flow, the turbines release the com-pressed air energy to produce mechanical power. For the isentropic expansion method, with a given outlet pressure, the turbine mod-ule determines the thermodynamic state of the outgoing flow and the produced power. Similar to modelling of compressor, the tur-bine isentropic efficiency is also considered. For mass balance, the input mass flow rate of each turbine equals to the correspond-ing output mass flow rate, i.e.,m_t;in¼m_t;out.
The ideal mechanical power produced (W_t;s), the actual
mechanical power produced (W_t) and the total actual power
pro-duced (W_t;total) are described below,
_
Wt;s¼m_tðhinhout;sÞ ð19Þ
_
Wt¼
gs
;tm_tðhinhout;sÞ ð20Þ_
Wt;total¼
X
t;num
jt¼1 _
Wt;jt ð21Þ
where
g
s;tis the isentropic efficiency of the turbine;m_tis the masschange rate inside the turbine,m_t¼m_t;in¼m_t;out;W_t;jtis the actual
produced mechanical power by Turbinejt.t;num is the number of
the turbines.
2.5. Modelling of thermal energy storage process
of HEX should be adequately sized to ensure optimal heat energy extraction during air compression and maximum heat energy recovery during air expansion. With low temperature TES, water in liquid phase is chosen as the working medium in the TES for heat transfer, because of its high specific heat capacity bringing the ability of storing more heat energy within a low temperature range. In addition, the pressure drop caused by the HEXs need to be considered.
Considering lowing capital and maintenance costs, the ‘‘hot” heat storage reservoir is designed to be adiabatic while the ‘‘cold”
heat storage reservoir is set to be non-adiabatic (Fig. 2). It is
assumed that, the water state changes inside the two TES storage reservoirs are no any leakage; the temperature of the ‘‘cold” heat storage reservoir equals to the temperature of environment at the static state. The mass balance to the water streams of the two TES storage reservoirs is described by,
_
min;hot;totaltcharging¼m_in;cold;totaltdischarging ð22Þ
wherem_in;hot;totalandm_in;cold;totalstand for the total coming mass flow
rates to the ‘‘hot” heat storage reservoir during the charging time and to the ‘‘cold” heat storage reservoir during the discharging time respectively.
The counter flow design has been chosen for the HEXs to gain optimised heat transfer between the streams of compressed air and water, because of its high capability to transfer the heat energy compared to the parallel flow design. To modelling of the heat transfer and the two media state change inside the HEXs, the Num-ber of Transfer Units method has been used, which is described below.
From[15,29], the heat transfer of one HEX can be determined
by its effectiveness (
e
) which can be defined by,e
¼ eC_jToutTinj_ e
CminðTin;hotTin;coldÞ
ð23Þ
whereeC_ is the thermal capacity rate of the flow with the mass flow
ratem_ entering atToutand exiting atTout,Ce_ ¼mC_ P;eC_minis the
min-imum among the thermal capacity rates of the two flows to the
HEX, eC_min¼minðm_flow1CP;flow1;m_flow2CP;flow2Þ; Tin;hot and Tin;cold are
the temperatures of ‘‘hot” fluid input and ‘‘cold” fluid input to the HEX respectively.
For theith stage of air compression (or air expansion) in the
A-CAES system, the inlet temperature of compressor (Tc;in;i) (or
tur-bine (Tt;in;i)) can be calculated by the outlet temperature of the
ði1Þth stage of air compression (Tc;out;i1) (or air expansion
(Tt;out;i1)) by the given effectiveness (
e
) of the interposedði1Þth HEX which is located between the ith stage and the
ði1Þth stage of air compression (or air expansion). From Eq.
(23), the below equation can be derived,
Tc;in;i¼Tc;out;i1
e
_
e Cmin
_
mhex;air;i1Cp;airð
Tc;out;i1Twt;cold;i1Þ air compression process ð24Þ
Tt;in;i¼Tt;out;i1þ
e
_
e Cmin
_
mhex;air;i1Cp;airð
Twt;hot;i1Tt;out;i1Þ air expansion proexcess ð25Þ
where m_hex;air;i1 is the air mass flow rate of the ði1Þth heat
exchanger;Twt;cold;i1is the temperature of cold water at the inlet
of theði1Þth heat exchanger in air compression;Twt;hot;i1is the
temperature of hot water at the inlet of theði1Þth heat exchanger
in air expansion.
If considering counter flow, the effectiveness (
e
) can bedescribed as ([29]),
e
¼11v
expexp½½NTUNTUð1ð1v
Þv
Þ ð26Þwhere
NTU¼ _UA
e
Cmin
ð27Þ
v
¼eC_min_ e
Cmax
ð28Þ
To Eq.(27), the number of heat transfer units (NTU) can be
cal-culated by the unit overall thermal conductance (U) times the
effective heat transfer area (A) divided by the minimum thermal
capacity rate (Ce_min).UAis the heat transfer rate between two flows
of the heat exchanger. To Eq. (28), eC_max¼maxðm_flow1CP;flow1;
_
mflow2CP;flow2Þ, and when eC_min¼Ce_max, for counter flow,
e
¼1NTUþNTU.The detail of the calculation of NTU is described in[14].
2.6. Modelling of mixers, splitters, water pumps and motor/generator units
The stream with a given working medium through a mixer sat-isfies the mass and energy balances assuming no energy exchange and losses. The relevant equations can be described as,
X
mix;num
jm _
mmixer;in;jm ¼m_mixer;out ð29Þ
X
mix;num
jm _
mmixer;in;jmhmixer;in;jm ¼m_mixer;outhmixer;out ð30Þ
wherem_mixer;in;iandm_mixer;outstand for the mass flow rate of thejmth
incoming anabranch of the mixer and the outgoing mass flow rate
of the mixer respectively; hmixer;in;jm and hmixer;out represents the
specific enthalpy of thejmth incoming anabranch and the specific
enthalpy of the outgoing flow of the mixer individually.
The splitter is used for splitting one stream into two or multi
anabranches. The difference factor (k) to thejsth outlet of splitter
can be defined as,
kjs¼ _
msplitter;out;js _
msplitter;in ð
31Þ
wherem_splitter;inandm_splitter;out;jsare the mass flow rates of incoming
stream and thejsth outgoing anabranch of the mixer respectively.
Assuming there is no energy exchange and losses during the split-ting process, the below equations can be obtained,
_
msplitter;in¼
X
split;num
js _
msplitter;out;js¼m_splitter;in X
split;num
js
kjs ð32Þ
hsplitter;out;js¼hsplitter;in ð33Þ wherehsplitter;inandhsplitter;out;jsrepresent the specific enthalpy of the
incoming stream and the specific enthalpy of thejsth outgoing
ana-branch respectively.
Two water pumps have been used in the water flow route for increasing the water saturation temperature and keeping the
water circulation (refer toFig. 2). The pump power (W_p) can be
cal-culated as,
_
Wp¼
_
mpumpðPpump;outPpump;inÞ
q
waterg
pumpwhere m_pump is the mass flow rate of water via the pump;
Ppump;out;Ppump;in stand for water pressures at the inlet and outlet
of pump respectively;
q
wateris the density of water;g
pumprepresentspump efficiency.
Choosing the constants for the electrical motor efficiency
g
mand the electrical generator efficiency
g
g, the consumed electricitypower during the air compression (W_con;elec) and the generated
electricity power during the air expansion (W_gen;elec) can be
calcu-lated as,
_
Wcon;elec¼
1
gm
X
c;num
jc¼1 _
Wc;jcþW_p;coldþW_p;hot ð35Þ
_
Wgen;elec¼
g
gX
t;num
jt¼1 _
Wt;jt ð36Þ
where W_p;cold and W_p;hot are the consumed powers by the two
pumps located at the outlets of the ‘‘cold” heat storage reservoir
and the ‘‘hot” heat storage reservoir respectively (Fig. 2).
With all the subsystem models presented above, the overall A-CAES system mathematical model is built by integration of these
models.Fig. 3shows the block diagram of the whole A-CAES
sys-tem model with implemented sub model equations. All the subsys-tems and whole system models are implemented in Matlab/ Simulink and Simulink based Thermolib toolbox environment for the simulation study.
3. Optimisation study and efficiency analysis of an A-CAES system
The whole system optimisation starts from a study of the parameters and the associated performance of Huntorf CAES plant. This helps the initial parameter settings for the A-CAES system
model described in Section2.
3.1. Study of Huntorf CAES plant
Huntorf CAES plant has/had been providing comprehensive ser-vices to the local power network, including emergency reserve, peak shaving, load following, compensation of intermittent wind
power generation in North Germany[8,11,28]. The plant employs
two salt dome caverns to store compressed air and runs in a daily cycle with about eight hours for air compression and two hours of
air expansion operation[6,8]. The plant has consistently shown
excellent performance over 30 years with 99% starting reliability
[4,8]. The overall configuration layout of the Huntorf CAES plant
can be found in[32]. The important specifications of the Huntorf
plant are listed inTable 1. Actual operating data to the power
pro-duction and the air pressures inside the caverns during a single day
was reported in[28,32]. The data could be different in the
publica-tions because the Huntorf plant had been reformed or updated after its commercial operation from 1978.
The study of the Huntorf test data reported in[28,32]revealed
that a constant effective heat transfer coefficient assumption
can-not be used as described in Eq.(16)to reproduce the observed
cav-ern behaviours. The heat transfer of the cavcav-ern is affected by the flow velocity which links to the charging and discharging flow characteristics of the cavern, so it can be considered as a combina-tion of a natural conveccombina-tion (the heat transfer in the absence of net flow into/out of the cavern) and a forced convection (the heat transfer induced by the incoming and outgoing air flows). Thus,
the effective heat transfer coefficient (
sst
;eff) can be described as([28,32,33]),
s
st;eff¼~aþ~bm_in;stm_out;st 0:8ð37Þ
where the constant termsa~and~bstand for the effective heat
trans-fer coefficient caused by the natural convection and the forced
con-vection respectively,~a¼0:2356 andb~¼0:0149 ([28]). Eq.(37)was
validated by comparison to the Huntorf plant test data, as shown in
[28]. Thus this approach is chosen and used in the modelling of the
A-CAES system and it is assumed that the system employs under-ground salt dome caverns as compressed air storage reservoirs.
3.2. Parameter optimisation analysis of A-CAES systems
In this section, the study on the influences of parameter changes to the system performance and efficiencies is carried out. Heat
energy recycle efficiency (
g
heat;recycle) and cycle efficiency of theoverall A-CAES system (
gcycle
) are considered, which are defined [image:7.595.61.522.526.739.2]below,
g
heat;recycle¼ Eout;heatEin;heat ¼
tdischarging
Phex;ex;num iex¼1 W_hex;ex;iex tcharging
Phex;co;num
ico¼1 W_hex;co;ico
ð38Þ
g
cycle¼ Eout;elecEin;elec
¼ tdischarging
gg
Pt;num jt¼1
_
Wt;jt
1
gm Pc;num
jc¼1 W_ c;jcþW_p;cold
tchargingþW_p;hottdischarging
ð39Þ
whereEin;heat andEout;heatrepresent the heat energy obtained from
the air compression process and the heat energy provided to the
air expansion process; Ein;elec, Eout;elec stand for the whole system
input electricity energy and the whole system output electricity
energy; W_hex;co;ico is the rate of heat energy taken from the icoth
HEX in the compression process;W_ hex;ex;iexis the rate of heat energy
extracted from theiexth HEX in the expansion process; the
[image:8.595.41.295.80.368.2] [image:8.595.41.294.84.373.2]sub-scripts hex, co, num and hex, ex, num refer to the numbers of the HEXs in compression and expansion processes respectively.
Table 2lists the base values of the parameters used in the
A-CAES system model. Table 3 presents the selected parameters
and their ranges of variations for conducting parametric study.
With the whole A-CAES system configuration shown inFig. 2, the
simulation study for a number of parametric setting cases are per-formed, in which the cycle efficiency and the heat energy recycle efficiency were evaluated. Following the parametric study, a first-order sensitivity analysis was performed to analyse the impact of the parameters on the cycle efficiency of the overall system.
With the base values of parameters listed inTable 2, the
simu-lation results show that, the overall system cycle efficiency is around 53.8% and the heat energy recycle efficiency is around 45.8%; the maximum air temperature at the outlet of the last com-pression stage is at 436 K and the lowest air temperature at the outlet of the last expansion stage is at 274 K; the water tempera-tures into the ‘‘hot” and ‘‘cold” storage reservoirs are at 382 K and 342 K respectively. These simulated results for temperatures are within the reasonable working ranges of the industrial facilities for air compression/expansion and TES with using liquid water as
working medium[14,26,34,35]. However, it can be seen that the
water temperature into the ‘‘cold” heat storage reservoir is higher compared to the ambient temperature and thus the stored heat energy from the ‘‘hot” heat storage reservoir has not been well uti-lized. This has become one of the challenges in development of A-CAES systems, which was encountered at the demonstration facility developed by the Institute of Engineering Thermophysics, Chinese Academy of Science. In the simulation study, it is assumed
that the pressure ratios of the multi-stage air compression and expansion processes are evenly distributed for simplification. In practice, uneven distribution pressure ratios are normally used and this could lead to higher efficiency; some studies show that, if considering the A-CAES operating at a constant pressure, the even distribution pressure ratios could be approximately
consid-ered as the optimal pressure ratio at certain conditions ([34]).
As to the parameter optimisation analysis, the paper studies which the system key parameters are and how they influence the heat energy recycle efficiency and the cycle efficiency. Following
the parameter ranges listed inTable 3, with the system
configura-tion shown inFig. 2, the simulation study is conducted and the
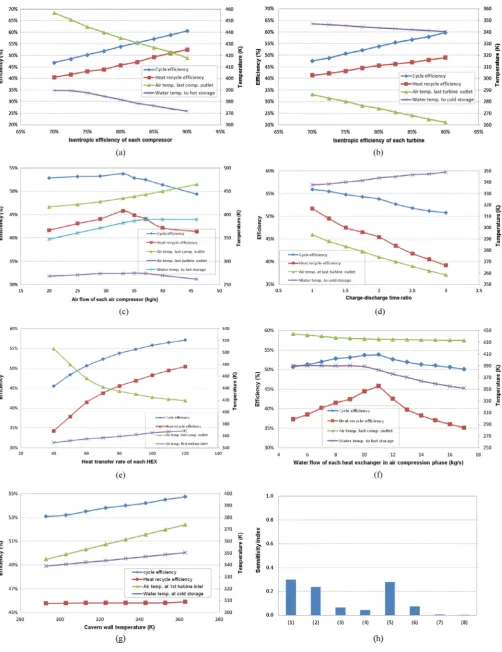
simulation results are shown inFig. 4. FromFig. 4(a) and (b), it
can be seen that the higher isentropic efficiencies of air compres-sors and turbines are, the higher cycle efficiencies and heat energy recycle efficiencies will be achieved. The maximum permissible working air temperature to the compressor outlet is normally
around 448–453 K[35]. As shown inFig. 4(a), when the isentropic
efficiency of the air compressor is reduced to around 72%, the air temperature at the last stage outlet reaches the maximum temper-ature boundary and the status of water to the ‘‘hot” heat storage reservoir gets into the saturation condition, that is, the water starts being transformed into vapour. The water status changes could result in difficulties to practical system operations. From the sim-ulation results, the variations of isentropic efficiencies have more obvious influences on compressors, than air turbines. The perfor-mance (e.g., isentropic efficiency) of air compressors can directly
Table 1
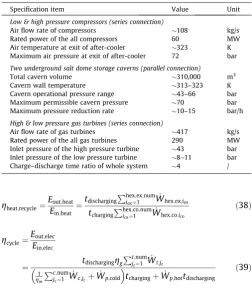
The specifications of the Huntorf plant for guiding the A-CAES system[4,8,28,32].
Specification item Value Unit
Low & high pressure compressors (series connection)
Air flow rate of compressors 108 kg/s Rated power of the all compressors 60 MW Air temperature at exit of after-cooler 323 K Maximum air pressure at exit of after-cooler 72 bar
Two underground salt dome storage caverns (parallel connection)
Total cavern volume 310,000 m3
Cavern wall temperature 313–323 K Cavern operational pressure range 43–66 bar Maximum permissible cavern pressure 70 bar Maximum pressure reduction rate 10–15 bar/h
High & low pressure gas turbines (series connection)
[image:8.595.310.561.85.297.2]Air flow rate of gas turbines 417 kg/s Rated power of the all gas turbines 290 MW Inlet pressure of the high pressure turbine 43 bar Inlet pressure of the low pressure turbine 8–11 bar Charge–discharge time ratio of whole system 4 /
Table 2
Base values of parameters of the A-CAES system model described in Section2.
Parameters Value Unit
Ambient (environment) temperature 293.15 K Ambient (environment) pressure 1.013 bar Charge–discharge time ratio 2 / Stage numbers of air compression & expansion 4 stages to the both
High & low pressure air compressors (series connection)
Rated power of the all compressors 16.6 MW Air flow rate of compressors 33 kg/s Isentropic efficiency to compressors 80 % Pressure ratio of each stage 2.75 /
High & low pressure air turbines (series connection)
Rated power of the all air turbines 17.8 MW Air flow rate of air turbines 66 kg/s Isentropic efficiency to air turbines 80 % Expansion ratio of each stage 2.55 /
TES subsystem & cavern (heat exchangers parallel connection)
[image:8.595.312.562.336.450.2]Heat transfer rate of each HEX 80 kW/K Water flow of each HEX in air compression 11 kg/s Water flow of each HEX in air expansion 22 kg/s Air pressure loss of heat exchanger 1.5 % Cavern wall temperature 323 K Maximum operational cavern pressure 55 bar
Table 3
Optimal parameter study of the A-CAES system model described in Section2.
No. Parameters Variation values
Variation range (1) Isentropic efficiency to each
compressor
70–90% 12.5%
(2) Isentropic efficiency to each turbine 70–90% 12.5% (3) Air flow rate of each compressor 20–46 kg/s 40% (4) Charge–discharge time ratio 1–3 50.0% (5) Heat transfer rate of each HEX 40–120 kW/K 50.0% (6) Water flow rate of HEX in air
compression
5–17 kg/s 55%
affect the adiabatic ‘‘hot” heat storage water temperature and, in turn, the stored ‘‘hot” heat energy. Due to the non-adiabatic ‘‘cold” heat storage receiver in use, the influence on the performance of air turbines is relatively small to the overall system.
The simulation results of the variation of the cycle efficiency and the heat energy recycle efficiency with respect to the air flow of each air compressor and the water flow of each HEX in air
compression mode are shown inFig. 4(c) and (f). Based on the
mass balance of working mediums, both the air and water flows through the turbines and the HEXs in the air expansion process are varied. The peak values of the efficiencies are found in these
two parametric setting cases (refer toFig. 4(c) and (f)). The
simu-lation results indicate the importance of parametric study to A-CAES.
Fig. 4(d) shows how the cycle efficiency and the heat energy
recycle efficiency change as the charge–discharge time ratio varies. For instance, when the charge–discharge time ratio increases, assuming there is no change to the air and water flows through the compressors and the HEXs installed in the air compression sys-tem, air and water flow into the air expansion mode will also increase because of the mass balance of working mediums. In this
[image:10.595.57.552.68.209.2]situation, the two efficiencies decrease as shown inFig. 4(d). It is
[image:10.595.57.553.243.414.2]Fig. 5.A-CAES efficiencies as a function of air compression and expansion stage numbers.
[image:10.595.102.500.463.603.2]Fig. 6.A-CAES efficiencies as a function of both stage numbers of air compression & expansion (with different isentropic efficiencies of compressors/turbines and heat transfer rates of HEXs).
also noticed that, with the charge–discharge time ratio increase, sometime the air temperature at the last stage of expansion can decrease to around 260 K and even lower, which may bring diffi-culties in practice regarding air exhausting to the environment.
FromFig. 4(c), (d) and (f), it can be seen that, if one parameter is
adjusted, other system parameters needs to be adjusted according to the energy/mass balance and other fundamentals of thermody-namics. This is mainly due to the system sub process interactions and coupling with different components.
Fig. 4(e) illustrates the variation of the cycle and the heat
energy recycle efficiencies while the heat transfer rate of each HEX varies. The heat transfer rate can heavily affect the perfor-mance of the HEXs, the heat energy extracted from air compression
and the heat energy used in air expansion. FromFig. 4(e), it is seen
that the heat energy recycle efficiency has been changed distinctly. It is also shown that, if the heat transfer rate of HEXs reduces to 60 kW/K or lower, the air temperature at the last stage compressor outlet will excess the normal allowed temperature boundary
(around 448–453 K)[35]. This means that the normal system
oper-ation requirements cannot be met in this situoper-ation. From the sim-ulation study, it is also found that the overall heat transfer effect from the HEXs in the air expansion process can regulate the water temperature into the ‘‘cold” heat storage reservoir. Therefore, improving the heat transfer effect of HEXs which are located in the air expansion process can achieve lowering water temperature into the ‘‘cold” heat storage reservoir and in turn to improve the system efficiencies.
Fig. 4(g) indicates the contribution from the cavern wall
tem-perature to the overall system cycle efficiency and the heat energy
recycle efficiency. InFig. 4(a), although the air temperature at the
1st stage turbine (see HP turbine inFig. 1) inlet increases distinctly,
the efficiencies increased only by less than 2%. Similarly, from the simulation study, within a certain variation range of air pressure
loss of each HEX (0.5–2.5%,Table 3), the cycle efficiency and the
heat energy recycle efficiency also change mildly (less than 2%). Among all cases under appropriate assumptions, it can be found that an increase in the isentropic efficiencies of air compressors/-turbines and the heat transfer rate of HEXs lead to a higher cycle efficiency and higher heat energy recycle efficiency obviously; an increase in the charge–discharge time ratio results in decreases of the efficiencies; there are the optimum values for the air flow of each compressor and the water flow of each HEX in air compression.
The definition of sensitivity analysis is described as ‘‘the study of how uncertainty in the output of a model can be apportioned
to different sources of uncertainty in the model”[36,37]. The
anal-ysis approach used in the paper is a variance-based measurement, which has been used for the sensitivity analysis of simulation model for a long time and the method has been improved by
Sal-telli et al.[37]. There are a number of software tools developed
for this, such as Simlab. The first-order sensitivity index eS~i of
parameterseX~i on a generic modelYe; Ye¼fðXe1;eX2;. . .;Xe~kÞcan be
defined as ([36,37]),
e
S~i¼ Ve
Xið
Ee X~i
ðeYjeX~iÞÞ
VðYeÞ ð40Þ
whereVðeYÞðVðYeÞ ¼
r
2eYÞindicates the variance of
e
Y;Ve X~i
ðEe X~i
ðYejXe~iÞÞ
represents the conditional variance, also named the first-order effect ofXe~ionYe;VeX
~i
ðEe X~i
ðYejeX~iÞÞ6VðYeÞand thus the value of
sensi-tivity index (eS~i) is in the range of 0–1. The details for sensitivity
analysis can be found in[36,37].Fig. 4(h) presents the sensitivity
analysis results of cycle efficiency to the concerned system
param-eters. InFig. 4(h), the sensitivities of concerned parameters are
rep-resented by their sensitivity indexes. A higher index value means a higher sensitiveness and higher importance of corresponding
parameters to the cycle efficiency. FromFig. 4(h), the isentropic
[image:11.595.89.487.64.274.2]effi-ciencies of compressors/turbines and the heat transfer rate of HEXs are the most sensitive parameters in the A-CAES system model
[image:11.595.32.286.339.434.2]Fig. 8.Schematic diagram of an A-CAES air expansion with recuperators for exhaust heat recycle.
Table 4
An example of air compression process with pressure-based controlled air flow routes.
Air pressure inside the storage cavern
Description of the air flow route from ambient to the air reservoir
1 bar to2.75 bar Six compressors in parallel connection to the whole air flow route
2.75 bar to7.56 bar Three sets of compressors in parallel (each set two compressors)
7.56 bar to20.8 bar Two sets of compressors in parallel (each set three compressors,Fig. 9)
described in Section2; the air/water flow rates and the charge–dis-charge time ratio show moderate sensitiveness; within a certain range the variations of the cavern wall temperature and the pressure loss of HEXs are less effective to the A-CAES system model.
3.3. Study of different A-CAES system configurations
This section presents the study on how different configurations of A-CAES systems contribute to the improvement of the system cycle efficiency and the heat energy recycle efficiency. From the study, increasing the numbers of air compression and expansion
stages is an effective way for improving the efficiencies. Fig. 5
shows the simulation results of changing the numbers of air com-pression and expansion stages respectively. In this study, assuming the final compressed air pressure into the storage reservoir keep-ing constant, the compression ratio of compressors need to be
modified based on the number of stages. ToFig. 5(a) and (b), the
cycle efficiency increase to above 55%. InFig. 5(b), the heat energy
recycle efficiency can reach 54% and the water temperature into the ‘‘cold” heat storage reservoir can reduce to around 330 K. From the simulation study, fewer numbers of air compression and expansion stages mean harsh working conditions. For instance, if the number of stages of air compression changes to two or three, the air temperature at the last compressor outlet will exceed the
maximum permissible temperature, 448–453 K (Fig. 5(a)).
From the above, the isentropic efficiencies of compressors/tur-bines and the heat transfer rate of HEXs can affect the system
effi-ciencies distinctly. Fig. 6 presents the A-CAES efficiency as a
function of both stage numbers of air compression and expansion with different isentropic efficiencies of compressors and turbines as well as heat transfer rates of the HEXs. The system cycle effi-ciency and the heat energy recycle effieffi-ciency can reach up to around 68% and 60% respectively. Thus, the system efficiencies studied in the paper can be much improved. From the simulation results, the water temperature into the ‘‘cold” storage can drop to around 325 K with eight stages of air compression and expan-sion and 120 kW/K heat transfer rate of HEXs. It should be men-tioned that higher numbers of stages of air compression and expansion normally means more complexity of the whole system, which can affect the system reliability and stability in practice.
Based on the parametric study (Section3.2), it can be seen that
the water temperature into the ‘‘cold” heat storage reservoir is
normally above 335 K and the available heat energy contained by water is lost. To improve the system efficiency, two new system configurations are analysed to explore possible solutions. Their
schematic diagrams are shown inFigs. 7 and 8. For both of the
sys-tem configurations, it is assumed that the layout and the associated working condition of air compression mode remain unchanged for
all the analyses. Compared with the air expansion layout inFig. 2,
four HEXs in Fig. 7 are changed to series connection. Thus, the
water flow rate via each HEX increases three times based on the mass balance principle of the working medium. The simulation
study reveals that, with the values of parameters listed inTable 2,
the water temperature into the ‘‘cold” heat storage reservoir increases by 1.4 K and the power output of all turbines decrease 0.11 MW. Thus, the system is less efficient. The key feature of the
system configuration illustrated inFig. 8is to introduce extra
recu-perators on the by-passes of water flow routes to reuse the exhaust heat energy from the water loop. The by-pass starts from the HEX outlets and the recuperator heats the compressed air before it goes into the next stage HEX. The heat transfer rate of recuperators is assumed to be the same as that of HEXs. From the comparison of
simulation results, the system configuration shown inFig. 8can
reduce the water temperature into the cold storage by 1.6–6.0 K with consideration of the cases of one or multiple recuperators installed. The heat energy recycle efficiency and the cycle effi-ciency can be improved by around 6.6% and 2.6% separately. If a higher heat transfer rate of HEXs and recuperators (e.g. 120 kW/K) is chosen, the turbine’s power output and the stored heat energy utilization will increase further. However, this configuration design will increase the capital cost as recuperators are adopted.
From the parametric study, it is concluded that the charging– discharging time ratio can affect the overall system efficiencies. Thus, to develop controllable air flow routes to A-CAES for varying charge/discharge time is a possible approach to improve the sys-tem efficiencies. For instance, to an initial air compression process, assuming that the compressed air pressure inside the cavern needs to increase from 1 to 57.2 bar and there are six compressors with
even compression ratios of 2.75,Table 4shows a compression
pro-cess in this situation with the controllable air flow routes.Fig. 9
illustrates an A-CAES air compression mode with two sets of
com-pressors in parallel (the 3rd sequence inTable 4). The whole
pro-cess can be completed via controlled pneumatic valves. It can be seen that, by the approach of controlling air flow routes, the charg-ing time of A-CAES can be varied compared to the system layout in
Electric motor/generator
Atmospheric air inlet
HEX2 HEX1
TES hot storage
Pump adiabatic
Clutch1 HP comp.1 LP comp.1
Air pipeline with direction
TES working medium pipeline with direction Mechanical shaft of compressors/turbines
HEX4 HEX5
Atmospheric air inlet
HP comp.2
Clutch 2
HEX3 LP comp.2 HP comp.3
HP comp.4
HEX6
Valve
To air storage reservoir
[image:12.595.74.525.66.265.2]To HEXs for air expansion From TES cold storage
Fig. 2, which is caused by changes of the air flow rates from ambi-ent to the compressed air storage reservoir. Correspondingly, the discharging time of air expansion can also be modified for improv-ing system efficiency target.
4. Concluding remark
The paper presents the mathematical models of an A-CAES system components and developed a new whole system model of A-CAES with low temperature thermal storage. The model is implemented in Matab/Simulink software environment. With the system model developed in the paper, the system energy efficiency is analysed, especially, a comprehensive study is performed on how much the system parameter variations affect the system over-all efficiency. From the analysis, it is found that the isentropic effi-ciencies of compressors and turbines and the heat transfer rates of HEXs are the key parameters to give the dominant influences on the system efficiency. In addition to system parameters, the system configuration can also lead to system efficiency improvement. From the study, multi-stage compression and expansion can improve system efficiency but it does not mean the system can have unlimited number of stages. Regulating the A-CAES charging time and discharging time via flow control can also lead to differ-ent system efficiencies. These are considered as the important factors for efficient system design in practice.
The results from optimal design study of low temperature A-CAES systems show that the system cycle efficiency and the heat energy recycle efficiency can potentially reach to around 68% and 60% respectively. The results confirm that the current relative low efficiency of CAES systems can be improved to address the main concern of CAES system design and deployment.
Acknowledgements
The authors would like to thank the research grant support from Engineering and Physical Sciences Research Council, UK (EP/ K002228/1). Also, the authors want to give their thanks to the
sup-port from China National Basic Research Program 973
(2015CB251301) to enable the collaborative research between the UK and China researchers.
References
[1] Skea J, Nishioka S, Policies and practices for a low-carbon society. In: Strachan N, Foxon T, Fujino TJ, editors. Modelling long-term scenarios for low carbon societies. Climate Policy, vol. 8. UK: Taylor & Francis; 2008. p. 5–16. [2]Beaudin M, Zareipour H, Schellenberglabe A, Rosehart W. Energy storage for
mitigating the variability of renewable electricity sources: an updated review. Energy Sustain Dev 2010;14:302–14.
[3]Zhao H, Wu Q, Hu S, Xu H, Rasmussen CN. Review of energy storage system for wind power integration support. Appl Energy 2015;137:545–53.
[4]Luo X, Wang J, Dooner M, Clarke J. Overview of current development in electrical energy storage technologies and the application potential in power system operation. Appl Energy 2015;137:511–36.
[5] Technology roadmap: energy storage. Prepared by international energy agency (IEA). Technical report. Published 19 March 2014. <http://www.iea.org/ publications/freepublications/publication/technology-roadmap-energy-storage-.html> [accessed 07.12.14].
[6]Chen H, Cong TN, Yang W, Tan C, Li Y, Ding Y. Progress in electrical energy storage system: a critical review. Prog Nat Sci 2009;19:291–312.
[7] Rastler D. Electricity energy storage technology options: a white paper primer on applications, costs, and options. Electric power research institute (EPRI). Technical report. Published December 2010.
[8]Succar S, Williams RH, editors. Compressed air energy storage: theory, resources, and applications for wind power. Princeton Environmental Institute. Energy Anal Group; 2008.
[9]Samir S. In: Levine JG, editor. Large energy storage systems handbook. CRC Press; 2011. p. 112–52.
[10] ADELE – adiabatic compressed air energy storage for electricity supply. RWE Power. Report. Published January 2010. <http://www.rwe.com/web/ cms/mediablob/en/391748/data/364260/1/rwe-power-ag/innovations/ Brochure-ADELE.pdf> [accessed 07.12.14].
[11]Succar S, Denkenberger DC, Williams RH. Optimization of specific rating for wind turbine arrays coupled to compressed air energy storage. Appl Energy 2012;96:222–34.
[12]Liu W, Li Q, Liang F, Liu L, Xu G, Yang Y. Performance analysis of a coal-fired external combustion compressed air energy storage system. Entropy 2014;16:5935–53.
[13] Nakhamkin M, Chiruvolu M, Daniel C. Available compressed air energy storage (CAES) plant concepts. In: The Proceedings of Power-Gen Conference, December 2007.
[14]Grazzini G, Milazzo A. A thermodynamic analysis of multistage adiabatic CAES. Proc IEEE 2012;100:461–72.
[15]Hartmann N, Vöhringer O, Kruck C, Eltrop L. Simulation and analysis of different adiabatic compressed air energy storage plant configurations. Appl Energy 2012;93:541–8.
[16]Zhao P, Dai Y, Wang J. Design and thermodynamic analysis of a hybrid energy storage system based on A-CAES (adiabatic compressed air energy storage) and FESS (flywheel energy storage system) for wind power application. Energy 2014;70:674–84.
[17]Wolf D, Budt M. LTA-CAES – a low-temperature approach to adiabatic compressed air energy storage. Appl Energy 2014;125:158–64.
[18]Dreißigacker V, Zunft S, Müller-Steinhagen H. A thermo-mechanical model of packed-bed storage and experimental validation. Appl Energy 2013;111:1120–5.
[19] Marquardt R, Zunft S, et al. AA-CAES – opportunities and challenges of advanced adiabatic compressed-air energy storage technology as a balancing tool in interconnected grids. In: Proceedings of 40 Kraftwerkstechnisches Kolloquium, Dresden, Germany, October 2008.
[20]Buffa F, Kemble S, Manfrida G, Milazzo A. Exergy and exergoeconomic model of a ground-based CAES plant for peak-load energy production. Energies 2013;6:1050–67.
[21]Pickard WF, Hansing NJ, Shen AQ. Can large-scale advanced-adiabatic compressed air energy storage be justified economically in an age of sustainable energy? J Renew Sustain Energy 2009;1:033102.
[22]Zhang Y, Yang K, Li X, Xu J. The thermodynamic effect of thermal energy storage on compressed air energy storage system. Renew Energy 2013;50:227–35.
[23] Advanced compressed air energy storage won the first prize of Beijing science and technology. n.d. <http://www.escn.com.cn/news/show-222217.html> [accessed 07.04.15].
[24] LightSail Energy Ltd. We store energy in compressed air. n.d. <http:// www.lightsail.com/> [accessed 12.06.14].
[25] Department of civil & environmental engineering, Michigan Technological University. Mass and energy balances. n.d. <http://www.cee.mtu.edu/ ~reh/courses/ce251/251_notes_dir/node3.html> [accessed 12.04.15]. [26]Eastop TD, Mcconkey A. Applied thermodynamics for engineering
technologists. 5th ed. New York, U.S.: Longman Scientific & Technical and John Wiley & Sons Inc; 1993.
[27]Luo X, Wang J, Sun H, Derby JW, Mangan SJ. Study of a new strategy for pneumatic actuator system energy efficiency improvement via the scroll expander technology. IEEE/ASME Trans Mechatronics 2013;18:1508–18. [28]Raju M, Kumar Khaitan S. Modeling and simulation of compressed air storage
in caverns: a case study of the Huntorf plant. Appl Energy 2012;89:474–81. [29] Thermolib user manual: thermodynamic systems library, Release 5.2., Eutech
Scientific Engineering GmbH, January 2013.
[30]Wang J, Luo X, Yang L, Shpanin LM, Jia N, Mangan S, et al. Mathematical modeling study of scroll air motors and energy efficiency analysis—Part II. IEEE/ASME Trans Mechatronics 2011;16:122–32.
[31] Luo X, Sun H, Wang J. An energy efficient pneumatic-electrical system and control strategy development. In: Proc. 2011 Am. Control Conf., IEEE; 2011. p. 4743–8.
[32] Crotogino F, Mohmeyer K, Scharf R. Huntorf CAES: more than 20 years of successful operation. In: Proc of SMRI spring meeting, Orlando, Florida, USA, 15–18, April 2001.
[33]Winterton RHS. Where did the Dittus and Boelter equation come from? Int J Heat Mass Transfer 1998;41:809–10.
[34]Guo H, Xu J, Chen H, Tan Q. Analysis of the efficiency of a AA-CAES system operating at a constant pressure. Chin J Eng Therm Energy Power 2013;28:540–6.
[35] Aftercoolers: why aftercoolering required? eCompressedair Ltd. n.d. <http:// www.ecompressedair.com/library-pages/ aftercoolers.aspx> [accessed 07.02.15].
[36]Saltelli A, Tarantola S, Campolongo F, Ratto M. Sensitivity analysis in practice: a guide to assessing scientific models. John Wiley & Sons, Ltd.; 2004. [37]Saltelli A, Ratto M, Andres T, Campolongo F, Cariboni J, Gatelli D, et al. Global
![Fig. 1. Comparison of various EES technologies in cycle efficiencies [4]](https://thumb-us.123doks.com/thumbv2/123dok_us/9475338.453863/3.595.82.506.67.239/fig-comparison-various-ees-technologies-cycle-efciencies.webp)