Original citation:
Wang, Lin, Kunc, Martin and Baic, Si-jun. (2017) Realizing value from project implementation under uncertainty : an exploratory study using system dynamics. International Journal of Project Management.
Permanent WRAP URL:
http://wrap.warwick.ac.uk/85745 Copyright and reuse:
The Warwick Research Archive Portal (WRAP) makes this work by researchers of the University of Warwick available open access under the following conditions. Copyright © and all moral rights to the version of the paper presented here belong to the individual author(s) and/or other copyright owners. To the extent reasonable and practicable the material made available in WRAP has been checked for eligibility before being made available.
Copies of full items can be used for personal research or study, educational, or not-for-profit purposes without prior permission or charge. Provided that the authors, title and full bibliographic details are credited, a hyperlink and/or URL is given for the original metadata page and the content is not changed in any way.
Publisher’s statement:
© 2017, Elsevier. Licensed under the Creative Commons Attribution-NonCommercial-NoDerivatives 4.0 International http://creativecommons.org/licenses/by-nc-nd/4.0/
A note on versions:
The version presented here may differ from the published version or, version of record, if you wish to cite this item you are advised to consult the publisher’s version. Please see the ‘permanent WRAP URL’ above for details on accessing the published version and note that access may require a subscription.
Realizing Value from Project Implementation under Uncertainty: An
exploratory study using System Dynamics
*Lin Wang
a, Martin Kunc
b, Si-jun Bai
ca Management School, Northwestern Polytechnical University, Xi'an 710129, PR China
b Warwick Business School, University of Warwick, CV4 7AL Coventry, UK
c Management School, Northwestern Polytechnical University, Xi'an 710129, PR China
International Journal of Project Management
Received 26 August 2016; received in revised form 22 December 2016; accepted 12 January 2017
*This work was supported by China Scholarship Council; National Natural Science Foundation of China [grant
Abstract: Project Implementation is not a trivial task even after careful planning and scheduling. One
of the reasons is the existence of unexpected events at strategic and operational levels during the
project execution process. This paper presents a system dynamics model of a project monitoring and
control system. Embedded with both strategic and tactical uncertainties, the model experiments with
typical remedial actions to disturbances during the implementation of a project under a behavioral
paradigm. Simple proportional adjustment seems to work well under low levels of unexpected
disturbances but prospect theory-based behavior works better under extreme situations. Our findings
indicate over-reacting behavior, which is influenced by biases and reporting errors, can generate
project escalation. Thus, thresholds for remedial actions should be implemented in project control and
monitoring systems to avoid over-reacting behavior leading to escalation and waste of resources.
1. Introduction
Organizations undertake projects as vital means to implement strategy and realize value (Chih and
Zwikael, 2015). However, a great proportion of projects fail, e.g. in 2015 only 29% of software
projects are successful, with 52% of the projects cancelled and 19% failed to deliver the expected
results (Dannis, 2015). One of the main reasons for this situation lies in today’s rapidly changing
environment. Uncertainties, which cannot be fully estimated and often involve ‘unknown- unknown’
events like evolving strategy, introduction of new technology and resource conflicts, have impact on
project implementation and force the deviation of perceived value from expected goals. Thus even if
organizations make great efforts to maintain accurate evaluation of the uncertainties and devise
well-designed project plans, project plans never perform in the predicted way, and if the deviation grows,
projects will fail. Under these circumstances, effective project implementation processes that consider
dynamism under uncertainty should be explored.
Two key problems challenge the management of projects. First, unforeseen events, which always
happen without warning signals, generate disruptions and leave serious impacts in the ability to
generate value from projects. Thus project implementation processes should involve not only
foresight but also take remedial actions in response to these unexpected changes, requiring the
combination of both proactive and reactive activities. Second, the existence of feedback mechanisms
can affect project implementation. Projects are often complex systems, in which different components
have non-linear interdependencies. Thus even small variation in individual components may diffuse
into serious crisis on the overall project, which means that it is hard to understand the effect of actions
on project outcomes (Williams, 2003). We propose a model to analyze , from a strategic perspective,
the management of organizational projects where project goals can evolve in a dynamic and uncertain
environment and the remedial actions adopted by managers are influenced by behavioral biases. Our
approach is based on a concept of projects as open systems, where project managers intend to
Thus, our research aim is to identify what project managers’ responses are more adequate given the
impact of uncertainties on project implementation.
In project management practice, some approaches have already been applied to mitigate the
deviation, such as Critical Path Method (CPM), Program Evaluation and Review Technique (PERT),
and Earned Value Method (EVM) (Pinto and Slevin, 1988). These network-based tools, though
widely adopted, are not fully applicable to tackle the complex situation mentioned above. Their
deficiencies comprise the narrow focus on specific operational aspects (cost, schedule and quality),
inability to deal with non-linear interrelations and the static perspective to recover the projects to
pre-determined baselines (Sang, 2005). As projects are implemented in open environments, stakeholders
have to continuously respond to internal and external changes (Park, 2003;). Both the strategic goals
and project status evolve constantly and require timely managerial interventions. Besides, since
human activities dominate the project implementation process, including perceiving and reporting the
changes, evaluating the remedial action proposals and making decisions, behavioral biases like
reporting errors and escalation of commitment should not be ignored (Meyer, 2014). Thus, project
monitoring and control in the implementation process is not all about the ‘hard’ operational data, but
calls for a strategic framework that integrates the dynamic nature of projects and human factors.
System Dynamics (SD), which proves to be effective in analyzing and modelling complex and
dynamic social systems (Zhang, 2014), is thus introduced to support project implementation. The
applicability of SD can be illustrated in three main aspects (Rodrigues, 2000): (1) SD adopts a holistic
and systemic perspective, thus the strategic achievements of projects can be analyzed with a
comprehensive consideration of operational dimensions; (2) SD focuses on the dynamic interactions
between different project components, hence, the overall impacts of changes (both from
environmental disturbances and human reactions) can be observed considering various feedback
effects embedding an ‘open system’ view of project implementation; (3) SD explicitly captures the
subjective factors, and then human behaviors can be incorporated. Moreover, the modelling process of
SD combines both ‘soft’ and ‘hard’ paradigms (Pidd, 2009; Rodrigues, 2000): Firstly, when
formulating the SD model, multiple stakeholders have to coordinate on the central structure of the
procedure promotes the organizational learning and provides insights into project implementation;
The second procedure is the computer-based simulation, which provides explicit suggestions such as
what the possible remedial actions would bring, and when and how to intervene. At this procedure,
the SD model can use operational data monitored by conventional methods.
Lyneis et al. (2001) found that SD can support project management in a number of ways: de-
signing project schedules and resource allocation, determining measurement and reward systems,
evaluating risks, and learning from past projects achieving important savings compared to projects
developed without SD. Roberts (2007) suggested the principle ‘rework cycle’ is at the heart of
modeling projects using SD. The main characteristics of this research are: the focus on specific tasks
and the use of resources to deal with the rework cycle. Our model takes a different view compared
with the previous works, which does not focus on the rework cycle or specific tasks but the impact of
strategic changes that can make the project irrelevant for the organization independently of their
efficiency in terms of time and costs.
A theoretical background is illustrated in Section 2, with discussions of the research framework and
dynamism of project implementation processes. In Section 3, a system dynamics model that
incorporates both strategic and tactical uncertainty effects is constructed. Experiments are carried
under diverse situations in Section 4 including the impact of remedial actions and disturbances from
reporting errors. In Section 5, two unanticipated crises on a project system are tested, followed by the
discussion and conclusions sections.
2 Theoretical Background
Project implementation system aims to maintain a dynamic match between strategy and operations
(Serra and Kunc, 2015). At the strategic level, organizational strategy can be broken down to the
individual project’s major targets (Lee, 2006), which we call ‘Expected Value’ (e.g. expected
productivity or expected function of products); while at the tactical level, the real advance or
development of the project (‘Realized Value’) is achieved. Both Expected Value and Realized Value
activities monitor the tactical performance to keep the project activities ‘on track’ with respect to the
initial plan determined at the beginning of the project (Pinto and Prescott, 1990).
Uncertainties in the environment generate changes to the system. Strategic change may arise at
organizational level and then be interpreted as a variation in project’s strategic targets. Meanwhile, the
tactical uncertainty may cause disruptions and delays on project progress even without strategic
changes. Thus, there may be situations where the strategic objective for the project cannot be achieved
or the project is of little value to new strategic objectives. Remedial actions (i.e. adjustments to
schedule priority or investment in additional funds or both) are required to mitigate the deviation
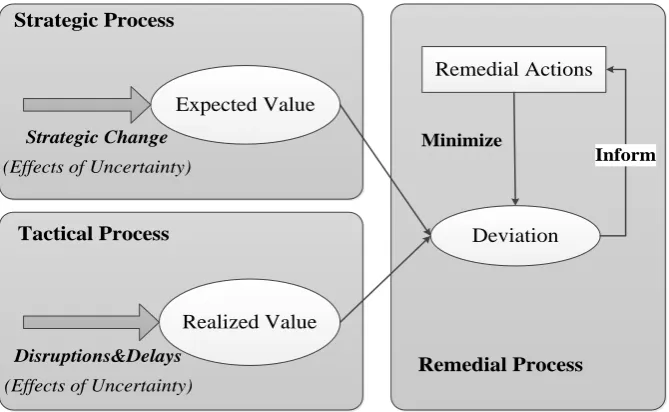
(Loch and Kavadias, 2002). Thus the objective of this paper is to present a simulation study of
behavioral remedial actions for on-going projects taken to minimize the deviation between realized
value and expected value (see Figure 1).
Expected Value
Deviation Remedial Actions
Realized Value
Disruptions&Delays
(Effects of Uncertainty) Strategic Change
(Effects of Uncertainty) Strategic Process
Tactical Process
Remedial Process
[image:7.595.131.466.349.555.2]Inform Minimize
Figure 1: Project Implementation Processes
2.1 Uncertainty and its impact on project management
There are always unforeseen events, which cannot be conceived or analyzed before projects
progress, and have vital effects. If some uncertainties are unknown, how can they ever be planned for?
Thus a great deal of research calls for moving from conventional PRM to events that ‘come out of the
blue’ (Petit, 2012; Ramasesh and Browning, 2014). Cleden (2012) clarifies two categories of project
risk and uncertainty, of which the ‘unfathomable uncertainty’ that is ill-understood in probability and
happening without warning require a backward thinking and a ‘reactive’ way, i.e. remedial actions, to
help mitigate the impacts on the development of the project. Uncertainty manifests in two aspects:
evolving goals and disruptions and delays(D&D).
Evolving goals.The strategic alignment of projects is always evaluated based on a static plan, with
the assumption that the project goals are unchangeable. However, this alignment seldom stays stable
and ‘even “perfect” alignment today would soon turn into misalignment’. Research on project
management demonstrated that less than 43% of project strategic priorities stayed the same during
five years (Young et al., 2012). Recent, Project Management Institute studies also found that strategic
change causes the realignment of project portfolios (Serra and Kunc, 2015). If strategic changes are
not considered, even if the project is executed well, outdated projects mean wasting resources without
delivering the expected value.
Disruptions&Delays. At the tactical level, the key issues are disruptions and delays (D&D)
originated from unknown situations. The term D&D often appear together as influences on schedule
and cost overruns. SD is commonly applied to demonstrate the interrelations that determine the
project behavior, ‘vicious cycle’ of D&D, and the management response to project changes (Williams
et al., 2003). In most circumstances, D&D arise from either a feedback phenomenon or exogenous
events (Howick, 2003). SD models can contemplate external events, managerial actions taken to
correct the impact of the events and the consequences of these actions (Howick, 2003). Thus, SD can
provide a useful view to the conceptualization of projects as open systems. However, SD does not
capture the detailed and operational level of project management such as in project scheduling models
(Howick, 2003). Since SD and the traditional project management tools have different limitations,
both of these techniques have been used alongside one another to analyze projects (Howick and Eden,
2004).
2.2 Dynamic adjustment on project management processes
Complex causal relationships s are the main characteristic of project implementation processes and
an important source for the dynamism observed in the project life (Roberts, 2007). The causal
relationships in the project system form feedback loops, either reinforcing (positive feedback loop) or
moving the project behavior towards the goal involves a negative feedback loop and the remedial
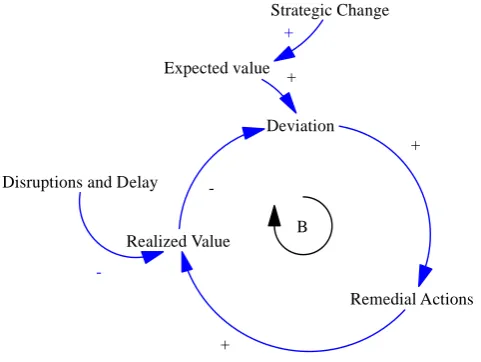
action typically changes corresponding to the deviation size (Lyneis and Ford, 2007). The dynamic
adjustment process is as follows (see Figure 2): when uncertainties generate Strategic Change and
Disruptions&Delays on the execution of a project, the Realized Value of a project (i.e. the level of
advance and development) deviates from the Expected Value. The Deviation between both
components is a signal for Remedial Actions to be taken. The Remedial Actions will improve the
Realized Value and thus help to reduce the Deviation, mitigating the impacts of the unforeseen events.
The cycle of monitoring the deviation, developing remedial actions and reevaluating iterates until the
end of the project. In this perspective, the project is an open system subject to the impact of strategic
[image:9.595.177.418.328.509.2]changes or Disruptions&Delays.
Figure 2: Dynamic Adjustment Process of Project Implementation
2.3 Remedial Process
As described in Figures 1 and 2, remedial processes comprise two components: 1) monitoring and
control of deviations, and 2) remedial actions. Monitoring transmits the signal requesting remedial
actions and remedial actions help to mitigate and control the deviation.
Monitoring and control of deviations. Crawford and Bryce (2003) claim that ‘monitoring’ is the
continuous procedure that reports and assesses the match degree between actual implementation and
planned implementation. Embedded with good monitoring procedures, in-time control activities to
determine the remedial actions would be enhanced. System dynamics is able to identify the dynamic
behavior and pattern of complex systems and has been applied to project control activities, e.g. Love Expected value
Realized Value
Deviation
Remedial Actions + +
-+
B
Strategic Change
+
Disruptions and Delay
-et al. Love (2002) look into how unplanned disturbances impact the expected work progression and
project management system in construction projects. They found that it is important to develop an
ability to respond promptly to changes within the construction project.
Remedial Actions. Organizations often have to modify the investment strategy and/or project
execution to improve performance, which is called ‘Remedial Actions’ or ‘Corrective Measures’.
Some work points to the role of remedial actions to adjust productivity or remove delays to bring
projects ‘back on track’. For example, Lyneis and Ford (2007), who employ SD models, illustrate two
types of project remedial actions as: easing performance targets, like slipping the milestone deadlines,
reducing the scope of the project or increasing the budget; and/or increasing the available resources,
like hiring more staff and work overtime (Lyneis and Ford, 2007).
Other researchers ook into the remedial strategy from the perspective of individual decision-making.
When investments in projects are not achieving expected returns, three investment strategies seem to
occur: escalation (invest more than originally planned), persistence (invest as originally planned) and
terminate (withdraw the investment) (Meyer, 2014).
3 Model Construction
System Dynamics modeling has been employed to construct stylized models of dynamically
complex phenomenon occurring in organizations, e.g. Repenning and Sterman (2002). Stylized
models differ from case-based models in the level of complexity represented in the model, as they aim
to look for generalizable structures rather than focusing on specific regularities of a specific case
(Kunc and Morecroft, 2007). Stylized models offer the possibility of experimenting with multiple
situations with the intention of extract either general patterns or special situations where complex
behaviors may be observed.
3.1 Stylized Model
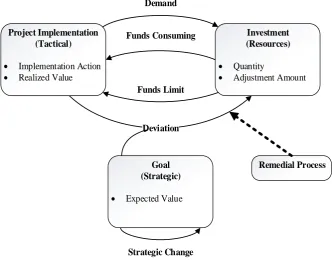
According to the previous discussion, the project implementation process consists of three sub-
systems: Goal sub-system (Strategic process), Project Implementation sub-system (Tactical process)
and Investment sub-system (Resource Allocation process). As illustrated in Figure 3, the output of
project with the strategy of the firm but it can be modified according if there is a change on strategy.
Project Implementation sub-system includes the tactical activities to achieve the Realized Value of a
project. Project Implementation consumes funds from the Investment sub-system . The deviation
between the output of the Project Implementation sub-system and the Goal sub-system requires an
Adjustment in the investment funds to narrow the existing gap, which is part of the Remedial Process.
The three sub-systems dynamically interact with each other and affect the value realized in a project.
Project Implementation (Tactical)
Implementation Action
Realized Value
Investment (Resources)
Quantity
Adjustment Amount
Goal (Strategic)
Expected Value
Demand
Funds Consuming
Funds Limit
Deviation
Strategic Change
[image:11.595.131.465.230.490.2]Remedial Process
Figure 3: Project Implementation Stylized System
Uncertainties are modelled in two ways according to their frequency of occurrence and feature of
impacts:
Continuous uncertainties. Continuous uncertainties are disturbances to the implementation
of a project, which are not significant enough to cease implementation, but they still require
monitoring and control due to their long-term impacts. This kind of uncertainties is frequently
part of any project implementation.
Unanticipated crises. Unanticipated crises are originated by discrete seldom events but, once
occurring, their impacts are felt substantially in a project. Their one-off and ambiguous nature
makes these events difficult to define or prevent even though some researchers tried to clarify
3.2 System Dynamics Model
A SD model was developed based on the stylized model shown in Figure 4. This model evolved
from well-established and validated SD models including those developed by Son and Rojas (2010),
Ford and Sterman (1998) and Lyneis and Ford (2007). We represented the general function of project
implementation, but this model should be structured with project stakeholders and additional
feedback loops like ripple effects may exist (e.g. when using overtime to improve the work
progression, ‘a fatigue cycle’ may function (Sterman, 2000)) for specific projects. The model is
constructed and tested using Vensim DSS.
Expected Value Realized Value Investment Priority Schedule Priority Available Funds Work Progression +
Value Creation Rate
+ Expected Value
Creation Rate
Disruptions&Delays
- Expected Work
Progression + Deviation + -Remedial Action Type 1 Remedial Action Type 2
Strategic Change +
Cost Rate Value Creation Capacity + + + Investment Rate Value Creation Index + Total Budget + Planned Funds per period + + Perceived Deviation + Time to Perceive
Figure 4: Dynamic Adjustment Process of Project Implementation System
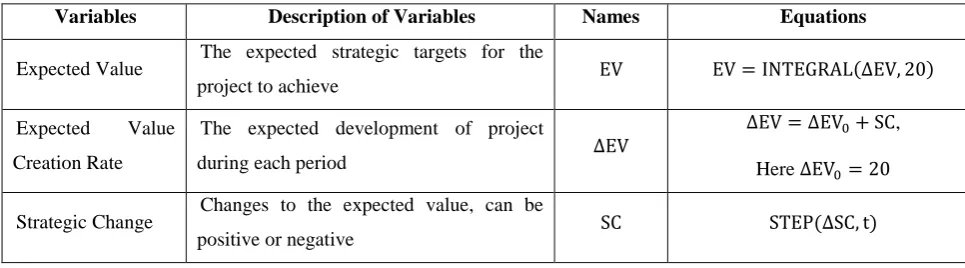
3.2.1 Goal sub-system
The goal sub-system fulfills the duty of transforming the strategic goals to the measurable project
expected value. Project managers have an expectation for the project (∆EV) in each period, e.g. when
a new project is agreed, a plan is defined with the expectations about the development of the project
for each month or quarter. These expectations accumulate over time into a total Expected Value (EV),
which becomes the goal for the implementation sub-system to ‘catch up’. However, companies may
adjust their strategy, which affect the expected development of the project, so we translate these
[image:13.595.71.554.367.501.2]changes in expectations using the variable Strategic Change (SC).
Table 1 Variables and Equations for Goal sub-ystem
Variables Description of Variables Names Equations
Expected Value The expected strategic targets for the
project to achieve EV EV = INTEGRAL(∆EV, 20)
Expected Value
Creation Rate
The expected development of project
during each period ∆EV
∆EV = ∆EV0+ SC,
Here ∆EV0= 20
Strategic Change Changes to the expected value, can be
positive or negative SC STEP(∆SC, t)
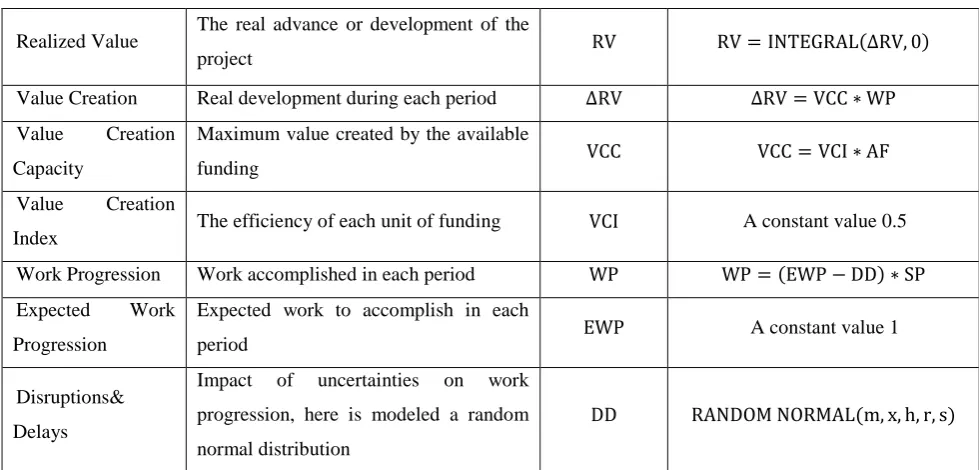
3.2.2 Implementation Sub-system
Realized Value (RV) accumulates the value yield by the project. We assume there is a certain
productivity of the investments in a project due to the efficiency of the process, e.g. the amount of
salaries paid to researchers developing a new product may not translate exactly as value if researchers
are not efficient. Therefore, a Value Creation Index (VCI) is applied to transform each unit of funding
into value. This is an innovative concept that has not been defined in the literature previously. Then,
when real Work Progression (WP) can be less than expected due to the impact of Disruptions&Delays
(DD), which are independent from the efficiency of the project resources.
Table 2 Variables and Equations for Project Implementation System
Realized Value The real advance or development of the
project RV RV = INTEGRAL(∆RV, 0)
Value Creation Real development during each period ∆RV ∆RV = VCC ∗ WP
Value Creation
Capacity
Maximum value created by the available
funding VCC VCC = VCI ∗ AF
Value Creation
Index The efficiency of each unit of funding VCI A constant value 0.5
Work Progression Work accomplished in each period WP WP = (EWP − DD) ∗ SP
Expected Work
Progression
Expected work to accomplish in each
period EWP A constant value 1
Disruptions&
Delays
Impact of uncertainties on work
progression, here is modeled a random
normal distribution
DD RANDOM NORMAL(m, x, h, r, s)
3.2.3 Investment Sub-system
When a remedial action is required, project funding increases since the project manager requires
either accelerate the investment in the project to compensate for delays or require additional funding.
We capture this action in the variable Investment Priority (IP). In some cases, the increase in funding
can be compensated by additional budget as Expansion Rate (ER) but the Total Budget sets the
[image:14.595.71.561.68.303.2]constraint for project implementation.
Table 3 Variables and Equations for Investment System
Variables Description of Variables Symbols Equations
Available Fund Accumulated Fund available for project
implementation in each period AF AF = INTEGRAL(IR − CR, 0)
Total Budget Investment Constraint for project
implementation TB A constant value 2800 or 6000
Investment Rate Investment for project in each period IR IR = NF ∗ IP
Normal Fund
per period
Fund invest for project in each period
according to the initial plan NF A constant value 40
Cost Rate Funds consumed in each period CR CR = AF
Expansion Rate Expansion for total funds in each time
period ER ER = CR ∗ (IP − 1)
Total Cost Overall consumed funds TC TC = INTEGRAL(CR, 0)
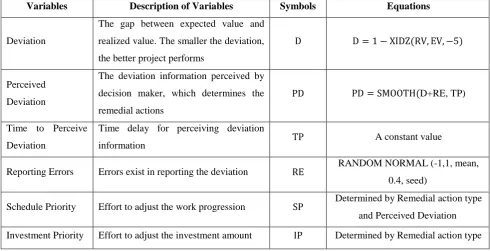
The performance of the project is measured by the Deviation (D) between the expected and realized
values and further perceived by project managers (PD). Then project managers adopt Remedial
Actions to modify the investment priority (changes in funding) and schedule priority (accelerating the
rate of tasks), which separately improves/reduces the value creation capacity (funding) and
[image:15.595.71.562.222.473.2]accelerates/decelerates the work progression.
Table 4 Variables and Equations for Remedial Process
Variables Description of Variables Symbols Equations
Deviation
The gap between expected value and
realized value. The smaller the deviation,
the better project performs
D D = 1 − XIDZ(RV, EV, −5)
Perceived
Deviation
The deviation information perceived by
decision maker, which determines the
remedial actions
PD PD = SMOOTH(D+RE, TP)
Time to Perceive
Deviation
Time delay for perceiving deviation
information TP A constant value
Reporting Errors Errors exist in reporting the deviation RE RANDOM NORMAL (-1,1, mean, 0.4, seed)
Schedule Priority Effort to adjust the work progression SP Determined by Remedial action type and Perceived Deviation
Investment Priority Effort to adjust the investment amount IP Determined by Remedial action type
4 Project Implementation under Continuous Uncertainties
We investigate how project managers react to project implementation under continuous
uncertainties. Firstly we evaluate the losses caused by uncertainties before identifying the role of
remedial actions. Then a comparison is made in selecting remedial actions with regard to two
behavioral decision making processes: Proportional adjustment (Lyneis and Ford, 2007) and Prospect
theory (Kahneman and Tversky, 1979; Keil et al., 2000). Finally, the impact of reporting errors on the
remedial process is evaluated.
4.1 Project Implementation Value Gap due to Uncertainties
Assuming the total project duration is 100 months, we address the impact of uncertainties on
strategic goals and operations respectively. For Strategic Change (SC), we illustrate two scenarios:
with low level, medium level and high level. Note we just intend to provide a wide range of
uncertainty levels to represent their impact, but, in practice, a low DD level may be within a project
manager’s tolerance thus no remedial actions are required and with a high DD level the project may
require re-planning since the disruption is too high.
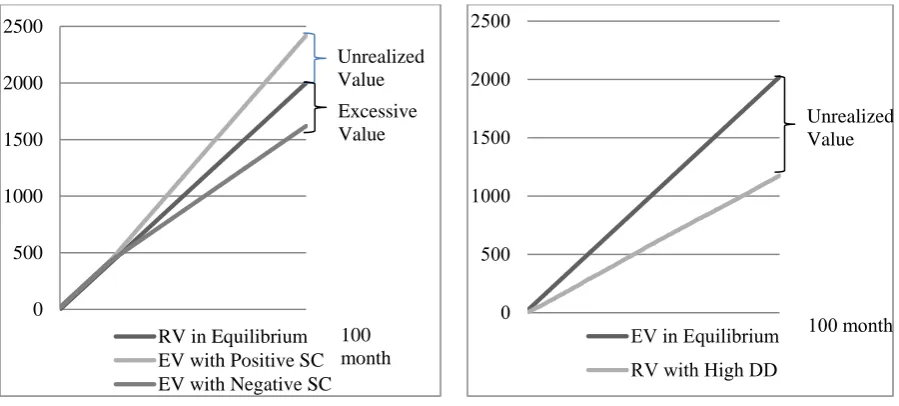
Figure 5 shows the potential losses caused by uncertainties at a strategic level. For positive SC, the
issue of Unrealized Value occurs due to the rise of expectations. The new expected value cannot be
fully achieved since the work progression and investment are not accelerated correspondingly. The
decline of expected value, on the contrary, induces a different type of loss related with Excessive
Value. When the project is not required to achieve the original goals, resources keeps being invested
in the project even though it will not contribute to the organization. If DD is large, the value yield by
the project cannot meet the expectations in each period leading to Unrealized Value in Figure 6.
By combining different Strategic Changes types and D&Ds levels, we developed six scenarios for
[image:16.595.72.522.348.551.2]experimentation (see Table 2) with different remedial actions.
Table 2: Scenarios for Sensitivity Analysis
Scenarios Strategic Change Disruption& Delays
1 Positive High
2 Negative High
3 Positive Medium
0 500 1000 1500 2000 2500
RV in Equilibrium EV with Positive SC EV with Negative SC
E Excessive Value Unrealized Value
100 month
0 500 1000 1500 2000 2500
EV in Equilibrium RV with High DD
Unrealized Value
100 month
[image:16.595.150.445.678.757.2]4 Negative Medium
5 Positive Low
6 Negative Low
4.2 Impacts of Remedial Actions
We experiment with two remedial action types in order to find how efficiently they can tackle the
uncertainties and reduce the value losses: one based on proportional adjustment and the other based
on Prospect theory. Lyneis and Ford (2007) suggest the adjustment amount for remedial actions is
usually set as a proportion of deviation. According to the prospect theory (Kahneman and Tversky,
1979), the value function of decision-makers is not linear but loss averse (and convex). When the
deviation is positive and higher, i.e. more money is lost compared with the expected value, and when
the deviation is negative and its absolute value is higher, i.e. more funds are wasted; the problems are
more severe for decision makers. Following this logic, the importance of remedial actions increases
with the absolute value of deviation rising. Thus two remedial action types are developed as follows:
Remedial Action Type 1: The priorities determined by the remedial action (y-axis) are a
fixed proportion of deviation (x-axis)(see Figure 7a). The values are normalized.
Remedial Action Type 2: With the absolute value of deviation increasing, more importance is
focused on the remedial action. The relationship between the remedial action (y-axis) and
deviation (x-axis) is set as a convex increasing function (see Figure 7b). The values are
normalized.
-1 -0.8 -0.6 -0.4 -0.2 0 0.2 0.4 0.6 0.8 1
-1.5 -0.5 0.5 1.5
Remedial Action Type 1
-1 -0.8 -0.6 -0.4 -0.2 0 0.2 0.4 0.6 0.8 1
-1.5 -0.5 0.5 1.5
With Remedial Actions, the deviation caused by uncertainties would be mitigated and the value
created would better match the expected value, e.g. Figure 8 illustrates the impact of remedial actions
in a positive strategic change and medium D&Ds scenario. Almost half of the value is compensated.
Comparing the two remedial actions in different scenarios, with respect to the base case deviation
and cost without remedial actions in each scenario, Table 3 shows Type 1 has better performance in
reducing the deviation between expected and realized value than Type 2. In scenario 6, when the
uncertainty impacts are small, remedial actions taken actually broaden the deviation. Note that
Deviation reflects the difference between RV and EV in percentage terms, and Total Cost is expressed
as an index from the initial budget, where initial budget is equal to 100. It is clear that reactions from
project managers improve performance but they also increase costs. Thus, type 2 responses seem to be
more adequate if costs are considered but type 1 are better when deviation is taken into account.
Table 3: Deviation and Cost of the Two Remedial Actions in Different Scenarios with Respect to Equilibrium
Scenarios
Deviation (%with regard to equilibrium) Cost (Index 100 is the baseline)
Type 1 Type 2 No Remedial Actions Type 1 Type 2 No Remedial Actions
1 47% 47% 70% 132 132 100
2 30% 33% 55% 124 121 100
0 500 1000 1500 2000 2500
0 50 100
EV
RV with Remedial Actions RV in Equilibrium
Compensated Value
[image:18.595.186.419.217.418.2]Figure 7a:Shape of Remedial Action Type 1
Figure 8: Unrealized Value Compensated by Remedial Actions
3 30% 34% 51% 120 116 100
4 11% 15% 28% 111 108 100
5 18% 23% 34% 111 108 100
6 -2% -2% 1% 102 102 100
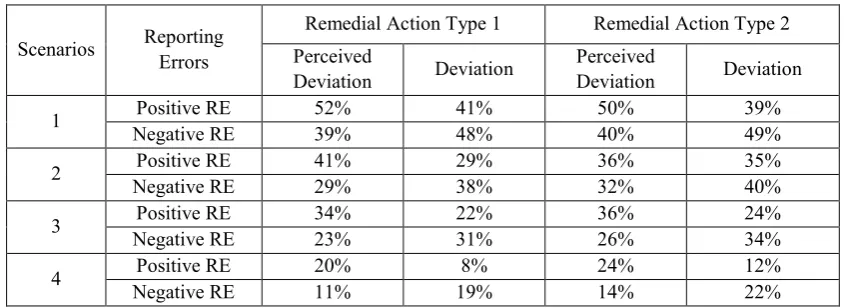
4.3 Issues affecting the reporting process
In practice, the project implementation system is subjected to issues on the reporting process like
reporting errors. Reporting errors are modeled as factors affecting the deviation perceived by decision
makers and further influence the behavior of the project monitoring and control system.
Reporting errors can distort the perceived value with respect to its original value. We conduct a
Monte-Carlo simulation considering RE as a normal distribution function with a positive mean as 0.2
(conservative) or a negative mean as - 0.2 (optimistic) to demonstrate different preferences of project
managers. With positive reporting errors, i.e. when managers tend to demand for additional
investment, the perceived deviations are higher than without reporting errors so deviations tend to be
reduced faster. On the contrary, if there is a tendency for negative reporting errors, i.e. managers
prefer to hide bad news, the deviation tends to be higher than without reporting errors. The results are
shown in Table 4 with respect to Equilibrium, which is 0% deviation. We see that the perceived
deviation and real deviation show opposite tendencies because of the balanced feedback loop that
tends to over-compensate the real deviation by requiring more resources and reducing the gap. Table
4 shows that conservative project managers, positive RE, tend to obtain lower deviation with respect
[image:19.595.86.510.606.760.2]to plans in both type of remedial actions.
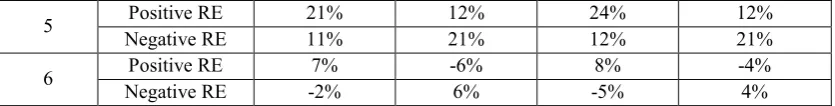
Table 4: Impact of Different Reporting Error Types with Respect to Equilibrium
Scenarios Reporting Errors
Remedial Action Type 1 Remedial Action Type 2 Perceived
Deviation Deviation
Perceived
Deviation Deviation
1 Positive RE 52% 41% 50% 39%
Negative RE 39% 48% 40% 49%
2 Positive RE 41% 29% 36% 35%
Negative RE 29% 38% 32% 40%
3 Positive RE 34% 22% 36% 24%
Negative RE 23% 31% 26% 34%
4 Positive RE 20% 8% 24% 12%
5 Positive RE 21% 12% 24% 12%
Negative RE 11% 21% 12% 21%
6 Positive RE 7% -6% 8% -4%
Negative RE -2% 6% -5% 4%
5 Reactions to Unanticipated Crises
Section 4 demonstrates how remedial actions help to reduce the losses caused by continuous
uncertainties. There also exist unanticipated substantial events that rarely happen but can cause severe
impacts. Looking into responses to those crises can help companies to react properly. Hence,
subsequent experiments of two unanticipated substantial crises: strategic disruption and resource
constraints will complete a comprehensive research on managing projects under uncertainty.
5.1 Strategic Disruption
Assuming that half way through the project the organization encounters a market shift, after which
the project is no longer required so there is a strategic disruption. In other words, strategic disruption
has a negative impact on the expected value. The rational response to this situation is to abandon this
project immediately because the project has accomplished its goal. However, this action may not be
taken due to a lack of regular strategic change sensing process or other factors hinder abandoning the
project. To discuss the actual loss caused by Strategic Disruption, we model the possible scenarios as:
The project is abandoned immediately;
The project is not abandoned, and no actions are taken: business-as-usual;
The project is not abandoned, but remedial actions are taken according to the deviation
perceived.
Experimental results show an increase in the deviation experiences at time 50. If the project is
abandoned after perceiving the crisis, no more investment is committed. When the project is not
abandoned, leaving aside the scenario when no actions are taken, the value creation rate is being
reduced by the remedial actions but the realized value keeps accumulating. The negative deviation
keeps expanding because the realized value is still increasing while the expected value stands steady.
[image:20.595.90.508.72.125.2]See Table 5 for the results.
5.2 Resource Constraints
Due to the wrong estimation of resources or resource conflicts with other projects, a project may be
short of funds or resources (Petit, 2012). Assuming that the project is implemented under a medium
level of D&Ds, the total budget is only 45% of the necessary budget and two scenarios are set
considering the resource constraints:
Normal Adjustment: Remedial actions can adjust the investment according to deviation
perceived.
Maintain Performance: Project managers keep committing funds to the project to maintain
the original performance instead of waiting for remedial actions to adjust funds.
At time 70, when the budget is used up, if the manager intervenes and forces the project to maintain
the original performance, more investment is required. Thus the expansion rate grows sharply to
compensate as Figures 9 shows (line 1 is maintain performance scenario and line 2 is normal
adjustment scenario). If remedial action performs as usual, the grow of deviation induces an increase
in the expansion rate of investment rate but this remedial process cannot compensate the poor
[image:21.595.175.424.532.697.2]budgeting..
Figure 9: Expansion Rate under Two Scenarios
Policy Remedial Action Type 1 Remedial Action Type 2 Abandon the project Business-as-usual
Comparing the two remedial action types at the end of the project and with limited resources, the
final cost would be more than the original total budget due to the escalation of funding to catch up
with the past deviation if the decision maker chooses to maintain the performance. See Table 6 with
the comparison between the base case of no remedial actions and the remedial actions under this
[image:22.595.69.529.223.315.2]situation.
Table 6: Comparison of Deviation and Total Cost under Different Scenarios with Respect to Equilibrium
Investment type
Remedial Action Type 1 Remedial Action Type 2 No Remedial Actions
Deviation Total Cost Deviation Total Cost Deviation Total Cost Normal
Adjustment 39% 125 43% 120 57% 100
Maintain
Performance 21% 164 26% 159 57% 100
6 Discussion
6.1 Remedial Actions and Project Escalation
The preceding experiments show two types of losses occurring during the implementation of
projects under uncertainty: unrealized value and excessive value. These losses can be perceived as
project failures when the value perceived is not aligned with the expected goals (White and Fortune,
2002). Remedial Actions are usually taken to compensate the deviation. However, remedial actions
are not one size fits all solutions.
Project Escalation, defined as ‘continuing commitment of failing projects’, is a pervasive
phenomenon that induces significant loss. For example, in scenario 1 the project cannot achieve
expected goals since the impact of uncertainty is extremely high but the project keeps running
regardless of the efforts made by remedial actions. In this case, the remedial process gives rise to
more escalation (occupation of more resources, higher schedule priorities) when the project can
potentially be abandoned. Therefore, when the project is no longer needed, such as in the case of
strategic disruption, and the project cannot be abandoned, the incremental withdrawal of investment
by remedial actions needs to help reducing the escalation.
Comparing the two project managers’ responses, Type 2, which applies Prospect Theory, does not
but it performs better in unanticipated crises. However, project managers’ responses, remedial actions,
may induce ripple effects to the organization (Lyneis and Ford, 2007). Hence, in practice,
insignificant impacts of uncertainty are often tolerated and project managers may not make
unnecessary changes for a relatively small deviation. Type 2 responses actually reflects this mentality
of avoiding over-reacting and makes the simulation results more realistic under low uncertainty
levels. However, project managers need to be aware of the impact of deviations and specify the
thresholds for remedial actions together with the remedial action type choice according to a balance
between estimated efforts (costs, resources) and potential achievements (tolerable level of deviation or
failure).
6.2 Importance of Flexible Reporting Procedures
Providing that the changes generated by uncertainties require reactive efforts other than can be
prevented in advance, a prompt monitoring and reporting procedure is of significant importance in
project implementation. For decision makers, in order to handle the performance of projects, the
accuracy of information origins (Reporting Errors) should be accentuated.
From the experiment results of Section 4.3, we can conclude reporting errors do have impacts on
project implementation and may amplify the deviation. Most often, when projects run out of control,
the project members are prone to hide the bad performance in order to avoid responsibilities or hold a
‘wait and see’ attitude based on optimism expectations for the future. For some projects, the deviation
does exist but it is difficult to be detected. In those occasions, the real problem cannot be fully
recognized by the decision makers. There also exist situations when perceived deviation is larger than
the real one. For project managers who are conservative and demand for more investment to
accomplish the projects, the deviation may be exaggerated but the final result may be better as they
reduce the deviations. Different theories can be applied for its explanation, like Goal Incongruence,
Self- Justification, and Optimism Bias (Keil et al., 2000; Son and Rojas, 2010). Organizations
capability to guarantee prompt and transparent information is necessary to avoid escalation.
6.3 Monitoring and Control of Unanticipated Events
When unanticipated events deemed significantly serious happen, they should be tackled as soon as
prepared in a limited time. In these emergent situations, the microanalysis of the events can provide
an efficient tool to determine the remedial actions from past experience (Howick and Eden, 2004).
For example, consider the experiment related to resource constraints in section 5.3. Decision
makers may be motivated by the pressure to accomplish the project or attracted by its promising
outcome so they keep escalating the amount of funding. However, we found the final investment turns
out to be more than half of the original funds if they persist on achieving the original goals.
Since the sources of uncertainties are difficult to clarify, modelling their impacts on different
project implementation sub-systems, ie sensitivity analysis, may be a way to categorize the events and
generate knowledge for newly arrived disruptions.
7 Conclusions
To analyze the impact of uncertainties on project implementation, we developed a system dynamic
behavioral model to evaluate the value realization of on-going projects. Our model extracts the
fundamental dynamism of project implementation and provides a transparent interpretation for project
managers, which can be adapted to projects in multiple industries. We do not focus on the
conventional triangle (cost, budget and quality) performance existing in project management literature
but provide an open systems frame for strategic project management.. Analyzing the possible losses
caused by strategic and tactical uncertainties, the impacts of remedial actions and disturbances of
behavioral biases are discussed from an individual perspective. Specifically, two unanticipated events
are modeled, which gives a clue on how to efficiently response to unexpected crises. The results
demonstrate the development of project escalation and the impact of prospect theory, a cornerstone in
behavioral economics. We also evaluated the impact of reporting processes on the final results.
Therefore our study contributes to three areas: project management under ’unk unks’, the impact of
behavioral biases on the achievement of project objectives, and system dynamics applied to project
management.
Since this research mainly focus on the individual projects’ behavior when faced with uncertainties
and corresponding remedial actions, the synergies among multiple projects in realizing value have not
of specific cases. Further research will focus on multi- project implementation and applications to
empirical studies in specific contexts to adapt the model to contextual issues. Additional Research can
be performed on the use and combination of multiple tools, e.g. CPM/PERT and project benefits
realization with system dynamics, to address the issues discussed in this paper.
Reference:
Aritua, B., Smith, N. J., Bower, D., 2009. Construction client multi-projects – A complex adaptive
systems perspective, International Journal of Project Management 27(1), 72-79.
Chih, Y.-Y., Zwikael, O., 2015. Project benefit management: A conceptual framework of target
benefit formulation. International Journal of Project Management 33 (2), 352–362.
Cleden, M. D., 2012. Managing project uncertainty. Gower Publishing, Ltd.
Crawford, P., Bryce, P., 2003. Project monitoring and evaluation: a method for enhancing the
efficiency and effectiveness of aid project implementation. International journal of project
management 21 (5), 363–373.
Dannis, 2015. 2015 chaos report. Report, The Standish Group.
Ford, D. N., Sterman, J. D., 1998. Dynamic modeling of product development processes. System
Dynamics Review 14 (1), 31–68.
Howick, S., 2003. Using system dynamics to analyse disruption and delay in complex projects for
litigation: can the modelling purposes be met? Journal of the Operational Research Society 54 (3),
222–229.
Howick, S., Eden, C., 2004. On the nature of discontinuities in system dynamics modelling of
disrupted projects. Journal of the Operational Research Society 55 (6), 598–605.
Kahneman, D., Tversky, A., 1979. Prospect theory: An analysis of decision under risk. Economet-
rica: Journal of the Econometric Society, 263–291.
Keil, M., Mann, J., Rai, A., 2000. Why software projects escalate: An empirical analysis and test of
four theoretical models. MIS Quarterly, 631–664.
Kunc, M. and Morecroft, J., 2007. System dynamics modelling for strategic development. Supporting
Liao, Y.-W., Wang, Y.-M., Wang, Y.-S., Tu, Y.-M., 2015. Understanding the dynamics between
organizational it investment strategy and market performance: A system dynamics approach.
Computers in Industry 71, 46–57.
Loch, C. H., Kavadias, S., 2002. Dynamic portfolio selection of NPD programs using marginal
returns. Management Science 48 (10), 1227–1241.
Love, P., Holt, G. D., Shen, L., Li, H., Irani, Z., 2002. Using systems dynamics to better understand
change and rework in construction project management systems. International Journal of Project
Management 20 (6), 425–436.
Lyneis, J. M., Cooper, K. G., Els, S. A., 2001. Strategic management of complex projects: a case
study using system dynamics. System Dynamics Review 17 (3), 237–260.
Lyneis, J. M., Ford, D. N., 2007. System dynamics applied to project management: a survey,
assessment, and directions for future research. System Dynamics Review 23 (23), 157–189.
Meyer, W. G., 2014. The effect of optimism bias on the decision to terminate failing projects. Project
Management Journal 45, 8.
Park, M., Peña-Mora, F., 2003. Dynamic change management for construction: introducing the
change cycle into model-based project management. System Dynamics Review 19(3), 213–242.
Petit, Y., 2012. Project portfolios in dynamic environments: Organizing for uncertainty. Interna-
tional Journal of Project Management 30 (5), 539–553.
Petit, Y., Hobbs, B., 2010. Project portfolios in dynamic environments: Sources of uncertainty and
sensing mechanisms. Project Management Journal 41 (4), 46–58.
Pidd, M.,2009. Tools for Thinking: Modelling in Management Science. Wiley, 171-173.
Pinto, J. K., Prescott, J. E., 1990. Planning and tactical factors in the project implementation pro- cess.
Journal of Management studies 27 (3), 305–327.
Pinto, J. K., Slevin, D. P., 1988. Critical success factors in effective project implementation*. Project
management handbook 479.
Ramasesh, R. V., Browning, T. R., 2014. A conceptual framework for tackling knowable unknown
unknowns in project management. Journal of Operations Management 32 (4), 190–204.
dynamics of process improvement. Administrative Science Quarterly, 47(2), 265-295.
Rodrigues A. G., 2000. The application of system dynamics to project management : an integrated
methodology, 3.
Roberts, E. B., 2007. Making system dynamics useful: a personal memoir. System Dynamics Review
23 (23), 119–136.
Lee, S. H., Peña-Mora, F., Park, M., 2006. Dynamic planning and control methodology for strategic
and operational construction project management. Automation in Construction 15(1), 84-97.
Serra, C. E. M., Kunc, M., 2015. Benefits realisation management and its influence on project success
and on the execution of business strategies. International Journal of Project Management 33 (1), 53–
66.
Slevin, D. P., Pinto, J. K., 1987. Balancing strategy and tactics in project implementation. Sloan
management review 29 (1), 33–41.
Son, J., Rojas, E. M., 2010. Impact of optimism bias regarding organizational dynamics on project
planning and control. Journal of construction engineering and management 137 (2), 147–157.
White, D., Fortune, J., 2002. Current practice in project management an empirical study. International
Journal of Project Management 20 (1), 1-11.
Williams, T., 2003. Learning from projects. Journal of the Operational Research Society 54 (5), 443–
451.
Williams, T., Ackermann, F., Eden, C., 2003. Structuring a delay and disruption claim: An application
of cause-mapping and system dynamics. European Journal of Operational Research 148 (1), 192–204.
Young, R., Young, M., Jordan, E., O., P., 2012. Is strategy being implemented through projects?
contrary evidence from a leader in new public management. International Journal of Project
Management 30 (8), 887–900.
Zhang, X., Wu, Y., Shen, L., & Skitmore, M., 2014. A prototype system dynamic model for assessing