ISSN: 1816-949X
© Medwell Journals, 2019
Effect (Sn2P2S6) Nanoparticles on Electre-Optic Properties of Silozane Polymer
1
Khalid AL. Ammar,
1Hassan Shaker Majdi and
2Mariam Rafied
1Almustaqbal University College, Hillah, Iraq
2
Department of Physics, College of Education for Pure Science, Babylon University, Hillah, Iraq
Abstract: In this study, A series of polymers focused on photovoltaic properties with different molecular weights based on the polysiloxane spine. The reason for reducing molecular weight will reduce the temperature of phase transmission and ultimately to destabilize the stage of infection as well as reducing the observed voltage also reduces, the molecular weight of the polymer. Sn2P2S6 is a multi-stage nanoparticle with repeated ranges of nanoparticles between the different phases in which the material is formed which are also liquid crystals. This is due to be an increase in internal elasticity of aliquid crystals where was found there is a strong coupling between the mesogenic chain and a polymer series and the elasticity of the polymer chain has a strong and effective effect on electrical properties. The direction order of the direction of the mesoginic units is based on a temperature similar to the molecular weight of a polymer that the size of a parameter of demand is most lower. Molecular weight increases polymer change and leads to changes in dynamic response but these time scales are dominated by effects at different temperatures and molecular weight as well.
Key words: Liquid crystal polymers, Sn2P2S6, polysiloxane, electro-optic properties, multi-stage, photovoltaic
INTRODUCTION
The name “Liquid Crystals” during the past decade, coined and it has been used in many applications (Cross, 1964). Liquid Crystals (LCs) are substances that have,the appearance of liquid but their molecules are arranged at certain levels, such as crystals which are the transformation of matter and the rearrangement of molecules in the same state (Chandrasekhar, 1977). Liquid crystals are defined as the intermediate state whose composition is limited between the solid crystalline solid state in which the molecules are constrained by motion and with a three-dimensional geometric system and the irregular ordinary liquid state in which the particles of matter move in a random way. Materials that show the crystalline phases of liquid crystallized about a century ago and these materials have evolved during the last two decades only in laboratories to become the basis of modern science and life developments (Philip and Cheu, 2004). The credit is due to the discovery of liquid crystals to the Austrian botanist Friedrich Reinitzer. In 1888, he abolished benzoyl cholesterol to obtain the molecular weight of cholesterol (Chandrasekhar, 1992). It has been found that this study, showed two melting points when heating. The liquid crystalline phase is generally defined in terms of the arrangement of long-range molecules that appear through, its crystalline crystalline molecules. There are three degrees of long-range local arrangement. In a liquid crystalline phase, at least one of this degree is removed and in a liquid phase that is not in any long-term local order (Percec and Tomazos, 1992;
Pugh and Kiste, 1997). There may, however, exist short-range rotation or orientational order between the molecules if they exhibited a shape an anisotropy, so that, a true isotropic liquid phase is only exhibited when neither positional, long-range nor orientational short-range order exist (Cowrie, 1991). Thus, if one or more of these degrees, of positional or rotation order are manifest by the anisotropy molecules, then we have a useful definition of the crystalline phase or misophase between the isotropic liquid and crystalline phases (Solymer and Walsh, 1984). Depending on the degrees of order in the system, three general classes of liquid crystalline phases may be defined nematic, cholesteric (or chiral nematic) and smectic these are showns chematically). In the nematic phases the molecules show only short-range orientational order and is no long-range positional order between a molecules. Thermal motion of a freely translating molecules ensures that the alignment direction is only an average property, defined by the so-called director (De Jeu, 1980). This does, however, lead to locally anisotropic refractive indices, dielectric constant and magnetic susceptibilities which are referred, to the director direction the birefringence as given by where the subscripts indicate parallel and perpendicular to the director, respectively (Polak, 2013). Although, individual molecules may be polar, the nett anti parallel ordering in the system ensures that macroscopically the nematic phase is non-polar. Nanoparticles have been shown to increase, the polymerability of polymer siloxane in a liquid crystalline phase to interact with the electrolytic field (Cognard, 1982), leading to an improvement in the properties of the polymer in a direction that reduces the
time of optical response, confirming the possibility of using them in modern industries of optical storage devices (Pikin, 1981).
MATERIALS AND METHODS
Experimental: In this research, the glass slides were used and covered with oxide plates made of tin oxide material for all photovoltaic cells which was sufficiently flat which could allow the manufacture of cells with parallel plate separation. The glass was cut into sheets with an area of about (6-2 cm). The HCl powder is mined with zinc metal powder which acts as a catalyst to give the surface of the electrode (2 cm) square. Each glass panel is then manually washed with water and cleaned in an ultrasonic bath for (30 min) at (60°C). The cellular electrodes were coated with a thin layer of polyamide and a spindle working at (4,500 rpm) was used To achieve a uniform alignment of the liquid crystal director. These coated slices are heated in the oven for (30 min) at (80°C) and then rubbed at room temperature in one direction using a piece of cloth and using a repeatable procedure where it is heated again for time is (30 min) at a temperature (130°C) (Frank, 1958).
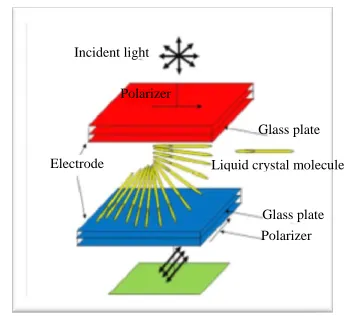
A small portion of the carefully selected polymer sample was applied to one of the treated glass electrodes and then heated for some time (typically 10-15 min) above the polymer filter point in order. To allow the besieged air to escape (Pikin, 1981). The second electrode pole was then installed above the first pole and the full assembly was introduced under, a homemade clamping frame. The majority of the cells used in this research were prepared using a Kapton study of nominal thickness (0.025 mm) as joints to separate the electrodes (Ens and Me Guire, 1997). The thickness of the cells was measured using small metric techniques, both of which were similar to the generation with typical pole separations in the range (0.0026-0.030 mm). The final step in the preparation of the photovoltaic cell was to connect,the conductors to the electricity. Field of power supply (Ferry, 1980; Hill and Jacobs, 2006). Figure 1 shows the electro-optical cell construction. The most important three devices were used in this resesrch for electro-optic measurement are:
C MK 1000
C Hcs 402
C ALCT
[image:2.612.334.506.97.257.2]The (MK 1000) series temperature controller offers precision, accuracy and stability for temperature measurement and control. When coupled with heating/ cooling, equipment from instc, the (MK 1000) can provide temperature control which is accyrate to (0.001°C). Two operation modes, keypad operation using, the front panel of the controller or software control though pc as well as. Adjustable ramp (rate of heating/cooling)
Fig. 1: Electro-optic cell
to user set temperature point. Programmable operation command set. Precisely controls temperature to (0.001°C) option save temperature data to the computer. RTD thermistor or thermocouple (LC) cell holders for many types of (LC) cells. Temperature control system which includes (MK 1000) controller, nitrogen container nitrogen pump (LN2-p) and hot-cooling stage. It features, large viewing aperture. Dual pane window for better thermal isolation. Integrated aperture window defrost system. Gas purge sample chamber. Inner lid for improved sample temperature uniformity. Vertical and horizontal mounting. Optional precision X-Y micropositionar for sample positioning. Application software, wintemp, allows remote control from host computer and the (ALCT) Liquid Crystal measuring subsystem which includes (ALCT-EO1) (referred as ALCT after), test cell holder, photo detector head and connecting cables. Using this system with well-prepared (LC) test cell and proper method, user can measure:
Liquid crystal mixture physical parameters:
C Dielectric constants (g||, gz,Δg)
C Elastic constants (K11 and K 33)
C Threshold Voltage (Vth)
C Polarization current (Ip)
C Viscosity (γ1)
Optical performance of (LCD) devices:
C Voltage-transmittance curve
C Switching speed, rise, falling time
Application software: WinLC, provides user, an integrated tools to conFig. measurement setup, data collection, analysis and visualization. Optical test bench subsystem which includes white (LCD) light source, polarizer, rotatable hot-cooling stage holder analyzer and photo detector holder. This test bench allows user to:
Liquid crystal molecule Incident light
Electrode
Glass plate Polarizer
2.0 1.8 1.6 1.4 1.2 1.0 0.8 0.6 0.4 0.2 0
In
te
n
sity
0 50 100 150 200 250 300 Voltage (V)
128°C
CH3
CH3
Ch3
Si O
Ch3
Si
(CH )62
OR
OR = C O CN
CH3
1.8 1.6 1.4 1.2 1.0 0.8 0.6 0.4 0.0 0
In
te
n
si
ty
0 50 100 150 200 250 Voltage (V)
99°C 122°C 2.0
1.8 1.6 1.4 1.2 1.0 0.8 0.6 0.4 0.2 0
In
te
n
sit
y
0 50 100 150 200 250 300 Voltage (V)
[image:3.612.328.524.102.191.2]Fig. 2: Picture of device with optical test bench subsystem
[image:3.612.85.289.102.221.2]Fig. 3: Materials chemical structures
Table 1: Molecular weight and phase transition data polysiloxane
Polymer Mw Dp Tg°C TNI°C
1 1.7*106 320 48 130
2 8.1*105 102 40 125
3 7.2*104 15 26 104
4 4.5*103 7 16 77
5 3.1*103
4 4 61
C Arrange polarizer and analyzer perpendicular and parallel to each other
C Test cell in side of the hot-cooling stage can be rotated in full (360°) range
C Light source, polarizer and analyzer are installed in sealed dark sections to prevent the contamination of optical components
C Light sealable working chamber shields a way the room lighting (Fig. 2, 3 and Table 1)
RESULTS AND DISCUSSION
Dynamic electro-optic properties: Using the system and the method described in research, we have implemented a cyclic experiment in which we use the values of (τon) to
determine when a steady, state is reach. As mentioned in research the approach, allows both (τon) and (τoff) to be
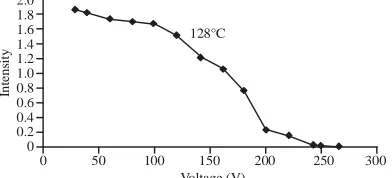
evaluated. In order to achieve complete switching, we typically applied (147-240 V) (peak to peak) at a frequency of 500 Hz. Figure 4-8 show the variation of the transmitted light intensity as a function of the applied, voltage and the required voltage for each material in this
Fig. 4: A plot of the transmitted light intensity through crossed, polarisers as a function of applied peak to peak voltage (50 Hz) for prealigned electro-optic cell prepared using the polymer No. 1 indicating the voltage required for complete switching
Fig. 5: A plot of the transmitted light intensity through,crossed polarizers as a function of the applied, peak-to-peak voltage (500 Hz) for a prealigned electro optic cell prepared using the polymer No. 2, the voltage required for complete switching
Fig. 6: A plot of the transmitted light intensity, through crossed polarizers as a function of the applied, peak-to-peak voltage (500 Hz) for a prealigned electro optic cell prepared using the polymer No. 3 indicating the voltage required for complete switching; PMMA*:poly-methyl-methyl acrylate
study for complete switching. By reducing the Temperature (TNI) the saturation states showed in Fig. 4-8
shifted, the required voltage for complete, switching was increased in this case reproducible switching effect were. Observed at temperatures close to the nematic-isotropic transition temperature where the viscosity of the polymer is relatively low and measurement were, made in the range of (TNI to TNI-3) for materials No. 1 and 2 and no
[image:3.612.308.537.109.635.2] [image:3.612.74.293.263.366.2] [image:3.612.71.297.406.464.2]2.0 1.8 1.6 1.4 1.2 1.0 0.8 0.6 0.4 0.2 0 In te ns it y
0 20 40 60 80 100 120 140 160
Voltage (V) 74°C 10 9 8 7 6 5 4 3 2 1 0 τ
on (s
ec
)
0 500 1000 1500 2000 Time left off (min)
71°C 75°C 25 20 15 10 5 0
0 500 1000 1500 20000
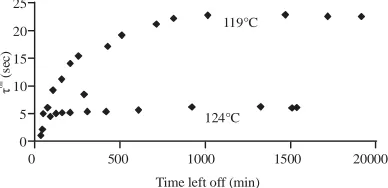
Time left off (min) 119°C
124°C
τ
on (s
ec ) 40 35 30 25 20 15 10 5 0
0 500 1000 1500 2000
Time left off (min) 100°C
101°C
103°C
τ
on (s
ec ) 30 25 20 15 10 5 0 τ
on (s
ec
)
0 200 400 600 800 1000 1200 1400 1600 1800
Time left off (min) 127°C 129°C 2.0 1.8 1.6 1.4 1.2 1.0 0.8 0.6 0.4 0.2 0 In te n si ty
0 20 40 60 80 100 120 140 160 180
Voltage (V) 60°C
Fig. 7: A plot of the transmitted light intensity through crossed polarizers as a function of the applied, peak-to-peak voltage (500 Hz) for a prealigned electro optic cell prepared using the polymer No. 4 indicating the voltage required for complete switching
[image:4.612.322.534.91.410.2]Fig. 8: A plot of the transmitted light, intensity through crossed polarizers as a function of th applied peak-to-peak, voltage (500 Hz) for a prealigned electro optic cell prepared using the polymer No. 5 indicating the voltage required for complete switching
Fig. 9: A plot of (τon) for the indicated temperature
showing the variation in τon for differing values
of (τoff) the time for which the field was left off
prior to the measurement of τon for a cell prepared
using the polymer No. 1
these materials in the smectic phase but measurements were made for the materials (No. 3-5) in the range of (TIN to.TNI-5) at the same time reproducible, switching effects
were observed in the nematic phase for No. 3 Fig. 9-13 show (τon) as a function of the time for, respectively, each
set of experiment were made at constant temperature. These curves show similar characteristic features to the series of (PMMA, Poly Methyl-Methyl Acrylate) containing liquid crystal polymers, although, there are some differences in the time scale. Initially the switch-on time (τon) is short but this only arises from the insufficient,
[image:4.612.329.523.95.189.2]time allowed for complete relaxation to the predefined
Fig. 10: A plot of τon for the indicated temperature
showing the variation in τon for differing values,
of τoff the time for which the field was left off
prior to the measurement of τon for a cell
[image:4.612.92.294.95.173.2]prepared using the polymer No. 2
Fig. 11: A plot of τon for the indicated temperature
showing the variation in τon for differing values
of τoff the time for which the field was left off
prior to the measurement of τon for a cell
prepared using the polymer No. 3
Fig. 12: A plot of τon for the indicated temperature
showing the variation in τon for differing values
of τoff the time for which the field was left off
prior to the measurement of τon for a cell
prepared using the polymer No. 4
surface alignment state. As the time for which the field is removed (τoff) increases, the following (τon) increases until
a quasi-equilibrium is reached. From such curves, we can obtain values for (τon and τoff) which represent switching
between equilibrium conditions. Repetition of the cyclic experiment at different but fixed temperatures allows the temperature variation of (τon and τoff) to be mapped
[image:4.612.325.531.264.396.2] [image:4.612.325.522.468.552.2]6
5
4
3
2
1
0
τ
on (s
ec
)
0 500 1000 1500 2000 2500
Time left off (min) 57°C 58°C
60°C
8
7
6
5
4
3
2
1
τ
on (s
ec
)
40 50 60 70 80 90 T-Tg oC
1 2 3 4 5
Fig. 13: A plot of τon for the indicated, temperature
showing the variation in τon for differing values
of τoff the time for which the field was left off
prior to the measurement of τon for a cell
[image:5.612.75.286.91.422.2]prepared using polymer No. 5
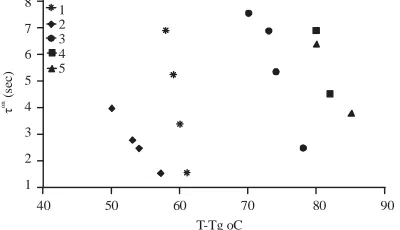
Fig. 14: A plots of τon as a function of the T-T g
Result and analysis of (τon): Near to the
[image:5.612.87.286.93.222.2]nematic-isotropic transition a response of the order of a few seconds can be observed however as shown in Fig. 14 there is a strong temperature, dependence of the switching times. We know that at much lower temperatures the side-chain liquid crystal polymer forms a glass. An approach based upon free volume, considerations which has been very successful with conventional, polymers in describing their behavior above the glass transition temperature is the William, Landel Ferry Model (WLF). In this approach the logarithm of the ratio of the viscosities at temperature T and at the glass transition are given by:
(1)
* T
*
Tg g g f
n -B T
log
n 2.3f f / +T
Where:
fg : The free volume at the glass transition
αf : The expansion coefficient
B : The constant of the order of unity
T*: The difference between the Temperature (T) and the
glass transition
we have attempted to fit the (τon) data as a function of
(T*). Other words, we take:
(2)
on T
A good fit is obtained by Fig. 14, the variation in (τon)
for varying polymer molecular weight for measurements made at (1°C) below (TNI). Direct comparison of this data
is complicated by the different, measurement ranges above the glass transition and by the multitude, of factors affecting the magnitude of (τon) (Al-Ammar et al., 1993).
The higher molecular weight polymers namely material No. 1 and 2 do not show a show a response to the electric field within the time of the experiment at temperature more than (3°C) below (TNI), if however, we extrapolate the observed (τon) value Fig. 14 for all
molecular weight.
CONCLUSION
Increased molecular weights lead to an increase in visual response times. The operating voltage relationship with molecular weights where the second increases as the operating voltage increases. Added nanoparticles have improved, electrostatic properties by reducing optical response times (Teo and Sun, 2007).
REFERENCES
Al-Ammar, K.H., M.J. Whitcombe and G.R. Mitchell, 1993. The effect of the molecular weight on the electro-optic properties of methacrylate-based side-chain liquid crystal polymers. Polym., 34: 2060-2064.
Chandrasekhar, S., 1977. Liquid Crystals. Cambridge University Press, Cambridge, UK.,.
Chandrasekhar, S., 1992. Liquid Crystals. 2nd Edn., Cambridge University Press, Cambridge, UK., Pages: 451.
Cognard, J., 1982. Alignment of nematic liquid crystals and their mixtures. Mol. Cryst. Liq. Cryst. Suppl. Ser., 1: 1-78.
Cowrie, J.M.G., 1991. Polymers: Chemistry and Physics of Modern Materials. 2nd Edn., Nelson Thornes, UK., ISBN: 0748740732, Pages: 436.
Cross, A.D., 1964. An Introduction to Practical Infra-Red Spectroscopy. 2nd Edn., Butterworths, London, UK., Pages: 86.
De Jeu, W.H., 1980. Physical Properties of Liquid Crystalline Materials. Vol. 1, CRC Press, Boca Raton, Florida, USA., Pages: 130.
Ens, R.H. and G.G. Me Guire, 1997. Nonlinear Physics. Birkhauser Verlag, Basel, Switzerland,.
[image:5.612.82.282.303.418.2]Frank, F.C., 1958. Liquid crystals: On the theory of liquid crystals. Discuss. Faraday Soc., 25: 19-28.
Hill, L. and A. Jacobs, 2006. 3-D liquid crystal displays and their applications. Proc. IEEE., 94: 575-590. Percec, V. and D. Tomazos, 1992. Molecular engineering
of side-chain liquid-crystalline polymers by living cationic polymerization. Adv. Mater., 4: 548-561. Philip, H.M. and Cheu, 2004. Liquid Crystals in Science
and Technolog. National Chiao Tung University, Hsinchu, Taiwan,.
Pikin, S.A., 1981. The Structural of Transformations in Liquid Crystals. Nauka, Moscow, Russia,.
Polak, B., 2013. Frank Elastic Properties. Liquid Crystal Institute, Kent, Ohio, USA.,.
Pugh, C. and A.L. Kiste, 1997. Molecular engineering of side-chain liquid crystalline polymers by living polymerizations. Prog. Polym. Sci., 22: 601-691. Solymer, L. and D. Walsh, 1984. Lectures on the
Electrical Properties of Materials. 3rd Edn., Oxford University Press, Oxford, UK., ISBN: 9780198511632, Pages: 413.