www.wjpr.net Vol 5, Issue 9, 2016. 902
FORMULATION OPTIMIZATION AND EVALUATION OF SELF
EMULSIFYING DRUG DELIVERY SYSTEM OF ATORVASTATIN
CALCIUM BY USING DESIGN OF EXPERIMENTS
D. Akiladevi*1, M. Nappinnai2, A. Jerad Suresh3, P.Amudha4, T. Vetrichelvan5
1
Department of Pharmaceutics, Adhiparasakthi College of Pharmacy,
Melmaruvathur-603319.Tamilnadu, India.
2
Department of Pharmaceutics, School of Pharmacy, Surya Group of Institutions,
Vikravandi, Villupuram Dist.605 652. Tamilnadu, India
3
Department of Pharmaceutical Chemistry, College of Pharmacy, Madras Medical College,
Chennai-600 003. Tamilnadu, India.
4
Department of Pharmacology, C.L. Baid Metha College of Pharmacy, Thorapakkam,
Chennai- Tamilnadu, India.
5
Department of Pharmaceutical Analysis, Adhiparasakthi College of Pharmacy,
Melmaruvathur-603 319. Tamilnadu, India.
ABSTRACT
The aim of the present research was to prepare, evaluate and optimize
self emulsifying drug delivery system (SEDDS) of atorvastatin calcium
of poor water solubility using design of experiment. A 13-run 32 full
factorial design with 2 factors and 3 levels, including 4 replicates at the
centre point, was used for fitting a 2nd order response surface. After
preliminary screening, Sunflower oil, Labrasol as surfactant and
Transcutol HP as Co surfactant were taken as independent variables.
The dependent factors (responses) were particle size and percentage
drug load. The responses were optimized simultaneously by using
desirability function, and the results demonstrated marked main and
interaction effects of independent factors on responses. The optimized
formulation consisted of 67.586% (w/w) oil, 52.529% w/w Smix
showed measured responses of particle size 169.7 nm, Percentage drug Load of 87.2%,
polydispersity index of 0.2 and Zeta potential of -31.8 mV values. For the optimized
formulation, predicted value and experimental value were in close agreement. The in vitro
Volume 5, Issue 9, 902-924. Research Article ISSN 2277– 7105
*Corresponding Author
Mrs.D.Akiladevi,
Asst.Prof
Department of
Pharmaceutics,
Adhiparasakthi College of
Pharmacy,
Melmaruvathur-603319.Ta mil Nadu, India.
Article Received on 20 June 2016,
Revised on 11 July 2016, Accepted on 02 Aug. 2016
evaluation parameters such as emulsification time, viscosity determination, cloud point
measurement, turbidity measurement, refractive index and spectroscopic optical clarity were
measured. The in vitro drug release from optimized atorvastatin SEDDS formulation was found to be 99.75% after 90 minutes which was highly significant in comparison to the
marketed tablet and pure drug. Drug release kinetic of optimized batch showed first order
with fickian diffusion type drug release. The optimized formulation was stable at varied
temperatures of stability study.
KEYWORDS: Formulation, optimization, evaluation, design of experiments, atorvastatin
calcium, self emulsifying drug delivery system.
INTRODUCTION
Dosage form designing for any drug is based on the route of administration. Among the
different routes, oral administration is the most preferred throughout the world for patients of
all age groups. Though there are numerous advantages for per oral route; there are certain
limitations. As per published reports almost 40% of the new chemical entities (NCE) are
underutilized due to unfavorable physiochemical properties. The solubility of the NCE to be
used as drug plays a crucial role in the final bioavailability. Based on different parameters,
drugs are classified under Biopharmaceutical Classification system (BCS). Formulation
pharmacist aspires to increase bioavailability through different approaches to increase
solubility and bioavailability which includes complexation with cyclodextrins, solid
dispersion (suspension), co precipitation, micronisation, salt formation, emulsion, use of
micelles, and co grinding. The latest development among the various approaches is to utilize
solutions in lipid vehicles containing surfactants that constitute a self-emulsifying drug
delivery system (SEDDS). A widely utilized approach for overcoming poor fasted state
bioavailability of lipophilic drugs is to effect spontaneous emulsification upon contact of the
oil with fluids in the G.I. tract.[1] SEDDSs are isotropic mixtures of oils and surfactants;
sometimes it contains co-solvents, and it can be used for the design of formulations in order
to improve the oral absorption of highly lipophilic compounds. SEDDSs emulsify
spontaneously to produce fine oil in-water emulsions when introduced into an aqueous phase
under gentle agitation. SEDDS can be administered orally in soft gelatin capsules and form
fine, relatively stable oil-in-water emulsions upon aqueous dilution. Self-emulsifying
formulations spread readily in the gastrointestinal tract (GIT), and the GI motility of the
systems have the advantage that the drug in dissolved form and the small droplet size
provides a large interfacial area for the drug absorption. SEDDSs typically produce
emulsions with a droplet size between few nanometers (100–300 nm) to several microns (<
5µm) while self micro emulsifying drug delivery systems (SMEDDS) form transparent
micro-emulsions with a droplet size of less than 50 nm. SEDDS are physically stable
formulations that are easy to manufacture, but when compared with emulsions, which are
metastable dispersed forms. The statistical Design of Experiments (DoE) matrix based multi
factor method is a systematic alternative to single variable experimentation which constructs
useful predictive model to optimize the levels of each critical variable and comes up with the
best possible (optimum) combination of excipients and the processes within the total
multidimensional experimental region. This is in contrast to the traditional one factor at a
time (OFAT) method of optimization which doesn’t take interaction and quadratic effects of
formulation or process variables into consideration and is generally based on trial-and-error
method. DoE is also used in testing robustness of the manufacturing process.[2] Hence, the
value of DoE for screening, investigating and optimizing experimental parameters,
minimizing operational cycle times, including time to obtain regulatory approval, and direct
cost saving cannot be disputed. In the present study, self emulsifying drug delivery system
(SEDDS) of atorvastatin calcium, a Biopharmaceutical Classification System (BCS) class II,
antihypertensive drug was chosen as a formulation system and 32 factorial designs, a
statistical DoE which uses response surface methodology (RSM) was used to understand and
optimize the formulation system. However, it is reported that the absolute bioavailability (F) of atorvastatin is 12% after a 40 mg oral dose.[3] The aim of the present research work was to
systematically investigate the main, interaction and the quadratic effects of formulation
variables (independent variables) of SEDDS on desired responses; and to develop a model
that would yield an optimized SEDDS of atorvastatin calcium. A 13 run 32 factorial design
with 2 factors and 3 levels, including 4 replicates at the centre point, was used for fitting a
2nd-order response surface. The estimation of the coefficients for the second order
polynomial model was performed by regression analysis and the model adequacy was
MATERIALS AND METHODS
Atorvastatin calcium was supplied by Goodman Pharmaceuticals (Pondicherry, India).
Capryol PGMC, transcutol HP, peceol, labrasol, labrafil M 1944 CS, labrafil M 2125 CS
were obtained as free gift samples from Gattefosse (Saint-Priest Cedex, France).Virgin
sesame oil, virgin coconut oil, olive oil, mustard oil, sunflower oil, rice bran oil and corn oil
were purchased from local market. The dialysis membrane of molecular mass cut off
12,000-14,000 daltons; pore diameter of 2.4 nm and dialysis membrane clips were purchased from
(Himedia Labs Pvt Ltd, Mumbai). All the other chemicals were of analytical reagent grade
and used as received without purification.
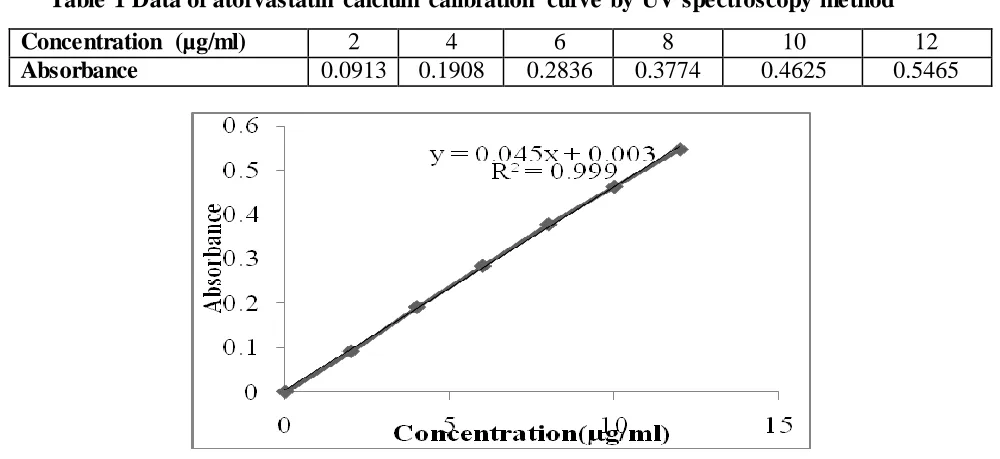
UV spectroscopy method: The standard plot of atorvastatin calcium in methanol with the
concentrations of 2, 4, 6, 8, 10, 12 µg/ml was measured at 247 nm by UV double beam
spectrophotometer (Shimadzu). The calibration equation for the standard plot was found to be
Y = 0.045x + 0.003 and the regression coefficient (R2 = 0.999) was used for all calculations.
[image:4.596.48.548.397.627.2]The results of the standard curve preparation are shown in Table 1 and Figure 1.
Table 1 Data of atorvastatin calcium calibration curve by UV spectroscopy method
Concentration (µg/ml) 2 4 6 8 10 12
Absorbance 0.0913 0.1908 0.2836 0.3774 0.4625 0.5465
Fig. 1 calibration curve of Atorvastatin Calcium
Screening of excipients
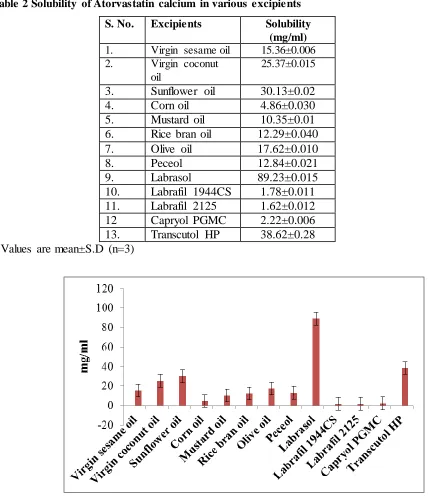
Solubility studies: The solubility of atorvastatin calcium in various oils, surfactants,
co-surfactants was measured using shake flask method.[4] An excess amount of Atorvastatin
calcium (approximately 200 mg) was added to 2 ml of each of vehicle in screw capped glass
at 300C in a thermostatically controlled shaking water bath, followed by equilibrium for 24
hr. Mixtures were then centrifuged at 3000 rpm for 10 min and the supernatant was filtered
through a millipore membrane filter (0.45μ). Samples were suitably diluted with methanol
and the final drug concentration was obtained by UV spectroscopic method at 247 nm. The
experiment was repeated in triplicates. The results are represented as mean value (mg/ml) ±
SD.
Construction of ternary phase diagram: Based on the results of saturation solubility
studies in Table 2, sunflower oil, labrasol and transcutol HP for atorvastatin calcium were
selected as oil, surfactant and co-surfactant respectively. The percentage limit of surfactant,
co-surfactant and oil used herein was selected by considering their acceptable safe dose and
decided on the basis of the requirements stated according to the lipid formulation
classification system introduced by Pouton.[5] A ternary phase diagram was constructed for
the system containing oil-surfactant-co-surfactant by Chemix School software version 3.51.
The grading method reported by Craig et al.[6] was modified and adopted in this study. A series of self emulsifying systems were prepared with varying weight percentage of oil,
surfactant and co-surfactant. Since the drug incorporated in the SEDDS may have some effect
on self emulsion boundary, every system in the series also consisted of 10% w/w for
atorvastatin calcium. The extreme and middle level of the independent variables consisting of
oil, surfactant and co-surfactant were selected for further study.
Preparation of SEDDS: Optimum ratios of oil and Smix were selected from the phase
diagrams. SEDDS formulations were prepared by dissolving the drug in Smix mixtures along
with gentle vortexing (vortex mixer-Spinix, Japan) and sonicating (bath
sonicator-B.N.Scientific Enterprise, India) and then by adding oil.[7] The effects of the formulation
variables for different batches were studied by preparing with each batch of SEDDS
formulation containing single dose of atorvastatin with varying amounts of oil and Smix
using 32 factorial designs as illustrated in Table 3. Then the final formulation was
equilibrated in water bath at 37°C for 48 h before carrying out the droplet size, polydispersity
index (PDI) and dissolution. The optimized formulations are prepared by the same method.
Experimental design- 32 full factorial design: A 32 full factorial design factor was used to explore and optimize the main effects, interaction effects and quadratic effects of the
Design-Expert software (version 10.0.2.0, Stat-Ease Inc., Minneapolis, U.S.A.) which are
summarized in Table 3a and Table 3b. The purpose of the replication was to estimate
experimental error and increase the precision by computing a model independent estimate of
the process standard deviation. The significant response factors studied for assessing the
quality of the SEDDS formulation were particle/globule size (Y1), drug loading (Y2).The data
obtained after the each response was fitted to quadratic polynomial model explained by the
following non linear equation Y = β0 + β1X1 + β2X2 + β12X1X2+ β1X12 + β2X22 + E. where Y
is the response of the dependent variables; β0–β2 are the regression coefficients; and X1, X2,
are independent variables. All the two responses were optimized by using the desirability
function approach by fixing the constraints in range and minimizing the particle size (Y1) and
maximizing the drug load (Y2).
Evaluation of prepared SEDDS
Self Emulsification, Drug precipitation, Phase Separation and Assessment of
emulsification time: The different compositions of self emulsifying drug delivery system
(SEDDS) were categorized on speed of emulsification, clarity, and apparent stability of the
resultant emulsion. Visual assessment was performed by drop wise addition of the
preconcentrate (SEDDS) into 100ml of distilled water. This was done in a glass beaker at
room temperature, and the contents were gently stirred with glass rod. Precipitation was
evaluated by visual inspection of the resultant emulsion after 24 hours. The formulations
were then categorized as clear transparent or transparent with bluish tinge (Grade I), bluish
white appearance (Grade II), bright white emulsion (Grade III), non clear dull grey white
emulsion with a slight oil appearance (Grade-IV), turbid appearance (Grade V), stable (no
precipitation at the end of 24 hours), or unstable (showing precipitation within 24 hours).
The emulsification time of SEDDS formulations was determined in a USP dissolution tester
Type II (Electrolab, India). The SEDDS formulation equivalent to single dose of the drug was
added drop-wise to 500 mL of distilled water maintained at 37 ± 0.5°C. Gentle agitation was
provided by a paddle rotating at 50 rpm. The emulsification time was recorded manually.[8]
The phase separation study was performed by subjecting the optimized formulation at
elevated temperature (50±2C) and centrifugation (Centrifuge-Eppendorff 5415D at 5000rpm
Spectroscopic characterization of optical clarity: Each SEDDS formulation equivalent to
single dose of atorvastatin calcium were diluted with 500 mL of distilled water. The
absorbance values of each emulsion at 0, 10, 20, and 30 min post-dilutions were measured by
a UV spectrophotometer (Shimadzu) at 400 nm.[9]
Turbidity measurement: The turbidity measurements in nephlometric turbidity unit (NTU)
were performed on the resultant emulsion stored in a screw capped sample vials using
turbidimeter (Elico D-10-model 331, Japan). 0.5 ml of the SEDDS formulation was
introduced into 250 ml of distilled water in 500 ml conical flask under action of magnetic
stirrer (Remi instruments) rotating at constant speed. The emulsification was done at room
temperature.[10]
Viscosity determination: The viscosity of the prepared SEDDS formulations as such
without being diluted was measured by Brookfield viscometer (Brookfield DV-III Ultra
Rheometer) using spindle C 16-1 at 25±0.5 ◦C.[11]
Cloud point measurement
The formulated SEDDS was diluted with 50ml water in a beaker which is placed on a water
bath with gradually increasing temperature until the diluted formulation turned cloudy. It
mainly insists about the stability of microemulsion at body temperature.[12]
Determination of refractive index
The clarity of microemulsion could be estimated by measuring the refractive index of the
formulations.[13] The SEDDS formulations were diluted 100 times with water. The refractive
index of the system was measured by an Abbe refractometer (Remi instruments) by placing 1
drop of solution on the slide and it compare with water.
Droplet size, zeta potential and polydispersity index (PDI) analysis
The mean droplet size, zeta potential and polydispersity index of formulations was
determined by using Malvern Nano Zeta sizer-90 (Malvern Instruments Ltd., Malvern, UK).
Light scattering was monitored at 25oC at a 90o angle.[14] The dispersed formulations were
measured after dilutions (1:100). Each determination was done in triplicate. Droplet size
distribution of all batches and the zeta potential of the final microemulsions were determined
Drug loading efficiency
The prepared SEDDS containing equivalent to one dose of the drug was added in 50ml
volumetric flask containing methanol and mixed well. The extracted solution was suitably
diluted and analyzed for its drug content using UV visible spectrophotometer.[15]
Drug loading efficiency= Amount of drug in known amount of formulation x 100 Initial drug load
In vitro dissolution studies for atorvastatin calcium
The optimized SEDDS formulations were filled into soft gelatin capsules and were stored at
room temperature for 24 h to allow complete solidification of the systems before use. The in vitro drug release[16] profiles of atorvastatin of SEDDS, plain atorvastatin, and marketed atorvastatin calcium tablet (Storvas 10mg Ranbaxy Laboratories Ltd) were studied using USP
dissolution apparatus II (Electrolab). The dissolution medium consisted of 900 mL of freshly
prepared pH 6.8 phosphate buffer maintained at 37 ± 0.5°C and the speed of the paddle was
set at 100 rpm. Capsules were held to the bottom of the vessel using copper sinkers. At
regular time intervals, 5 ml samples were withdrawn and replaced with equal volumes of
fresh medium to maintain the volume and sink conditions. Samples were then filtered using a
membrane filter (0.45 μm, Whatman) and drug concentration was obtained by UV
spectroscopic method at 247nm. All measurements were done in triplicate.
Stability Studies
The optimized SEDDS was stored under cold condition (4-8C) at refrigerator (Samsung),
room temperature and at elevated temperature (50±2C) at stability chamber (Humidity
chamber-Labtech). After every 1 month samples were analyzed for phase separation,
transparency, globule size% drug load.[17]
RESULTS AND DISCUSSIONS
Solubility Study
The solubility of the drug in the various vehicles is presented in Table 2 and figure 2.
Sunflower oil (30.13±0.02 mg/mL), labrasol (89.23±0.015 mg/ mL) and transcutol HP
(38.620±0.28 mg/mL) for atorvastatin calcium were chosen as oil (X1), surfactant and
Table 2 Solubility of Atorvastatin calcium in various excipients
S. No. Excipients Solubility (mg/ml) 1. Virgin sesame oil 15.36±0.006 2. Virgin coconut
oil
25.37±0.015
3. Sunflower oil 30.13±0.02
4. Corn oil 4.86±0.030
5. Mustard oil 10.35±0.01 6. Rice bran oil 12.29±0.040 7. Olive oil 17.62±0.010
8. Peceol 12.84±0.021
9. Labrasol 89.23±0.015
10. Labrafil 1944CS 1.78±0.011 11. Labrafil 2125 1.62±0.012 12 Capryol PGMC 2.22±0.006 13. Transcutol HP 38.62±0.28 * Values are mean±S.D (n=3)
Fig. 2 Solubility profile of atorvastatin calcium
The components used in the SEDDS formulations solubilize the maximum amount of the
drug which showed large self-emulsification domain in ternary phase diagram. Selection of
the vehicles was also done considering the safety and compatibility of the excipients with soft
gelatin capsule.
Construction of ternary phase diagram: The blue-shaded region in the ternary phase
diagram (Figure 3) represents the efficient self-emulsifying region where desired visual
rapidity and spontaneity of the emulsion formation. The range and level for each component
(independent variables) was selected as: oil (40–80%), surfactant (22.5–52.5%), co-surfactant
(7.5–17.5%) for atorvastatin as shown in Table 3. The red lines in the Figure 3 indicate the
boundary of the level used in the 32 factorial design study and the polygonal area bounded by
all the red lines indicate the region from which optimum formulation is to be selected. As the
water is always in considerable abundance and oil volume fraction is low, it was safely
supposed that only oil/water emulsion was formed, and no other dispersed and bicontinuous
[image:10.596.147.434.252.375.2]pseudophases were formed.
Fig. 3 Ternary phase diagram of Atorvastatin calcium
Blue-shaded region represents the self emulsifying domain and the red line indicates the
levels taken in the 32 factorial design.
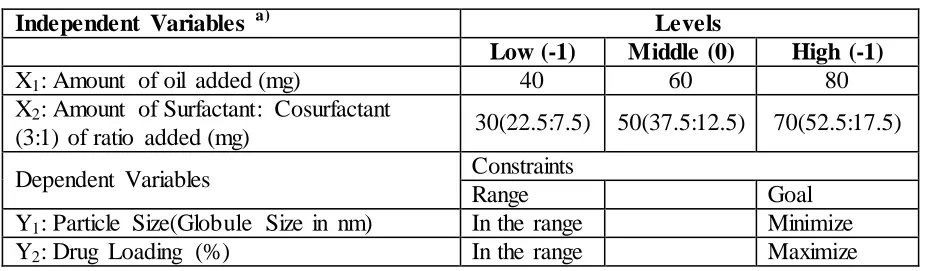
Table 3 Variables for atorvastatin calcium in 32 full factorial Design
Independent Variables a) Levels
Low (-1) Middle (0) High (-1)
X1: Amount of oil added (mg) 40 60 80
X2: Amount of Surfactant: Cosurfactant
(3:1) of ratio added (mg) 30(22.5:7.5) 50(37.5:12.5) 70(52.5:17.5)
Dependent Variables Constraints
Range Goal
Y1: Particle Size(Globule Size in nm) In the range Minimize
Y2: Drug Loading (%) In the range Maximize
a) Oil: Sunflower oil; Surfactant: Labrasol; Cosurfactant: Transcutol HP
Statistical analysis of the designed experiment
The range of oil (X1), Smix (X2) were delimited as independent variables; 32 full factorial
design was performed to optimize SEDDS with constraints on globule size and drug load as
[image:10.596.68.535.497.633.2]responses are summarized in Table 4. All the data were fitted to the second order quadratic
model and validation of the model was carried out by analysis of variance (ANOVA) test,
lack of fit test and correlation coefficient (R2). The significance of the ratio of mean square variation due to regression and residual error was tested using analysis of variance
(ANOVA). The ANOVA indicated a significant (P<0.05) effect of factors on response.
Various statistical evaluations of models for each response are depicted in the Tables 5 and
Table 6 for atorvastatin calcium. As shown in Table 5 at 5% significance level, it was
observed that for responses Y1, and Y2, quadratic fitting was significant (p-value <0.05). For
Y1 response of atorvastatin calcium the "Lack of Fit F-value" of 32.97 implies the Lack of Fit
is significant. There is only a 0.28% chance that a "Lack of Fit F-value" this large could occur
due to noise. For Y2 response of atorvastatin calcium response the lack of fit was The "Lack
of Fit F-value" of 1.93 implies the Lack of Fit is not significant and there is a 26.69% chance
that a "Lack of Fit F-value" this large could occur due to noise. While calculating the
correlation coefficient (R2) for the responses Y1, and Y2 the confidence that the regression
equations would predict the observed value better than mean were more than 83.22%, 93%,
respectively (Table 6) for atorvastatin calcium. The corresponding coefficients which showed
the quantitative effects of independent variables (X1, and X2) and their interactions on the
responses are shown in the Tables 7. The coefficients (Factor intercepts) (X1·X2,) and those
with the higher order terms (X12, X22) indicate the interactions and quadratic effects,
respectively. For all the models the predicted R2 value is reasonable agreement with the
Adjusted R2 value. Adequate precision values higher than 4 for all responses confirmed that
the predicted models can be used to navigate the design space defined by full factorial design.
A positive value represents an effect that favours the optimization and negative value
indicates an inverse relationship between the factor and response.
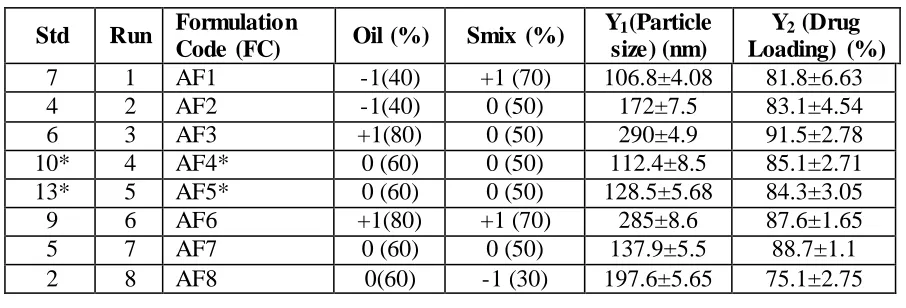
Table 4 Execution of 32 experimental design and coding of actual values of independent variables for factorial design with the observed responses for atorvastatin calcium
Std Run Formulation
Code (FC) Oil (%) Smix (%)
Y1(Particle
size) (nm)
Y2 (Drug
Loading) (%)
7 1 AF1 -1(40) +1 (70) 106.8±4.08 81.8±6.63
4 2 AF2 -1(40) 0 (50) 172±7.5 83.1±4.54
6 3 AF3 +1(80) 0 (50) 290±4.9 91.5±2.78
10* 4 AF4* 0 (60) 0 (50) 112.4±8.5 85.1±2.71
13* 5 AF5* 0 (60) 0 (50) 128.5±5.68 84.3±3.05
9 6 AF6 +1(80) +1 (70) 285±8.6 87.6±1.65
5 7 AF7 0 (60) 0 (50) 137.9±5.5 88.7±1.1
[image:11.596.72.525.622.776.2]8 9 AF9 0 (60) +1 (70) 233.1±3.44 86.1±4.37
3 10 AF10 +1 (80) -1 (30) 229.7±4.98 89.1±4.53
11* 11 AF11* 0 (60) 0 (50) 140.2±3.0 85.7±4.70
1 12 AF12 -1 (40) -1 (30) 415±8.7 70.1±2.25
12* 13 AF13* 0 (60) 0 (50) 114.9±7.1 86.9±1.21
[image:12.596.75.525.73.156.2]Y1: Particle size; Y2: Drug Load; *Centre point Formulations
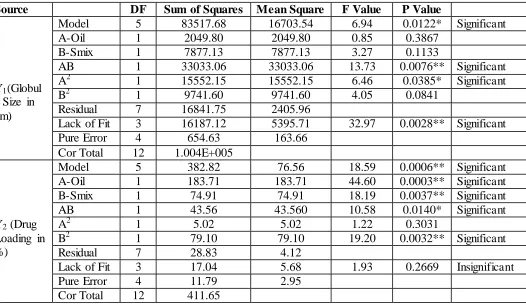
Table 5 Analysis of variance in the regression models for atorvastatin calcium
Source DF Sum of Squares Mean Square F Value P Value
Y1(Globul
e Size in nm)
Model 5 83517.68 16703.54 6.94 0.0122* Significant
A-Oil 1 2049.80 2049.80 0.85 0.3867
B-Smix 1 7877.13 7877.13 3.27 0.1133
AB 1 33033.06 33033.06 13.73 0.0076** Significant
A2 1 15552.15 15552.15 6.46 0.0385* Significant
B2 1 9741.60 9741.60 4.05 0.0841
Residual 7 16841.75 2405.96
Lack of Fit 3 16187.12 5395.71 32.97 0.0028** Significant
Pure Error 4 654.63 163.66
Cor Total 12 1.004E+005
Y2 (Drug
Loading in %)
Model 5 382.82 76.56 18.59 0.0006** Significant
A-Oil 1 183.71 183.71 44.60 0.0003** Significant
B-Smix 1 74.91 74.91 18.19 0.0037** Significant
AB 1 43.56 43.560 10.58 0.0140* Significant
A2 1 5.02 5.02 1.22 0.3031
B2 1 79.10 79.10 19.20 0.0032** Significant
Residual 7 28.83 4.12
Lack of Fit 3 17.04 5.68 1.93 0.2669 Insignificant
Pure Error 4 11.79 2.95
Cor Total 12 411.65
Table 6 Correlation coefficients for two responses for atorvastatin calcium
Quadratic
model R
2 Adjusted
R2
Predicted R2
Adequate
precision SD %CV
Y1 0.8322 0.7123 -0.5672 7.629 49.05 24.88
Y2 0.9300 0.8799 0.5375 16.864 2.03 2.41
Table 7 Factor coefficients and their corresponding p-values for atorvastatin calcium
Factors Y1 Y2
Coefficient P Value Coefficient P Value
Intercept 135.117 86.0862
X1 18.4833 0.3867 5.53333 0.0003**
X2 -36.2333 0.1133 3.53333 0.0037**
X1.X2 90.875 0.0076** -3.3 0.0140*
X12 75.0397 0.0385* 1.34828 0.3061
X22 59.3897 0.0841 -5.35172 0.0032**
[image:12.596.40.566.184.489.2]Analysis of variance for particle size (Y1) and % drug load (Y2) of Atorvastatin calcium
SEDDS: The observed values of particle size for 13 formulations (Table 4) varied from 106.8
nm to 415 nm and % drug load varied from 70.1% to 91.5% for atorvastatin calcium. The
polynomial quadratic equations for two dependent variables (particle size, % drug load) in
coded factors are obtained according the data of experimental design and parameters (Table
4) for factorial 13 formulations.
The equations derived for particle size and Percentage drug load for atorvastatin calcium
Y1 =135.12+18.48*X1-36.23*X2 +90.88*X1X2 + 75.04*X12 +59.39 *X22-Equation 1.
Y2= 86.09+5.53*X1+3.53*X2-3.30X1X2+1.35* X12-5.35* X22- Equation 2
The values of the coefficient X1, X2 were substituted in the equation to obtain the theoretical
values of Y. The above equations 1 indicate as the factor X2 increases the response Y1
decreases and is indicated by negative coefficient value of dependant variable in which the
Smix concentration is increased the particle size is decreased. The possible explanation is that
when the lower concentration of oil and higher concentration of Smix added facilitate the
increase in water penetration and the mixture become hydrophilic causing decrease in particle
size. The positive coefficient for independent value X1 indicates the positive effect on
dependent variable Y1 that increase in concentration of oil increases the particle size from
above equations 1. In equations 2 the positive coefficient for independent value X1 indicates
the positive effect on dependent variable Y2 that increase in concentration of oil increases the
% drug load.
3.3.1. Linear regression and residual plot analysis
The quality of fit of the model, residual plots and linear correlation plots of the observed
values verses the predicted values were depicted in Figure’s 4a, 4b, 4c, 4d of atorvastatin
calcium for responses Y1 and Y2. The plots showed the points fairly close to straight lines
indicating good model.
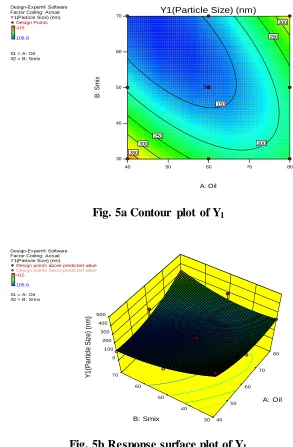
Contour plots and response surface analysis
The two-dimensional contour plot and the three-dimensional response surface plots are
graphical representations of the regression equation and express two independent variables at
once against the for Y1 and Y2 responses (Figure’s 5a, 5b, 6a, 6b for atorvastatin calcium)
which are useful to study the effect of the factors on the responses. The contour plots led to
Table 7 for atorvastatin calcium it can be seen that all independent variables showed
significant main effects interaction effects and the quadratic effect of X1 (p<0.05). For %
drug load; the most prominent effect being the amount of oil (X1) added (p=0.0003), the
Smix (X2) (p =0.0037), the interaction effect (p = 0.0140), and the quadratic effect (X12)
where p=0.0032 were found to be significant. For particle size the interaction effect was
found to be X1X2 being the amount of oil and Smix added (p = 0.0076) and the quadratic
effect of X1 was found to be significant (p= 0.0385). From Figure 5b it was clearly observed
when the level of Smix concentration was increased from low to high the response Y1
(particle size) was decreased. With the increasing surfactant (coefficient is negative) in the
formulation, droplet size decreased. Zhao et al., also reported similar effect of surfactant on the droplet size.[18] From Figure 6b it was illustrated that when the level of oil concentration
was increased from low to high the response Y1 (% drug load) was increased.
[image:14.596.341.491.332.504.2]Design-Expert® Software Factor Coding: Actual Y1(Particle Size) (nm)
Design Points
415
106.8
X1 = A: Oil X2 = B: Smix
40 50 60 70 80
30 40 50 60
70 Y1(Particle Size) (nm)
[image:15.596.140.433.77.524.2]A: Oil B : S m ix 150 200 250 250 300 300 350 5
Fig. 5a Contour plot of Y1
Design-Expert® Software Factor Coding: Actual Y1(Particle Size) (nm)
Design points above predicted value Design points below predicted value
415
106.8
X1 = A: Oil X2 = B: Smix
[image:15.596.235.434.82.263.2]30 40 50 60 70 40 50 60 70 80 0 100 200 300 400 500 Y 1 (Par tic le S iz e ) (n m ) A: Oil B: Smix
Fig. 5b Response surface plot of Y1
Design-Expert® Software Factor Coding: Actual y2(Drug Loading) (%)
Design Points
91.5
70.1
X1 = A: Oil X2 = B: Smix
40 50 60 70 80
30 40 50 60
70 y2(Drug Loading) (%)
A: Oil B : S m ix 75 80
85 5 90
[image:15.596.233.429.555.727.2]Design-Expert® Software Factor Coding: Actual y2(Drug Loading) (%)
Design points above predicted value Design points below predicted value
91.5 70.1
X1 = A: Oil X2 = B: Smix
[image:16.596.148.427.82.243.2]30 40 50 60 70 40 50 60 70 80 65 70 75 80 85 90 95 y2 (D ru g Lo ad in g) ( % ) A: Oil B: Smix
Fig. 6b Response surface of Y2
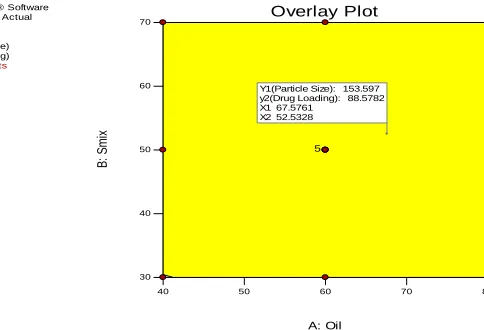
Optimization by using desirability function
The model polynomial equations was generated to relate the dependent and independent
variables, the process was optimized for all two responses simultaneously by using
desirability function..The optimum formulation was selected based on the criteria of attaining
the constraints of variables responses. The global desirability value was calculated by
combining all the individual desirability functions as the geometric mean by using extensive
grid and feasibility search over the domain. The suggested optimized formulation for
atorvastatin calcium consisted of 67.586% oil, 52.529% Smix with the corresponding
desirability (D) value of 0.856 and the predicted response as Y1=153.651nm, Y2= 88.582.
Four batches of the optimized formulations were prepared to validate the model adequacy for
the prediction, and all the responses were evaluated for each formulation (Table 8). It can be
concluded that the experimental values were in close agreement with predicted values,
indicating the success of the design to evaluate and optimize the SEDDS formulation. The
overlay plot for two response values is illustrated in Figure 7.
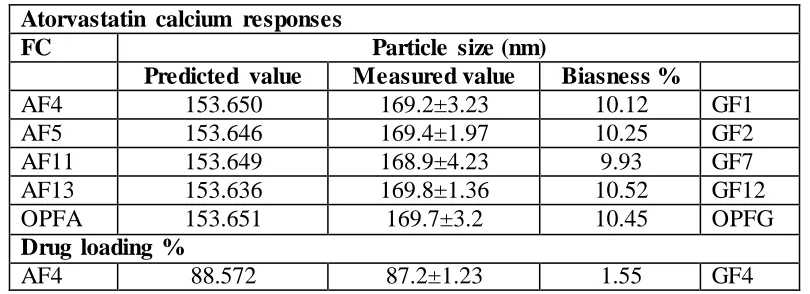
Table 8 Predicted and measured values of Responses and corresponding biasness
Atorvastatin calcium responses
FC Particle size (nm)
Predicted value Measured value Biasness %
AF4 153.650 169.2±3.23 10.12 GF1
AF5 153.646 169.4±1.97 10.25 GF2
AF11 153.649 168.9±4.23 9.93 GF7
AF13 153.636 169.8±1.36 10.52 GF12
OPFA 153.651 169.7±3.2 10.45 OPFG
Drug loading %
[image:16.596.96.501.613.760.2]AF5 88.571 87±2.18 1.77 GF4
AF11 88.584 86.9±3.24 1.90 GF5
AF13 88.586 87.1±2.27 1.68 GF11
OPFA 88.582 87.2±2.25 1.57 OPFG
Biasness %= (predicted value-measured value) ×100/predicted value.
Design-Expert® Software Factor Coding: Actual Overlay Plot
Y1(Particle Size) y2(Drug Loading)
Design Points
X1 = A: Oil X2 = B: Smix
40 50 60 70 80
30 40 50 60
70 Overlay Plot
A: Oil
B
:
S
mi
x
5 Y1(Particle Size): 153.597 y2(Drug Loading): 88.5782 X1 67.5761
[image:17.596.186.428.172.337.2]X2 52.5328
Fig. 7 Overlay plot for atorvastatin calcium SEDDS
Self emulsification, drug precipitation assessment of emulsification time studies
In the study formulations AF4, AF5, AF11, AF13 and OPFA (optimized formulation) there
was good stability without any signs of drug or excipient precipitation or phase separation
and the results are shown in Table 9.The emulsification time studies showed (Table 10)
[image:17.596.94.504.521.742.2]indicated the spontaneous emulsification for all formulations.
Table 9 Self emulsification and drug precipitation of atorvastatin calcium SEDDS
Formulation Code Visibility grade Phase separation Precipitation
AF1 IV + ++
AF2 III + ++
AF3 IV + ++
AF4* I X XX
AF5* II X XX
AF6 III + ++
AF7 IV X ++
AF8 V + ++
AF9 III + ++
AF10 IV + ++
AF11* I X XX
AF12 III + ++
AF13* II X XX
OPFA I X XX
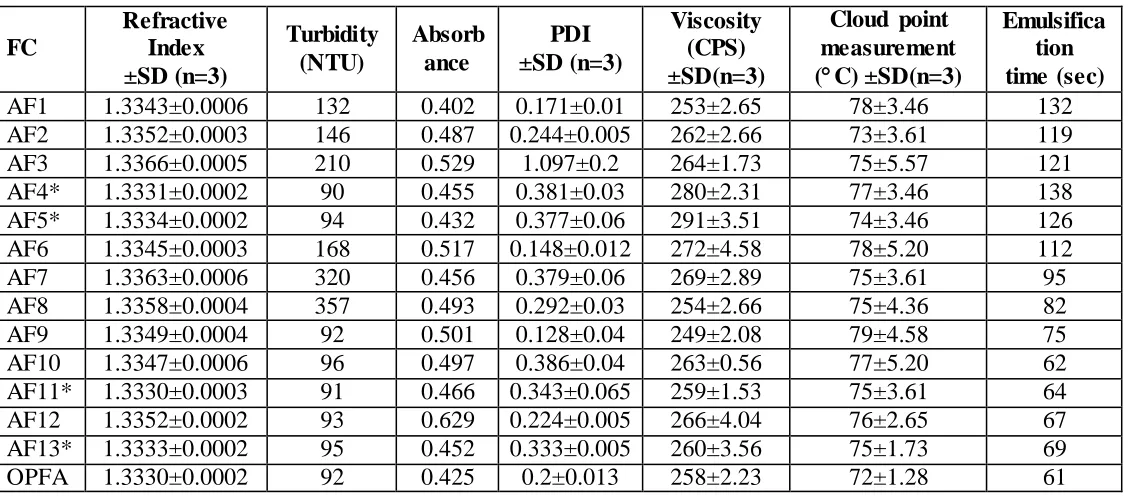
Table 10 Refractive index, turbidity, optical clarity, polydispersity index, viscosity,
cloud point measurement and emulsification time of SEDDS formulations of
atorvastatin Calcium
FC
Refractive Index ±SD (n=3)
Turbidity (NTU)
Absorb ance
PDI ±SD (n=3)
Viscosity (CPS) ±SD(n=3)
Cloud point measurement
(C) ±SD(n=3)
Emulsifica tion time (sec)
AF1 1.3343±0.0006 132 0.402 0.171±0.01 253±2.65 78±3.46 132
AF2 1.3352±0.0003 146 0.487 0.244±0.005 262±2.66 73±3.61 119
AF3 1.3366±0.0005 210 0.529 1.097±0.2 264±1.73 75±5.57 121
AF4* 1.3331±0.0002 90 0.455 0.381±0.03 280±2.31 77±3.46 138
AF5* 1.3334±0.0002 94 0.432 0.377±0.06 291±3.51 74±3.46 126
AF6 1.3345±0.0003 168 0.517 0.148±0.012 272±4.58 78±5.20 112
AF7 1.3363±0.0006 320 0.456 0.379±0.06 269±2.89 75±3.61 95
AF8 1.3358±0.0004 357 0.493 0.292±0.03 254±2.66 75±4.36 82
AF9 1.3349±0.0004 92 0.501 0.128±0.04 249±2.08 79±4.58 75
AF10 1.3347±0.0006 96 0.497 0.386±0.04 263±0.56 77±5.20 62
AF11* 1.3330±0.0003 91 0.466 0.343±0.065 259±1.53 75±3.61 64
AF12 1.3352±0.0002 93 0.629 0.224±0.005 266±4.04 76±2.65 67
AF13* 1.3333±0.0002 95 0.452 0.333±0.005 260±3.56 75±1.73 69
OPFA 1.3330±0.0002 92 0.425 0.2±0.013 258±2.23 72±1.28 61
Spectroscopic characterization of optical clarity
As shown in Table 10 the absorbance of the studied aqueous dispersion of atorvastatin
calcium SEDDS varied between 0.402 to 0.629 which indicated that optically clear and oil
droplets are thought to be in a state of finer dispersion.
Turbidity measurement
The turbidity of SEDDS was performed determined as per procedure and turbidity for all
formulations were found to below 100 NTU which shows the stability of SEDDS and the
results were shown in Table10.
Viscosity determination
From viscosity determination, it was observed that as the concentration of oil increased
viscosity of formulations decreased (Table10). Overall, the viscosity of the undiluted liquid
SNEDDS was found less than 10,000 cps; it implied that the developed SEDDS can be filled
in soft gelatin capsules.
Cloud point measurement
All the formulations were found to be below 80C and the cloudiness formed above the body
temperature of above 37C which inferred that without any precipitation of drug the SEDDS
[image:18.596.19.592.132.381.2]Determination of refractive index
It can be seen from the Table 10 the refractive index of the majority of the prepared
formulations have similar values as that of distilled water (1.3330±0.0002 n.d.) at 28 ± 0.5°C
were found to be clear as water (Table10).
Droplet size, zeta potential and polydispersity index (PDI) analysis
The PDI for all SEDDS formulations was found to be below 0.5 which found to be uniform
size distribution. Among the formulations the optimized atorvastatin calcium SEDDS was
found to have a mean globule size of 169.7nm (Figure 8) with a PDI 0.2, and zeta potential
-31.8mV. The higher Zeta potential of optimized SEDDS indicates that microemulsion was
[image:19.596.140.464.307.559.2]stable.
Fig. 8 Particle size of atorvastatin calcium SEDDS
Drug loading
The drug loading for optimized formulation of atorvastatin calcium was found to be 87.2%
respectively. It was clearly inferred increase in Smix concentration enhances maximum drug
load in SEDDS.
In vitro dissolution studies
powder and marketed tablet as shown in the Table 11 and Figure 9. It could be suggested that
spontaneous micro-emulsification resulted in the faster rate of drug release into the aqueous
[image:20.596.31.564.164.532.2]phase in the form of small and mono dispersed droplets.[19])
Table 11 Cumulative percent release of atorvastatin calcium from various formulations
Time
in min AF1* AF5* AF11* AF13*
OPFA
SEDDS Pure Drug
Marketed product
0 0 0 0 0 0 0 0
5 21.56±0.69 22.89±0.88 23.45±0.59 24.56±1.25 26.21±0.74 5.69±1.24 18.21±2.03 10 34.58±2.08 31.56±0.63 33.46±1.28 32.45±0.19 39.3±0.23 7.56±0.75 24.23±1.12 20 48.56±1 49.33±2.02 48.59±0.56 49.53±0.73 58.36±0.45 11.22±1.12 36.33±2.21 30 68.23±1.59 66.52±1.94 65.56±1.50 67.87±0.22 72.66±0.32 13.45±1.23 42.54±1.64 40 77.89±1.38 76.26±0.55 75.62±1.20 74.66±0.16 79.5±0.18 16.23±1.56 45.62±0.54 50 79.98±1.27 79.56±1.16 78.32±1.30 79.98±0.02 86.72±0.16 19.21±2.73 48.74±2.21 60 83.26±2.74 84.21±1.48 83.36±0.17 82.63±0.44 91.3±0.55 22.34±1.23 53.69±1.72 75 85.27±1.78 87.24±2.55 86.48±0.56 85.56±1.22 94.5±0.49 24.86±0.62 58.66±1.54 90 93.45±1.30 92.16±0.72 93.28±1.13 94.56±0.44 99.75±0.31 25.64±1.26 62.31±1.18
Fig. 9 Percentage cumulative drug release of various formulations.
Kinetic modeling and mechanism of drug release of optimized formulations
The dissolution data of optimized formulations OPFA showed first order release kinetics with
higher correlation coefficient R2-0.9848 for atorvastatin calcium as shown in Table 12. In vitro release kinetics data were computed using DD solver, which is an excel plug-in module and the resultant data were fitted to the Korsmeyer-Peppas exponential equation to establish
the mechanism of drug release. The exponent n has been proposed as indicative of the release
mechanism. The ‘n’ values for OPFA was found to be 0.406 which suggested that drug
[image:20.596.28.568.166.534.2]Table 12: Release kinetic study of optimized formulations for atorvastatin calcium
FC Zero order
kinetic R2
First order kinetic R2
Higuchi Kinetic R2
Korsemeyer-Peppas
R2 n value
OPFA 0.9569 0.9848 0.9366 0.9701 0.406
Stability studies: The optimized formulations (OPFA) for atorvastatin calcium were found to
be stable for 6 months and there was no significant change in the drug loading and particle
[image:21.596.66.534.244.372.2]size as given in Table 13.
Table 13 Stability studies of optimized atorvastatin calcium SEDDS formulations
Temperature (C)
Particle Size (nm) % Drug Load
After 1 month
After 6 month
After 1 month
After 6 month Cold Temperature (2 -8C) 173±2.23 176± 1.23 87.2±1.33 83.7±1.89 Room Temperature
(25±2C) 169.7±1.85 171.7±0.86 88.9±2.24 86.2±2.65
Elevated
Temperature(50±2C) 170±2.35 175.6±1.56 85.9±1.42 81.9±2.78 Data expressed as mean ± SD, n=3
CONCLUSION
In this present work the influence of formulation factors (Oil and Smix) on two responses of
particle size and loading were studied using 32 factorial design. The two factors showed
significant effect on two responses. The optimized formulation of atorvastatin calcium
SEDDS was developed which contain sunflower oil as oil phase, labrasol as a surfactant and
transcutol HP as cosurfactant ( Smix) in the ratio of 67.586%, oil and 52.529% %w/w Smix
with lower droplet size (169.7nm), PDI (0.2), and Zeta potential (-31.8 mV) and % drug load
(87.2%) values. The in vitro drug release from optimized Atorvastatin SEDDS formulation was found to be 99.75% after 90 min which was extremely higher in comparison to the
marketed formulation and pure drug. It was concluded that the smaller particle size with
maximum drug load more the release of drug which results in better bioavailability. The
results further concluded that SEDDS can be explored as a potential drug carrier for
dissolution enhancement of atorvastatin calcium and other poorly soluble drugs.
ACKNOWLEDGEMENT
Authors are thankful for providing the gift samples of excipients from M/s Gattefosse,
REFERENCES
1. Shah N H, Carvajal M T, Patel C I, Infeld M H, Malick AW. Self-emulsifying drug
delivery systems (SEDDS) with polyglycolyzed glycerides for improving in vitro
dissolution and oral absorption of lipophilic drugs. Int J Pharm, 1994; 106: 15–23.
2. Anderson M J, Whitcomb P J, DOE simplified-practical tools for effective
experimentation. 2nd ed., Productivity Press, New York, 2007.
3. Dahan A, Hoffman A. Pharm. Res. 2006; 23: 2165–2174.
4. Wei Wu, Yang Wang, Li Que. Enhanced bioavailability of silymarin by self
microemulsifying drug delivery system European Journal of Pharmaceutics and
Biopharmaceutics. 2006; 63: 288–294.
5. W C Pouton and J H C. Porter. Formulation of lipid-based delivery systems for oral
administration: Materials, methods and strategies. Adv. Drug Deliver. Rev. 2008; 60:
625–637. DOI: 10. 1016/j.addr.2007.10.010.
6. Craig D Q M, Barker S A, Banning D, Booth S. W. Int. J. Pharm. 1995; 114: 103–110.
7. Chouksey R, Pandey H, Jain AK, Soni H, Saraogi GK. Preparation and evaluation of the
self-emulsifying drug delivery system containing atorvastatin HMG-CoA inhibiter. Int J
Pharm Pharm Sci. 2011; 3: 147–152.
8. Mei X, Etzler FM, Wang Z. Use of texture analysis to study hydrophilic solvent effects
on the mechanical properties of hard gelatin capsules. Int J Pharm. 2006; 324: 128–135.
http://dx.doi.org/10.1016/j.ijpharm.2006.06.01.
9. Subramanian N, Ray S, Ghosal SK, Bhadra R, Moulik SP. Formulation Design of
Self-Microemulsifying Drug Delivery Systems for Improved Oral Bioavailability of
Celecoxib. Biol Pharm Bull. 2004; 27: 1993–1999.
http://dx.doi.org/10.1248/bpb.27.1993.
10.Balakrishnan P., Lee B J, Oh D H, Kim J O, Hong M.J, Jee J.P, Kim J.A, Yoo B.K, Woo
J.S, Yong CS and Choi H.G. Enhanced oral bioavailability of coenzyme Q10 by a novel
solid self-emulsifying drug delivery system. Int J Pharm. 2009; 374: 66-72.
11.Parmara N, Singlab N, Amina S, Kohlia K.Study of cosurfactant effect on
nanoemulsifying area and development of lercanidipine loaded (SNEDDS) self
nanoemulsifying drug delivery system. Colloids and Surfaces B: Biointerfaces 2011; 86:
327–338.
12.Zhao Y,Wang C,Chow AH. Self nanoemulsifying drug delivery system (SNEDDS) for
oral delivery of Zedory Essential oil: Formulation and bioavailability studies. Int.J.Pharm.
13.Vipul Rokad, Chirag Nagda, Dhruti Nagda. Design and evaluation of solid
self-emulsifying drug delivery system of rosuvastatin calcium. Journal of Young Pharmacists
Jul-Sep 2014; 6(3): 37-45.
14.Kim J Y, Young, S K. Enhanced absorption of Indomethacin after oral or rectal
administration of Self emulsifying system containing Indomethacin torats, Int.J.Pharm,
2000; 194: 81- 89.
15.Harshal DM, Tanvir S, Dheeraj B, Rajendra DW. Design and development of Solid
micro -emulsifying drug delivery system (SMEDDS) of Fenofibrate. Int J Pharm Pharm
Sci. 2011; 3(4): 163-166.
16.Zakia Belhadj, Suyang Zhang, Wenli Zhang, Junlin Wang. Formulation Development and
Bioavailability Evaluation of a Self-nanoemulsifying Drug Delivery System (SNEDDS)
of Atorvastatin Calcium. International Journal of Pharmaceutics. ISSN: 2051-5782;
29(1): 1103- 1113.
17.Ajith S Narang, David Delmarre, Danchen Gao. Stable drug encapsulation in micelles
and microemulsions. International journal of Pharmaceutics. 2007; 345(1-2): 9-25.
18.Zhao Y., Wang C., Chow A. H. L., Ren K., Gong T., Zhang Z., Zheng Y., Int. J. Pharm.