warwick.ac.uk/lib-publications
Manuscript version: Author’s Accepted Manuscript
The version presented in WRAP is the author’s accepted manuscript and may differ from the
published version or Version of Record.
Persistent WRAP URL:
http://wrap.warwick.ac.uk/131595
How to cite:
Please refer to published version for the most recent bibliographic citation information.
If a published version is known of, the repository item page linked to above, will contain
details on accessing it.
Copyright and reuse:
The Warwick Research Archive Portal (WRAP) makes this work by researchers of the
University of Warwick available open access under the following conditions.
Copyright © and all moral rights to the version of the paper presented here belong to the
individual author(s) and/or other copyright owners. To the extent reasonable and
practicable the material made available in WRAP has been checked for eligibility before
being made available.
Copies of full items can be used for personal research or study, educational, or not-for-profit
purposes without prior permission or charge. Provided that the authors, title and full
bibliographic details are credited, a hyperlink and/or URL is given for the original metadata
page and the content is not changed in any way.
Publisher’s statement:
Please refer to the repository item page, publisher’s statement section, for further
information.
An Evolutionary Approach to the Optimisation of
Autonomous Pod Distribution for Application in an
Urban Transportation Service
Roger Woodman
WMGUniversity of Warwick Coventry, United Kingdom [email protected]
William Hill
School of EngineeringUniversity of Warwick Coventry, United Kingdom
Stewart Birrell
WMGUniversity of Warwick Coventry, United Kingdom
Matthew D. Higgins
WMGUniversity of Warwick Coventry, United Kingdom
Abstract—For autonomous vehicles (AVs), which when de-ployed in urban areas are called “pods”, to be used as part of a commercially viable low-cost urban transport system, they will need to operate efficiently. Among ways to achieve efficiency, is to minimise time vehicles are not serving users. To reduce the amount of wasted time, this paper presents a novel approach for distribution of AVs within an urban environment. Our approach uses evolutionary computation, in the form of a genetic algorithm (GA), which is applied to a simulation of an intelligent transporta-tion service, operating in the city of Coventry, UK. The goal of the GA is to optimise distribution of pods, to reduce the amount of user waiting time. To test the algorithm, real-world transport data was obtained for Coventry, which in turn was processed to generate user demand patterns. Results from the study showed a 30% increase in the number of successful journeys completed in a 24 hours, compared to a random distribution. The implications of these findings could yield significant benefits for fleet management companies. These include increases in profits per day, a decrease in capital cost, and better energy efficiency. The algorithm could also be adapted to any service offering pick up and drop of points, including package delivery and transportation of goods.
Index Terms—autonomous vehicles, intelligent transportation systems, fleet management
I. INTRODUCTION
The primary aim of a vehicle fleet management system is to maximise the utilisation of the fleet, while minimising cost. This means balancing a number of objectives on how the fleet should operate. These objectives can be complimen-tary, such as minimising unnecessary travelling and reducing environmental impact. Or opposing, such as transporting users quickly and maximising vehicle battery life. One problem area, which can serve to both reduce costs and user waiting times, is the vehicle distribution strategy used. The problem of distributing resources, is a fundamental question that falls into the realm of operational research. In the application of designing routes for a set of load carrying vehicles to service a set of dispersed customers at the least cost, this is known as the vehicle routing problem (VRP) [1]. There are a number of optimisation strategies that have been developed for this
problem, many of which focus on route selection methods that optimise a particular factor, such as truck loading capacity, distance travelled, and fuel used [2].
Attempts to review and classify solutions for route optimi-sation with dynamic requests is made in [3]. It is stated that there are two broad categories of routing solutions for dynamic requests. These are, “fast local update procedures” and “re-optimisation procedures”. Both are originality algorithms for a static case, adapted into ones that could be applied to dynamic routing problems, where new requests appear in transit. Adap-tation of the static algorithms into dynamic algorithms can be done by simply applying a static optimisation algorithm every time a new request is made, or through the use of fast local update procedures. The fast local update is good for quickly identifying possible routes, while the re-optimisation is good for providing good quality solutions [4]. The advantages of both has resulted in the development of hybrid algorithms, which run the local update procedure when a new request is received, then performs re-optimisation to improve the results [5]. This strategy of re-optimisation can be implemented as a rolling time horizon, to find the optimal distribution at different intervals throughout the day [6].
The problem of forecasting demand is explored by [7]. The researcher here uses data obtained from Uber about their pick up and drop off times. A range of techniques are then used to fit this data to a model. The model used with the highest success is called Facebook Prophet, an open source tool for modelling time-series data [8]. This model allowed the use of geographical data in order to improve the demand predictions. To do this the New York City subway locations and activity times were used as well as the CityBike service. It was shown that by incorporating temporal and geographical data it significantly improved the results of the model.
then run to optimise the routing. The main difference with this method and that proposed, is in the formulation of the problem. This is done through creating a set of mathemati-cal equations to define the problem. This strategy is mathemati-called dynamic programming, which is a mathematical technique that can be used to optimise a particular function through splitting it into sub functions that can be recursively optimised [10]. The recursive nature of the solution is what separates it from the other common optimisation technique of linear programming. The solution is essentially a chain of decisions that can be made where each successive decision is based on the current state and the decisions that led to it. This is a widely used optimisation technique to tackle the problem of route planning in a dynamic environment [11]. However, the process of formulating the problem is a complex one and is less flexible than a GA for our purposes.
The use of GAs in combination with dynamic programming is explored by [12]. The researches here attempt to solve the issue of trucks being under-loaded by optimising the routes they take. The way this is done is through first creating a dynamic programming model then using a GA to solve it. Specifically, a distributed GA is used. This is a method by which this works is through running the GA on several processors using threading. Each core gets a subset of the chromosomes being evaluated with the information about the successful chromosomes being exchanged after a certain number of generations. This allows the GA to be run faster.
The research presented in this paper is part of a larger Innovate UK funded project called SWARM, which is a collaboration between WMG, RDM Ltd and Milton Keynes Council. The project aims to implement group intelligence in self driving pods [13]. This is for application as a means of paid transportation in cities. An integral part of this service requires the optimisation of pod distribution in the selected city such that more successful journeys are carried out. The aim of this project is to use a form of evolutionary computation to solve this problem for application in Coventry, UK.
This paper makes a contribution to the literature by pre-senting a novel approach to optimising AV distribution using historical data of user demand. This is an important area of research in the field of AV transport, as reducing passenger journey times and making the system more efficient compared to other transport modes, is essential for successful adoption.
II. METHODOLOGY
A. Experimental Platform
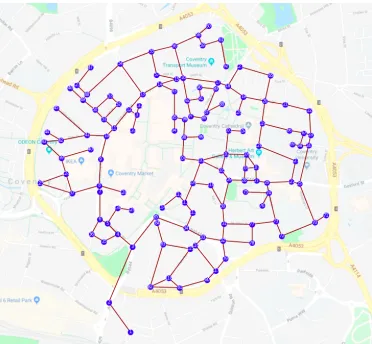
[image:3.612.345.531.49.221.2]To test the proposed fleet distribution optimisation algo-rithm, a simulation software tool called the “Fleet Visualiser”, developed at WMG, was used (Fig. 1). This software tool, created using the Python programming language, allows an aerial image of any location e.g. city, airport, university campus, to be loaded and a schematic transport map to be constructed by the user. The map is constructed as a series of nodes and edges to form a directed graph, which can be placed at a pixel level. Therefore, the detail of the route is based on the resolution of the image used. The Fleet Visualiser, allows
Fig. 1: Map of Coventry city centre overlaid with a directed graph made up of several nodes and edges
for simulation of multiple vehicles and is capable of simulating movement of vehicles faster than real-time. The speed at which the simulator operates is determined by multiple factors, including the size of map, the number of vehicles and available computing power. The vehicles are bound by the route, which is internally represented as a graph network.
B. Distribution Optimisation Algorithm
The distribution optimisation algorithm proposed in this paper is based on a GA. Although other techniques were considered, such as dynamic programming, it was thought an evolutionary computational approach would be more flexible and better suited to the task of optimising vehicle distribution. An explanation for the structure of GAs is given in [14]. As this details, a GA is a stochastic search method that imitates natural selection to evolve and optimise the objective given. The formulation of a GA is individual to the problem at hand, especially when it comes to encoding and decoding. The steps involved can be summarised as follows:
1) Represent problem variables as a chromosome of fixed length. Choose number of chromosomes in the genera-tion, crossover probability, and mutation probability 2) Define fitness function that returns a measure of
chro-mosome performance. This will affect the probability that traits are passed onto future generations
3) Randomly generate the first generation
4) Calculate fitness of each chromosome in the generation 5) Use a selection algorithm that favours chromosomes
with higher fitness as parents to new chromosomes 6) Apply mutation / crossover operators to offspring
chro-mosomes in accordance with respective probabilities 7) Place the offspring in the new generation
losing any advantage posed by their position. To overcome this, we used a strategy where the number of pods in each region are allocated at the start of the simulation. This then become the target number of pods that each region should contain. Therefore, the method proposed in our study, is to determine the pod distribution pattern at the start of each day and use this to determine where pods should be first located and then subsequently returned when not servicing users.
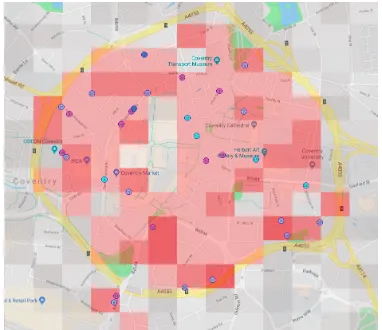
In order to divide the map into regions that could be encoded for the GA, a uniform grid was placed over the pod route area. Each cell of this grid represents a location that can be allocated a predefined target number of pods. This cell target value is specified as a percentage of the total pods in service, and is based on the predicted user demand for different parts of the route for a given day. An example of this grid overlaid on a map of Coventry is provided in Fig. 2. This shows an optimised pod distribution, with the more intense cells representing a higher target value.
To maintain the target values in each cell, the pods contin-ually transmit their current location, status, and planned route, to all other pods in the fleet. When a pod finishes servicing a user, it will look at the map and calculate which cells have the lowest percentage of their target. The pod will then move to the nearest cell, which has not reached its target, taking into account where other unused pods are travelling to, in order avoid exceeding the cell target value.
[image:4.612.364.514.49.185.2]1) Encoding: The main challenge in programming a GA is that of encoding the chromosome. A badly encoded algorithm could result in changing the question, or the objective of the algorithm, and therefore optimise into a different direction to what is desired [15]. An initially intuitive way to encode the GA would be to have a string of genes that would represent each node of the map. The gene would then contain the number of pods allocated to that particular node. This could then be altered by the algorithm as each generation is created. The problem with this encoding scheme is that it does not allow for mutation or crossover. Randomly changing a value
[image:4.612.79.270.518.683.2]Fig. 2: Example of an optimised distribution represented as a heat map overlaid on the city map
Fig. 3: Structure of the chromosome and crossover / mutation processes. Each gene represents a pod, with the value assigned to the gene representing a cell of the map grid
in the gene may result in the number of pods in the gene increasing, which will mean the total number of pods in the chromosome exceeds the number available. For this reason we used an encoding scheme whereby each gene represented a pod in the simulation (see Fig. 3). The value assigned to that gene indicates a cell in the map where the pod will be located. The number of pods we used was 30, therefore each chromosome contained this number of genes. The number of cells in the map was 182, therefore, each gene could be assigned a value from 1 to 182. For each simulation run, the GA will generate a chromosome. In the first generation this will be a random distribution, with later generations based on fitness. The simulation will then read this chromosome value, and on generation of the fleet, will assign each pod to its allocated region. The regions will then count how many pods have been assigned to them when all pods have been allocated. This will become the target. This encoding scheme works well for the GA as mutations and crossovers will solely affect the region to which a pod is assigned. This method ensures that the total number of available pods cannot be exceeded, as that would require a change in the chromosome array length.
2) Fitness Function and Algorithm Objective: The objec-tive of the GA is based on the requirements of the SWARM project [16]. A key requirement, identified by the potential users of the system, is that a journey duration, from the time of a request being made, to the passenger completing their journey, is completed in half the time it would take to walk the same route. This time is based on an average walking speed, specified by Transport for London (TfL), of 4.8 km/h [17]. Therefore, reducing the time it takes for a pod to reach a user, would in turn reduce total journey duration. This criteria was used to determine if a journey was considered successful or not. The percentage of successful journeys completed in a set period was used as the measure of fitness for each chromosome in the population. Once the GA has run every simulation in the generation, each fitness will be normalised by dividing the values by the sum of the fitnesses in the generation.
be selected if they have a higher fitness in the generation. This weighted selection is done through the use of a roulette selector. This was implemented in this program through each chromosome in the generation being given a number of slots in an array based on the normalised fitness. A random element is then selected from this array, which becomes the parent chromosome. For each offspring, this is done twice to select two parents. The probabilities allocated to the crossover and mutation process are then used to determine if those processes should be carried out on the two chromosomes. If neither processes are performed, the offspring are simply a copy of their parents. Two offspring are produced by each pair of parent chromosomes. This is repeated until the new generation contains the same number of chromosomes. The GA continues this process in a loop, gradually improving the performance of the population. To prevent the GA running forever, an appropriate stopping criteria must be used to avoid reaching a local optimum. Based on a number of tests, we found that 200 was an appropriate maximum number of generations.
C. Real-world Data Set
To validate our proposed distribution method, we required real-world data. For our study we chose Coventry City centre, as it was a well known area to the team, had transport data available, and was naturally enclosed due to a encircling ring-road. The map data, including an image of the transport route and precise scale information, was sourced from Open-StreetMap (OSM) and vehicle data from the Department of Transport (https://roadtraffic.dft.gov.uk/local-authorities/152). The data is formed of vehicle counts at several points in the city, categorised by vehicle type, over a 10 year period.
To make the optimisation case closer to reality, a user request scheduler was created that attempted to represent real demand patterns. This scheduler used readings from the last 10 years of traffic counts, and averaged each hour of the recording day. This created a basic week day traffic pattern around the city. A function was fitted to this pattern using linear regression to produce a work day demand. This demand pattern was used to determine the number of new user request batches. These requests were generated at 10 minute intervals and sent directly to the nearest unused pod in relation to the user.
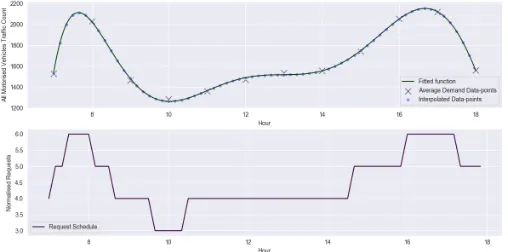
The procedure for converting traffic data to user demand, first involved splitting the work day into time points, with 10 minute intervals. The function generated by the linear regression was then used to extract the estimated average number of vehicles at different points in the city at this time. These values were then normalised by dividing each value by the sum of total requests in the day. The reason this was done is to allow each value to be multiplied by the desired total number of requests in the day. Effectively this value reflects how much the service has been accepted as a mode of transport. The request schedule produced is shown in Fig. 4.
[image:5.612.312.566.51.177.2]The simulation was run for a simulated 24 hour period to see how the distribution target generated by the GA performs. A fleet size of 40 pods was used, as this was found to be a sufficient number to serve the users for the request interval
Fig. 4: User demand pattern. Top: Interpolated points ated using linear regression. Bottom: Request schedule gener-ated through normalising the interpolgener-ated points
used and the city size. It is understood that using a larger fleet size would reduce the waiting times for users and increase the number of users served. However, the aim of the research at this stage is to develop strategies for vehicle distribution, and not to optimise the number of vehicles required.
III. RESULTS ANDDISCUSSION
To verify that the algorithm was operating as expected, we chose to visualise the distribution pattern as a heat map. Defining what is a good heat map, as opposed to what is a bad heat map, is a challenge. This is due to the nature of the problem that we are trying to solve. While we would expect that if every requests is coming from the same cell, the pods would flock to these areas, this is harder to do when the requests are less localised. For this reason, the GA is being verified against requests coming from two adjacent nodes, then later applied to a more realistic scenario. Therefore, to evaluate the performance of the proposed vehicle distribution algorithm, we compared two scenarios. These were “informed distribution”, where user journey requests were based on historical transport data, and “localised requests”, where all requests came from one area in the map.
The optimisation strategy is focused on minimising the time taken to complete journeys. This is contrary to what is presented in the literature, as most use dynamic programming to formulate the problem, then use a range of methods to solve for the optimal case. The solution we propose runs a GA against a simulation of the problem. This allows for the solution to be easily visualised and applied to real scenarios. Another aspect that is different is that most researchers use a ’rolling time horizon’ to apply the problem to the dynamic case. In our approach, the target areas are optimised for a 24 hour period. The vehicle controller does not have knowledge of the schedule to optimise the problem making it dynamic, with the GA being able to adapt as new demand patterns emerge.
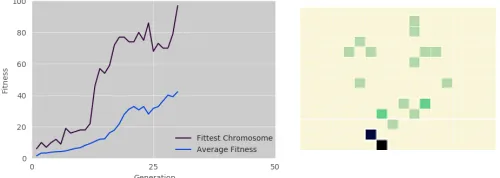
Fig. 5: The GA is able to optimise the success rate from 5% to 97% within 30 generations. The heat map, which is created from generation 30, received the highest fitness
A. Parameter Testing using Localised Requests
In order to verify the GA works, a request schedule was created whereby all requests would come from two adjacent nodes. If the GA worked as anticipated, pods would all migrate towards nodes making requests. The internal mechanism of the GA, through which this would improve the fitness, would simply be due to maximising the amount of time that pods are in proximity to requesting nodes. This would minimise the time taken to get to the request and therefore the overall journey time, increasing the success rate. At the start of the scenario, pods are randomly spread across all cells of the map. The results of the localised request schedule are shown in Fig. 5. This shows that over the course of the GA training, a 92% improvement is made in the fitness of the simulation. This means that for the same number of pods, 92% more journeys were successful, due to the optimisation of the GA. The intensity of the cell colour in the heat map are proportional to the number of pods in those cells, therefore, for localised requests we would expect the two cells in the south of Coventry to go a darker colour, as this is where the user requests are being generated. Prior to optimisation, the simulation was running at a baseline of ≈5% success rate, based on the journey success criteria specified in Section II-B2. The base run success rate is a function of the number of pods available, the number of requests made in total, the pod speed and the initial distribution of those pods.
When running the localised request scenario, the expected result is for pods to flock to nodes producing requests. Although the most successful chromosomes behaved in that way to an extent, the distribution did not converge pods onto nodes producing requests. However, the success rate was high, at 89%. The way in which the GA distributed pods is not clearly understood, which reveals a fundamental flaw with GAs. This is that it can often be challenging to know why some chromosomes are better than others. It may be useful in extracting optimum distribution for the input and constraints. However, extracting knowledge from the optimised model can be challenging and often not possible. For simple cases, where the majority of requests come from one or two nodes, we can see the distribution cluster, and make a reasonable assumption of why this has occurred. However, for more complicated stochastic request patterns, this becomes impossible.
B. Optimisation using Real-world Data
To test the algorithm using real-world data, a request sched-ule was created that would approximate a realistic demand pattern (see Section II-C). While this solved the temporal element of requests, the spacial element of requests needed to be determined. For this we made an assumption that 25% of requests would come from the train station (situated in the south of the city), 25% of the requests would come from the bus station (situated north), and 50% would be equally distributed between remaining nodes. However, this is an explanatory study, and these probabilities can be adjusted when further user data is gathered to improve estimations.
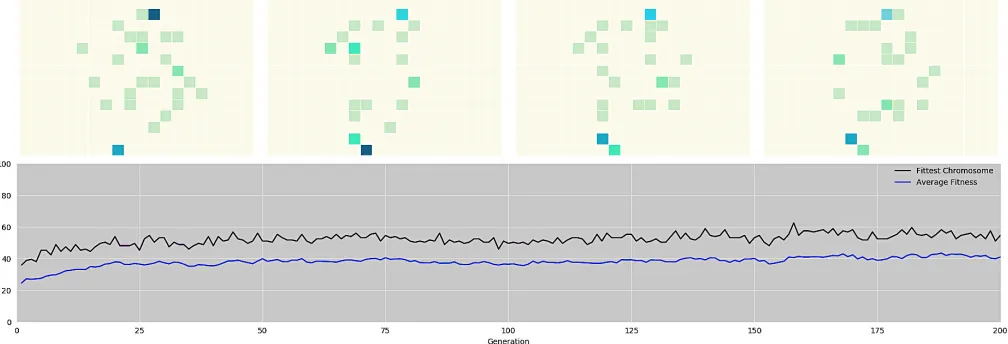
The results of the work day pattern, which determines the number of user requests every 10 minutes, with weighted request locations are presented in Fig. 6. This graph shows an increase from 32% to 62% in success rate of the simulations over the course of training. The most successful chromosome was used as a bench mark, as this is a high performing random distribution and therefore makes for a good control. The heat maps, which are examples of some of the highest success rates, show the success increase arises out of the GA increasing concentration of pods in two regions, located in the north and south of the map. These regions contain nodes that had increased 25% request weighting applied. It is possible the GA kept pods in other regions to serve stochastic requests. This is consistent for all tests, which found that more successful distributions exhibited more extreme pod densities in regions that contained nodes making more requests.
The localised request schedule had a significantly more suc-cessful optimal case, reaching it in 30 generations, compared to the work schedule, which produced its fittest chromosome at generation 158. A 30% success rate increase may seem small compared to the 92% increase of the localised request pattern. However, 50% of requests in the work day schedule are random and therefore have no optimal regions. The only optimisation is that which can be made against biases of the input request pattern. These were successfully found and exploited by the GA to optimise the distribution of the pods. It can be reasonably concluded that given accurate user location data, the distribution algorithm will optimise the location of pods considerably more than if pods were distributed ran-domly. However, to what extent this improves the percentage of successful journeys will require further testing.
IV. CONCLUSION
Fig. 6: Result of the GA after 200 Generations. The fitness peaks at 62% in Generation 158. The four heat maps are representative of the more successful distributions, which exhibit extreme pod densities in regions that contained nodes making more requests
To measure the effectiveness of the GA, we created a success criteria for pod journeys, based on requirements of potential users. This criteria, which was used as the GA fitness value, stated that for a journey to be successful, the duration from user request to journey completion, must be lower than half the time it would take to walk the same route.
Running the GA against an approximation of a realistic demand scenario, resulted in a journey success rate increase of 30%. This could yield significant benefits, which include increases in profits per day, a decrease in capital cost and better energy efficiency. The program is also adaptable to any service offering pick up and drop of points, including package delivery and transportation of goods.
The ideal GA will reach the optimal solution in the least time possible. However, there is a trade off between finding the highest quality solution and finding the solution quickly. There are many techniques to improve the GA, focusing on accuracy, speed, and quality of the solution. An example is to run automated parameter adjustments for a broad range of mutation values, population sizes and run lengths. This would require substantial time and computing resources, but may allow for a more optimal solution.
The interconnected and autonomous nature of pods make it possible to share information and acts as a group. A potential avenue for further work, would be to have pods communicate traffic conditions to a central server. This would act as an alternative way of collecting data to build the traffic model, meaning a fleet could be integrated into any city without prior knowledge of traffic conditions, and learn over time.
ACKNOWLEDGMENT
This work has been carried out as part of the Self-organising Wide area Autonomous vehicle Real-time Mar-shalling (SWARM) project. The project was funded by In-novate UK, the UK’s innovation agency, under the grant ref. 103287, and is a collaboration between RDM Ltd., University of Warwick and Milton Keynes Council.
REFERENCES
[1] A. Larsen, O. Madsen, and M. Solomon, “Classification of dynamic vehicle routing systems,” in Dynamic Fleet Management : Concepts, Systems, Algorithms & Case Studies. Springer, 2007.
[2] M. Bielli, A. Bielli, and R. Rossi, “Trends in models and algorithms for fleet management,”Procedia - Social and Behavioral Sciences, vol. 20, pp. 4 – 18, 2011.
[3] S. Ichoua, M. Gendreau, and J. Potvin, “Planned route optimization for real-time vehicle routing,” in Dynamic Fleet Management : Concepts, Systems, Algorithms & Case Studies. Springer, 2007.
[4] G. Ninikas and I. Minis, “Reoptimization strategies for a dynamic vehicle routing problem with mixed backhauls,”Networks, vol. 64, no. 3, pp. 214–231, 2014.
[5] B. Bouchra, D. Btissam, and C. Mohammad, “A hybrid genetic al-gorithm for the static and dynamic vehicle routing problem with soft time windows,” in3rd International Conference on Logistics Operations Management (GOL), May 2016, pp. 1–9.
[6] J. Yang, P. Jaillet, and H. S. Mahmassani, “On-line algorithms for truck fleet assignment and scheduling under real-time information,” Transportation Research Record, vol. 1667, no. 1, pp. 107–113, 1999.
[7] A. Vishwakarma, “Forecasting uber demand in nyc,”
https://medium.com/@Vishwacorp/timeseries-forecasting-uber-demand-in-nyc-54dcfcdfd1f9, accessed: 10-03-2019.
[8] S. J. Taylor and B. Letham, “Forecasting at scale,” The American Statistician, vol. 72, no. 1, pp. 37–45, 2018.
[9] J. I. van Hemert and J. L. Poutre, “Dynamic routing problems with fruitful regions: Models and evolutionary computation,” 2004. [10] A. Lew and H. Mauch,Dynamic Programming. Springer, 2007. [11] H. Topaloglu and W. B. Powell, “Sensitivity Analysis of a Dynamic
Fleet Management Model Using Approximate Dynamic Programming,” Operations Research, vol. 55, no. 2, pp. 319–331, April 2007. [12] Y. Wu, W. Zhang, and L. Liao, “The study of optimized models and
algorithms of dynamic fleet scheduling problem,” 2007.
[13] K. Lu, R. Woodman, M. D. Higgins, and S. Birrell, “Dynamic platooning for autonomous vehicles: Real-time, en-route optimisation for shared supervision,” Transactions on Intelligent Transportation Systems, in press.
[14] M. Negnevitsky,Artificial Intelligence: A Guide to Intelligent Systems. Addison Wesley, 2002.
[15] M. D. Higgins, R. J. Green, and M. S. Leeson, “A genetic algorithm method for optical wireless channel control,” Journal of Lightwave Technology, vol. 27, no. 6, pp. 760–772, March 2009.
[16] R. Woodman, K. Lu, M. D. Higgins, S. Brewerton, P. Jennings, and S. Birrell, “A human factors approach to defining requirements for low-speed autonomous vehicles to enable intelligent platooning.” Paris, France: 30th IEEE Intelligent Vehicles Symposium, 2019.