Universal health care and temporal and spatial diffusion patterns
45
0
0
Full text
(2) List of Tables and Figures Table 1. Adoption of universal health care in the developed nations. Figure 1. Bell shaped curve and S-curve. Figure 2. Cumulative adoption curve of pension reforms among Latin-American countries.. Figure 3. Geographical display of the adoption of anti-discrimination policies among US counties. Figure 4. Adoption curves of universal health care policies in developed countries. Figure 5. The spread of universal health care in the developed countries. Figure 6. The spread of universal health care in the developed countries – 1912 (innovator). Figure 7. The spread of universal health care in the developed countries – 1944 (early adopters). Figure 8. The spread of universal health care in the developed countries – 1972 (early majority). Figure 9. The spread of universal health care in the developed countries – 1990 (late majority). Figure 10. The spread of universal health care in the developed countries – 2014 (laggards). Figure 11. The spread of universal health care in Europe. 2.
(3) List of Abbreviations AD. Andorra. AE. United Arab Emirates. AT. Austria. AU. Australia. BE. Belgium. BH. Bahrain. BN. Brunei. CA. Canada. CH. Switzerland. CY. Cyprus. DK. Denmark. DE. Germany. EL. Greece. ES. Spain. EU. European Union. FI. Finland. FR. France. HDI. Human Development Index. HK. Hong Kong. IE. Ireland. IL. Israel. IT. Italy. IS. Iceland. JP. Japan. KR. South Korea. KW. Kuwait. LU. Luxembourg. NL. Netherlands. NO. Norway. NZ. New Zealand. OECD. Organization for Economic Co-operation and Development. PT. Portugal. 3.
(4) SG. Singapore. SE. Sweden. UK. United Kingdom. UN. United Nations. US. United States. WHO. World Health Organization. 4.
(5) Table of content 1. Introduction. 6. 1.1 Research question. 7. 1.2 Relevance. 7. 1.3 Structure of the report. 8. 2. Background. 9. 2.1 Universal healthcare. 9. 2.2 Policy diffusion. 10. 3. What are spatial and temporal diffusion patterns?. 12. 3.1 Temporal diffusion patterns. 12. 3.2 Spatial diffusion patterns. 15. 4. Methodology. 18. 4.1 Research design. 18. 4.2 Case selection. 20. 4.3 Data collection. 21. 4.4 Data analysis. 21. 5. Temporal diffusion patterns in universal health care. 23. 6. Spatial diffusion patterns in universal health care. 28. 7. Conclusion. 38. 8. References. 40. 8.1 Source list event history data. 42. 5.
(6) 1. Introduction When Barack Obama decided to run for president in 2007 he emphasized the importance of several national issues during his campaign. One of the most pressing to him was the promotion and realization of universal health care. In an interview with the Washington Post he stated that “providing universal health care to the 47 million Americans who currently do not have it will be another top priority of my administration” ("Barack Obama on the issues," 2008). It looks like he has kept his promise as in 2010 two bills were passed. The main aim of these acts and the other proposed reforms is to make insurance more affordable by providing tax cuts and subsidies to those who need it (USGovernment, n.d.). The goal is to get at least 95% of the American population covered by health insurance and to end discrimination against people with pre-existing conditions (USGovernment, n.d.). The reforms should also reduce the costs of the current healthcare system. Overall the reforms aim for an American universal healthcare system. These reforms and their aims are applauded by the World Health Organization (Bigg, 2010) and therefore seem to be good policy plans. But where did Obama and his administration get their ideas from? It would be naïve to think that they came up with them all on their own as it is almost impossible to create and implement national policies without outside influence in the current globalized world. There is no vacuum where policies can be created as policymakers are constantly influenced by policies that other states, regions or cities have implemented. This often happens unconsciously but not always. Politicians and policymakers sometimes specifically look at what other countries are doing or have done in the past to fix their ‘problems’. Because almost all states face the same kind of problems and issues it happens more often than not that when a state encounters a problem, another state has dealt with it, or something similar, already. By looking abroad states can learn from other countries about what to do and what not to do in certain situations. This is known as policy transfer, policy diffusion, policy learning and policy convergence (D. P. Dolowitz & Marsh, 2000). While the terminology and focus of them varies, they all refer to the same kind of process, the transfer of policies from one state or country to the next.. It seems that the American healthcare reforms have been affected by this process. American policymakers and politicians have often referred to various European healthcare systems when discussing the American healthcare system (van de Ven & Schut, 2008). They feel that the current. 6.
(7) Dutch and Swedish models are successful and should be emulated in the United States (Broek, 2010). This suggests that some form of policy diffusion took place between the United States and the EU.. 1.2 Research question However it is impossible to prove that any possible similarities between the current health care reforms in the US and the health care systems in the EU are due to policy diffusion. Policymaking is an intricate process with a vast amount of factors that influence its outcome. It is almost impossible to separate all of them, to see how much influence each factor had on the policy outcome. It can be done but it is beyond the scope of this Bachelor thesis. Because of this, this research project will not be explanatory in nature but descriptive.. What can be done in this paper is to look at when and where universal health care is adopted. Because healthcare reforms is a rather broad term the adoption of universal healthcare is used because that is what the current US reforms will set up. Focusing on this could provide valuable insight into who might be ´copying´ whom in terms of the adoption of universal healthcare. In other words, it could give clues as to whether policy diffusion might have occurred among the countries that have already adopted universal healthcare and the US. Therefore the following research question will be answered in this study:. To what extend can temporal or spatial patterns be observed among the adoption of universal health care policies in the developed nations, between 1912 and 2014?. For this question to be answered, spatial and temporal policy diffusion patterns are explained first. Therefore the following sub-question will also be answered: how do spatial and temporal policy diffusion patterns look like? The answer to this sub-question will provide insights into the theoretical basis of this study. Also some general information about universal health care and policy diffusion will be presented in the background section of this paper.. 1.3 Relevance In the introduction of this research proposal it was already mentioned that a lot of research about policy diffusion has already been done. Even specifically in the field of healthcare reforms. However this research project can still contribute to the existing literature in several ways. First of all, there is still a lot that is unknown about how policies diffuse and which underlying processes make policies diffuse. This research project aims to describe how the spatial and temporal patterns look like. If 7.
(8) these patterns are found it could provide valuable clues to researchers that are interested in policy diffusion. If for example a clear geographic pattern is found among the western European countries, it might be interesting to further investigate if there actually was any form of policy diffusion among these countries. Second of all, most research about policy diffusion in the area of healthcare has focused on European countries and how their policies influence one another. Most often the policy diffusion literature focuses on neighboring countries or states. This research project however will not just look at neighboring countries but will include countries that are from all over the world and are therefore not all geographically linked. On the practical side this project might provide valuable insight to policymakers about the adoption of health care policies across the world. Policy diffusion is an important concept as it is becoming more and more unlikely that states are not influenced by each other when they design and implement new domestic policies. Any research that can somehow contribute to the existing policy diffusion literature should be considered relevant. It is important to understand how policy change and the adoption of policies works, because in the end policies always affect people. If the mechanisms that drive policy change are discovered they could be used by the European Union to promote and spread human rights and democracy.. 1.4 Structure of the paper This research paper has a clear structure and has been divided into different chapters for easy readability. In chapter two background information about the most important concepts of this study, which are universal health care and policy diffusion, will be given. The first part of chapter three will go into the temporal element of the sub-question. The second part will go deeper into the spatial element. In chapter three the sub-question (what do spatial and temporal policy diffusion patterns look like?) will be answered. In the fourth chapter the methodology of this research paper will be described. It consists of the research design that was used, the case selection, the data collection method and the way in which the data was analyzed. The fifth chapter will provide an in-depth analysis of the first part of the research question. Then chapter six answers the other half of the research question. In the final chapter the conclusion will be presented together with some advice for future research.. 8.
(9) 2. Background In this part of the research paper some background information about the two most important concepts of this study will be provided. First universal healthcare will be briefly discussed, after that some information about policy diffusion will be given.. 2.1 Universal health care The term universal health care is used quite often when health care systems or developments are discussed. However in the literature about health care the term is almost never clearly explained or defined. So, what is universal health care exactly? And when was it first introduced? There are several definitions of universal health care but this simple one by Meades & Roberts (2007) describes the main idea behind all of them: “Universal health care is a state in which all residents of a geographic area have access to health care”. This means that every resident or citizen is covered for a basic set of health care services and that no resident or citizen can be denied of health care. The term universal health care is often wrongly equated to a national health insurance or a single payer model in which all health care is paid for by the government (Reid, 2008). In some countries with universal health care this is the case, however it does not apply to all of them. Universal health care is also often mistaken for a health care system that is entirely run by the government which is also not true. Health care can be provided by public or private agencies or a combination of both. It should be clear that universal health care is not one model of health care, it can manifest itself in various ways while still providing universal coverage to its citizens (Reid, 2008). The common denominator is that there is some form of government action that aims at expanding access to health care for everyone. The government is also involved in setting at least some form of minimum standards of care. Germany is often considered to be the source of universal health care because it was the first to “codify existing voluntary structures into mandatory state-supervised legislation in 1883” (Figueras, Mckee, Mossialos, & Saltman, 2004). In that year the German parliament passed a law that made health insurance mandatory for certain employees all across Germany (Busse & Riesber, 2004). However the principles and structures underlying universal health care can be traced back to the late Middle Ages and medieval guilds that often had some form of insurance for their members (Figueras, et al., 2004). Most of the developed countries nowadays have some form of universal health care. The United States however has been one of the most prominent exceptions and has, because of this, often received harsh critique from important organizations like the World health organization and the Organization for Economic Co-operation and Development (Docteur, Suppanz, & Wo, 2003). But 9.
(10) with the advent of the new Obama administration and the current health care reforms this situation should be resolved by 2014 when the new universal health care system will become active ("The Patient Protection and Affordable Care Act.," 2010). In this research paper the term universal health care will be defined as follows: Universal health care is an organized system that is built around the principle of universal coverage to all its citizens that combines mechanisms for health financing and service provision (CSDH, 2008).. 2.2 Policy diffusion Throughout the policy diffusion literature several different terms are used, a few of them are policy learning, policy convergence and policy transfer. All these terms have a slightly different meaning but overall they all describe the same process “by which knowledge about policies, administrative arrangements, institutions and ideas in one political system (past or present) is used in the development of policies, administrative arrangements, institutions and ideas in another political system” (D. P. Dolowitz & Marsh, 2000). For the sake of clarity and coherence only the word policy diffusion will be used throughout this research paper. Policy diffusion does not mean that one type of policy is simply ‘copy-pasted’ from one country to another. It is much more subtle than that. Sometimes only the policy goal is diffused. For example, not all universal health care policies are the same; every country has their own way of reaching the same goal (universal coverage). Dolowitz & Marsh (2000) have identified several categories of what can be diffused between political systems. They found the following eight categories: policy goals, policy content, policy instruments, policy programs, institutions, ideologies, ideas and attitudes and negative lessons. Most of these speak for themselves; however the difference between policy and policy programs could use some explanation. Dolowitz & Marsh (2000) see policies “as broader statements of intention and which generally denote the direction policy-makers wish to take, and programs, which are the specific means of the course of action used to implement policies”. This means that a policy can have several different programs while a program is a complete course of action in and of itself (D. P. Dolowitz & Marsh, 2000).. When policy is transferred or diffused it does not mean that it is transferred or diffused in its entirety. There are different degrees of policy diffusion; it’s not an all or nothing process. Once more Dolowitz & Marsh (2000) have identified four different gradations of policy diffusion. One of them is copying which means that the policy was transferred directly in its entirety. The second one they mention is emulation, which means that only the ideas behind the policy or program are diffused.. 10.
(11) The third one is called mixtures and involves a transfer of a mixture of several different policies. The last one Dolowitz & Marsh (2000) have identified is called inspiration, which happens when policy from another jurisdiction inspires a change in policy but does not actually take anything from the policy that inspired it. Which type of policy diffusion happens is different for every case and depends on who is involved and where in the policy making process the diffusion happens (D. P. Dolowitz & Marsh, 2000). For example, a politician looking for an easy way to fix policy problems might opt for copying while a bureaucrat goes for the diffusion of a mixture of policies.. In the literature several theories or mechanisms can be found that try to explain why policies diffuse. The four most important ones, which are learning, coercion, competition and mimicry (Marsh & Sharman, 2009), will be discussed here. Learning happens when a government makes a rational decision to emulate the policies of another government when that measure produces more effective policy outcomes than any of the alternatives (Rose, 1991). However it is important to note that learning does not “occur when policy makers simply adapt to the policy shifts of others, but only when their beliefs about cause and effect change” (Dobbin, Simmons, & Garrett, 2007). Coercion happens when state are coerced into taking over policies from other countries. An example of this would be one government forcing another government to adopt a policy, but this happens very rarely (D. Dolowitz & Marsh, 1996). What happens more often is a supra-national institution, like the IMF and the EU that forces other states to adopt certain policies. Competition is another mechanism used to explain policy diffusion. The following two quotes from Dobbin, Simmons & Garrett (2007) give a good understanding of why governments take over foreign policies when faced with (economic) competition:. “These days, when a country’s competitors simplify regulatory requirements, ameliorate investment risks, and reduce tax burdens, that country comes under pressure to follow suit.”. “Governments have little choice but to choose market-friendly policies to attract global investment and keep exports competitive, the thinking goes, when their direct competitors have done so.”. The last mechanism is called mimicry and is also known as socialization and social constructivism (Dobbin, et al., 2007). Mimicry “explains the process of copying foreign models in terms of symbolic or normative factors, rather than a technical or rational concern with functional efficiency” (Marsh & Sharman, 2009). A good example of this is presented by Dobbin, Simmons & Garrett (2007) who use the diffusion of mass schooling policies after the Second World War. At that time schooling and 11.
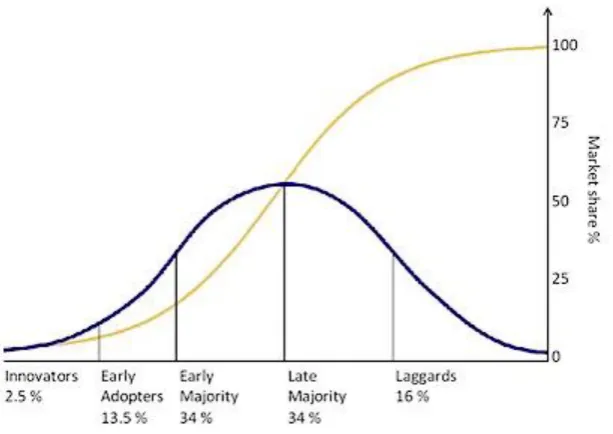
(12) education were constructed as integral parts of modernity and democracy, therefore countries adopted mass schooling policies even when they did not really need a big educated workforce and did not have the economic structures in place to support these mass schooling policies. They still adopted the mass schooling policies because that was the “advanced, progressive and morally praiseworthy” (Marsh & Sharman, 2009) thing to do at that time.. 3. What are spatial and temporal diffusion patterns? Before the hypotheses will be tested it is important to first investigate what temporal and spatial policy diffusion patterns look like, otherwise one will not know what to look for. In the first part of this chapter temporal policy diffusion patterns will be closely examined. In the second part of this chapter the focus will shift to spatial policy diffusion patterns.. 3.1 Temporal diffusion patterns In 1962 Everett Rogers published a very influential and important book named Diffusion of innovations. It started with Rogers’s interest in agriculture and the adoption of new agricultural techniques by farmers (Provenmodels, 2010). When he finished his Doctorate work on why farmers in Iowa resisted using new agricultural techniques like hybrid seed, weed sprays and chemical fertilizer and how these new techniques diffused among farmers over time, he started to review other studies on diffusion. He noticed that there were considerable similarities between the diffusion of innovation research in different research areas like education and medicine (Provenmodels, 2010). In his book he presented a coherent academic framework that brought these similarities together and could be applied to different disciplines. The importance of his work and his book, Diffusion of Innovations, was considerable and is still the second most cited book in the social sciences (Provenmodels, 2010). The most important aspect for this study is that the theory that was presented in this book suggested that diffusion of innovations might follow systematic patterns. Rogers (1995) theorized that the adoption rates of most innovations have some sort of bell shaped curve and an S-shaped cumulative curve. This is illustrated in figure 1 which uses the adoption of new products as an example. The adoption of new products has a normal distribution which is indicated in figure 1 by the black bell shaped curve. If a normal distribution is displayed in the form of a cumulative probability plot it will take on the shape of the letter S which is indicated by the grey line in figure 1. Rogers (1995) distinguished five different adopter categories in his theory on the diffusion of innovations. These are the innovators, the early adopters, the early majority, the late majority and 12.
(13) the laggards (Rogers, 1995). As can be seen in figure 1 these five categories follow a standard deviation-curve. It starts with very little innovators that adopt the innovation in the beginning (2,5%), then the early adopters follow them (making up 13,5%), a short time later the early majority (34%) and the late majority (34%) also follow and then after more time finally the laggards make up for last 16% (Provenmodels, 2010; Rogers, 1995). Figure 1: Bell shaped curve and S-curve. Source: (Spreadingscience, 2010) Rogers (1995) defined innovations as “an idea, practice or object that is perceived new by an individual or other unit of adoption. It matters little *…+ whether or not an idea is “objectively” new as measured by the lapse of time since its first use or discovery” (Rogers, 1995). So it does not matter if others already adopted the idea, as long as it is new to the unit that adopts a new policy it can be called an innovation. Rogers (1995) then goes on and classifies diffusion as a "process by which an innovation is communicated through certain channels over time among the members of a social system”. These descriptions of innovation and diffusion can easily be applied to policy ideas and the diffusion of policy ideas. Gray (1973) and Walker (1969) were among the first researchers to apply Rogers’s (1995) theory about the diffusion of innovations to the spread of policies across states and countries. While Walker focused more on the spatial patterns that could be found in the diffusion of policies, Gray focused on the temporal patterns. In her research Gray (1973) set out to test the temporal patterns of several state policies. She found that some policies (but not all) indeed displayed an S-shaped cumulative adoption curve, just like Roger’s (1995) theory about the diffusion of innovations predicted (Gray, 1973).. 13.
(14) Figure 2: Cumulative adoption curve of pension reforms among Latin-American countries.. Source: (Weyland, 2005) But what exactly does this S-shaped cumulative adoption curve mean? Kurt Weyland (2005) explains it very clearly in his research article about the diffusion of policy reforms in Latin-America. He describes the temporal dimension of policy diffusion as a wave like process that occurs when a new policy approach sweeps across important regions of the world (Weyland, 2005). It all starts out slow with just one country adopting a bold new and innovative policy. After a while another country notices the new policy and decides to adopt it as well. It can take a lot of time before this happens though. This can be clearly illustrated by the adoption curve from Weyland’s research in figure 2 which shows the cumulative adoption rate of Latin-American countries that adopt pension reforms. The first country adopts the reforms in 1981 and remains alone until 1993 when a second country adopts the reforms. Now that the second country has joined, the adoption rate really gains momentum. Within a year two more countries join the bandwagon and adopt the new policy approach. In the years after that more and more countries do the same. The adoption rate then slows down again when most countries have already adopted the change or are unable to do so. This process creates a wave like effect as the new policy approach spreads quickly to other countries that want to follow the trendsetter (Weyland, 2005) and can be shown visually by creating a graph which results in an S-shaped curve. In figure 2 the X-axis is time and the black and spotted curves represent. 14.
(15) the cumulative number of Latin-American and post-communist countries that adopted the pension reforms. To summarize, the temporal policy diffusion pattern takes the shape of a cumulative S-curve that stems from Rogers’s (1995) theory about the diffusion of innovations. The S-curve starts with few countries that adopt the new policy initially but when more countries decide to join the movement gains momentum and more and more countries also join. Finally the curve tapers off when most countries have adopted the new policy.. 3.2 Spatial diffusion patterns In the previous section Walker’s (1969) research was already briefly mentioned. Even though his research was not specifically focused on spatial diffusion patterns he did hypothesize however that certain states would serve as innovators in the adoption of all kinds of policies and that these policies would diffuse geographically outward from the innovators to the surrounding states and neighbors (Klawitter & Hammer, 1999). If the adoptions would be presented on a map, this geographic or spatial policy diffusion pattern would look like spreading inkblots (J. L. Walker, 1969). This inkblot pattern can be seen in figure 3 which shows the adoption of anti-discrimination laws of certain US counties. The map shows several clusters, mainly in the Northeast and Western parts (Klawitter & Hammer, 1999). While the map does not show an overwhelmingly strong pattern there are some counties that had anti-discrimination policies in 1985 that have cluster of counties in close proximity with anti-discrimination policies in 1995 (Klawitter & Hammer, 1999). Even though the research by Klawitter & Hammer (1999) does not show very strong evidence of this spatial diffusion pattern it is still an idea that is commonly found throughout the policy diffusion literature (Volden, 2006). The reason for this is that a lot of research about policy diffusion does provide evidence that states are “more likely to emulate its geographic neighbors than to emulate other states” (Volden, 2006). and that the probability that a state will adopt a certain policy is positively related to the number of states that border it that have already adopted it (Berry & Berry, 1990). Both hypotheses support the spatial “inkblot” diffusion pattern. But what causes this spatial geographic pattern? According to Kurt Weyland (2005) neighboring countries tend to interact more with one another and they therefore also tend to notice quickly when a neighboring state adopts a new policy. “The innovator’s neighbors and other countries in the region are usually the first to emulate the new model; only after a while do nations in other regions begin to enact the change as well” (Weyland, 2005). Countries that are in close proximity of each other usually show a large exchange of information because they are directly accessible to one 15.
(16) another and therefore have a particular immediacy (Schmitt, 2010). This leads to the assumption that neighbors influence each other more strongly than countries that are not in in close proximity of each other (Weyland 2006; Simmons, Dobbin et al. 2008). This, in turn, leads to the expectation that the adoption of policies creates a spatial pattern that looks like a spreading “ink-blot” (Jack L. Walker, 1973), with the trendsetting country in the middle, with policy adoptions spreading from neighboring country to neighboring country. While the reasons of neighbors for adopting similar policies may vary (competition, learning, quests for legitimacy etc.) they are most likely the result of each other’s close proximity (Weyland, 2005). Figure 3: Geographical display of the adoption of anti-discrimination policies among US counties. Source: (Klawitter & Hammer, 1999, p. 39). However, spatial patterns are not limited to geographical proximity. Cultural proximity is also frequently mentioned throughout the policy diffusion literature. Neighbors can also be seen as countries that share similar characteristics (Beck, Gleditsch, & Beardsley, 2006). It is thought that countries preferably learn from or emulate countries that they share certain cultural characteristics with, like a common language, a common religion or a common history (Elkins & Simmons, 2005). Countries look at other countries that are similar and use them as a frame of reference. Because of 16.
(17) this the policies of countries that share similarities are available to one another and can thus be diffused. This idea is taken by Castles (1993) who used it to construct his theory on the ‘Families of Nations’. Castles (1993) theorizes that certain ‘Families of Nations’ that share specific patterns of geographical, linguistic or cultural characteristics are likely to share certain policy outcomes. Castles (1993) bases his family resemblance on “similarities deriving from affinities of descent, imperial ties, common legal or religious cultures, diffusion and deliberately chosen membership of political and economic unions such as the EU” (F.G. Castles, 1993). Simmons and Elkins (2005) also see a common language, heritage or religion as a “highly plausible explanation for policy emulation” (Elkins &. Simmons, 2005). This means that policy diffusion should occur to a higher degree within each family of nations. Castles (1993) is not the only author who theorized about cultural proximity, groups of countries and policy diffusion. However, most of the theories end up with a “fourfold distinction between Englishspeaking, Scandinavian, continental European and Southern European families of nations *…+ or to variations on that theme”(Francis G. Castles & Obinger, 2008). By using cluster-analysis Castles (1993) was able to sort many of the developed nations into one of the four ‘Families of Nations’. The objective of cluster analysis is “to single out different clusters showing strong internal homogeneity, while the difference between each of the clusters should be as large as possible” (Obinger & Wagschal, 2001). This makes cluster analysis very useful in detecting patterns or ‘Families of Nations’. According to Castles (1993) the ‘Families of Nations’ consists of:. “1. an English speaking family of nations including Australia, Canada, Ireland, New Zealand, the United Kingdom and the United States; 2. a Continental family of nations consisting of Austria, Belgium, France, Germany, Italy and the Netherlands; 3. a Scandinavian family of nations consisting of Denmark, Finland, Norway and Sweden; and 4. a Southern family of nations comprising Greece, Portugal and Spain” (Obinger & Wagschal, 2001).. Switzerland and Japan, however, did not properly into one of the four families (F.G. Castles, 1993). Japan had similarities with many of the four families but was also influenced by the Asian world. This resulted in strong Confucian-based familialism and corporate occupational welfare arrangements that did not fit into any of the four families. Switzerland also does not fit into one of the four families because its “public policy profile deviates with respect to social and economic policy from the corresponding trajectory of the continental family of nations” (Obinger & Wagschal, 2001). In a 17.
(18) follow up study Castles (2008) concludes that “not only ‘the hypothesised families of nations can be shown to exist’, but also that ‘they are quite robust and stable over time’” (Francis G. Castles & Obinger, 2008). To quickly summarize, because neighboring countries are in close proximity of each other there is interaction among them. This interaction is why spatial policy diffusion patterns take the shape of spreading inkblots when presented on a map. Countries seem to be more likely to adopt policies that their neighbors have already adopted. Countries are also more likely to adopt policies that countries within their family of nations have already adopted because they often use each other as a frame of reference.. 4. Methodology In this chapter the methodology that was used to properly carry out this study will be explained in detail. In the first part of this chapter the research design will be discussed. In the second part the cases that were selected and the reasons for their selection will be explained. In the third part the data collection methods will be addressed. Finally, the way in which the data was analyzed will be explained.. 4.1 Research design The central research question that this study is focused on is: To what extend can temporal or spatial patterns be observed among the adoption of universal health care policies in the developed nations, between 1912 and 2014?. To answer this descriptive research question it has to be divided in to two parts. The first part will be concerned with the temporal aspect, while the second part will be concerned with the spatial aspect of the research question. Each part has its own hypotheses that will be tested. The first hypothesis to be tested is:. Hypothesis 1: The likelihood that a state adopts a universal health care system is higher when other states have already adopted a universal health care system.. 18.
(19) This hypothesis will be tested by creating a cumulative adoption curve (this will be elaborated on in section 3.4 and 4.1) and will specifically focus on the first part of the research question; whether a temporal policy diffusion pattern can be found or not. The second hypothesis that will be tested is:. Hypothesis 2: The likelihood that a state adopts a universal health care system is higher when its geographic neighbors have already adopted a universal health care system.. This one will be tested by creating maps that display which countries have a universal health care system in place in each given year (more on this in section 3.4 and 4.2) and will focus on the second part of the research question, about whether a spatial policy diffusion pattern can be found. The third hypothesis is:. Hypothesis 3: The likelihood that a state adopts a universal health care system is higher if states from the same family of nations have already adopted a universal health care system.. This hypothesis will be tested by using the maps from the second hypothesis in conjunction with an event history table. It will also focus on the second part of the research question that is concerned with spatial diffusion patterns.. To create both the cumulative adoption curve and the maps, data about the year in which each country adopted universal health care is collected. To organize this data an event history table will be created. To construct an event history analysis, data on the occurrence of the adoption of universal health care is collected. It contains information on whether the event of interest occurred to the units in the sample or not, and it contains the specific time of occurrence (Tekle & Vermun, n.d.). After the data has been collected a country-year data-file will be created for each country. All the countries will be followed from 1912 to 2014, until the country has adopted a universal health care system of sorts. The dependent variable, the adoption of a universal health care system, is conceptualized as an event. It functions as a dummy variable taking the value of a one if a policy that creates a universal health care system is adopted in a certain country-year and a zero if no reform is adopted. In the end this event history table will provide a clear overview of when each country adopted a universal health care system and it will be possible to see which countries might have ‘followed’ each other. In this study the adoption of a universal health care will be operationalized in the following way: when a country adopts a system that is organized, built around the principle of 19.
(20) universal coverage to all its citizens that combines mechanisms for health financing and service provision.. 4.2 Case selection In this part of the research paper the cases that were selected and the reasons why they were selected to be included in this research will be discussed. First all the cases will be listed, after that the reasons for their inclusion will be given. This study will look at the adoption of universal healthcare in the following 32 countries (in no particular order) and will follow them from 1912 to 2014: Andorra, Norway, New Zealand, Japan, Germany, Belgium, United Kingdom, Sweden, Bahrain, Brunei, Canada, Netherlands, Austria, United Arab Emirates, Finland, Denmark, Luxembourg, France, Australia, Ireland, Italy, Portugal, Cyprus, Greece, Spain, South Korea, Iceland, Hong Kong, Singapore, Switzerland, Israel and the United States. These countries were selected because all of them can be classified as developed countries. Even though there is much debate about what a developed country exactly implies, all the countries can be found in the top 42 of the United Nations Human Development Index (UnitedNations, 2010). The human development index is an index that measures development in countries worldwide which combines “indicators of life expectancy, educational attainment and income into a composite human development index, the HDI” (UnitedNations, 2011). This top 42 is also classified by the UN as countries with very high human development and they can therefore be considered to be developed countries. At first, data about the adoption of universal health care from every country was considered, but this was quickly narrowed down to data from the developed countries. The main reason for this was that these countries shared a lot of similarities, like GDP, living standards and political systems, and could therefore be compared with each other. Another reason was that reliable data about the year in which the countries adopted universal health care was mostly restricted to countries that were classified as developed. However not all the countries that are in the UN’s top 42 and considered to be developed countries are included in this study, three countries, Liechtenstein, Barbados and Qatar were dropped because no reliable data could be found for them. Malta was also dropped because no exact year in which universal health care was adopted could be distinguished. Furthermore, Poland, Estonia, Hungary, Slovakia, Slovenia and the Czech Republic were also not included because. 20.
(21) it was very hard to distinguish an exact year in which they adopted universal health care. This was due to shifting borders and Russian occupation and influence after the Second World War. The time period from 1912 to 2014 was chosen because in 1912 the first universal health care system was adopted and in 2014 the US will adopt its own universal health care system.. 4.3 Data collection In this part of the research paper the various sources that were used to construct the country-year data table and the reasons for choosing them will be discussed. To create the event history analysis, data about the year in which each country adopted universal health care was needed. This data was collected from reports and articles from various sources. For the European countries the health care systems in transition reports were used. These describe the entire health care system and its history of each individual European country. These reports are updated every couple of years and are released by the European Observatory on Health Systems and Policies. The Observatory is a partnership between the World Health Organization (Regional Office for Europe), several European governments, the European Commission, the European Investment Bank and the World Bank (WHO, 2011). There is also an Eastern Mediterranean Regional Health System Observatory which also works closely with the WHO. Just like its European cousin it releases country specific health system profiles with detailed information about the health care systems. These will provide the data for Kuwait, Bahrain and the United Arab Emirates. The Journal of Public Health Medicine has also published some country specific articles about health care systems in transition. These will be used for the remaining countries, except for the United States. For the US national policy documents will be used.. 4.4 Data analysis This part of the methodology chapter will explain how the data was analyzed and what kind of techniques were used to so. First the event history table will be discussed, then the adoption curve will be examined and finally the different maps will be addressed. The ‘Families of Nations’ theory by Castles (1993) was also used. To analyze the data and to answer the research question three different techniques will be used. The first one is the event history table which will give a clear overview of the data. More specifically the table will show which country adopted a universal health care system and in what year. This will in 21.
(22) turn show which countries might have followed each other in adopting the new policy approach which is a strong indicator of policy diffusion. In every year a country receives a zero up until the point that they adopt universal health care. When they do so they receive a one and will not receive a number in the years after that. Unless of course they change their policies and decide to drop their previously adopted universal health care scheme and do not adopt a different one in its place. The second technique that was used is the adoption curve. The (cumulative) adoption curve shows the cumulative amount of countries that have adopted a universal healthcare policy in each year. The curve will show if the adoption of universal health care was a wave like process or not. This will help answer the first hypothesis about the likelihood of states adopting a policy in relation to the amount of other states that have adopted the policy already. Finally, different maps will be created that show the way universal health care policies spread over the developed countries. Several maps will be constructed for five different points in time, each corresponding with one adoption group typified by Rogers (1995). This will provide a clear picture of any spatial patterns that might be present. Did the adoption of universal health care really spread like an ink-blot as the theory predicts? The maps will make show whether the theory is correct. The maps are especially important in answering the part of the research question about spatial patterns and in testing the second and third hypothesis. The maps were made in Quantum Gis by using the data from the event history table. The shape file containing the world map was provided by Wouter Jans. The ‘Families of Nations’ theory and typology by Castles (1993) was also used to help analyze the data. The theory consists of four different families of nations, each with a certain number of countries. The data from the countries from each family were placed next to each other to determine whether there is a spatial pattern among them. However, because Castles (1993) has only included nineteen countries in his four different families of nations, not all countries that were included in the dataset could be analyzed. Only Denmark, Norway, Finland, Sweden, Australia, Canada, Ireland, The United Kingdom, The United States, New-Zeeland, Austria, Belgium, The Netherlands, France, Germany, Italy, Greece, Portugal and Spain were analyzed like this. The maps were also used to determine whether any patterns could be found in a family of nations.. 22.
(23) 5. Temporal diffusion patterns in universal health care In this chapter the result of the cumulative adoption curve for universal health care will be closely examined and the first hypothesis will be tested. The event history table will also be examined to help answer the first part of the research question. The first hypothesis specifically focuses on the first part of the research question about whether a temporal diffusion pattern could be found among the adoptions of universal health care in the developed countries. In chapter 3.1 it was explained that a temporal policy diffusion pattern results in an S-shaped cumulative adoption curve. In this case this would mean that countries are more prone to adopt a universal health care system if other countries have also adopted a universal health care system. The adoption rate starts out low with only a few innovators, but when a few more countries join the innovators, and adopt a universal health care system as well, the adoption rate starts to accelerate rapidly. When there are little countries left to adopt a universal health care system the curve tapers off. So the S-shaped curve means that countries are more likely to adopt universal health care if other countries have preceded them. Hence the first hypothesis: The likelihood that a state adopts a universal health care system is higher when other states have already adopted a universal health care system. To test whether this is indeed the case, data about the year of adoption of universal health care of all the developed nations that were included in this study was gathered. This data was then used to create the event history table, which can be found below in table 1. The event history table in turn was used to construct the adoption curves that can be seen in figure 4. Table 1: Adoption of universal health care in the developed nations AD AE AT AU BE BH BN CA CH CY DK DE EL ES FI FR HK IE IL IT IS JP KR LU NL NO NZ PT SG SE UK US 1912. 0 0 0 0 0 0 0 0 0 0 0 0 0 0 0 0 0 0 0 0 0 0 0 0 0. 1 0 0 0 0 0 0. 1913. 0 0 0 0 0 0 0 0 0 0 0 0 0 0 0 0 0 0 0 0 0 0 0 0 0. 0 0 0 0 0 0. 1914. 0 0 0 0 0 0 0 0 0 0 0 0 0 0 0 0 0 0 0 0 0 0 0 0 0. 0 0 0 0 0 0. 1915. 0 0 0 0 0 0 0 0 0 0 0 0 0 0 0 0 0 0 0 0 0 0 0 0 0. 0 0 0 0 0 0. 1916. 0 0 0 0 0 0 0 0 0 0 0 0 0 0 0 0 0 0 0 0 0 0 0 0 0. 0 0 0 0 0 0. 1917. 0 0 0 0 0 0 0 0 0 0 0 0 0 0 0 0 0 0 0 0 0 0 0 0 0. 0 0 0 0 0 0. 1918. 0 0 0 0 0 0 0 0 0 0 0 0 0 0 0 0 0 0 0 0 0 0 0 0 0. 0 0 0 0 0 0. 1919. 0 0 0 0 0 0 0 0 0 0 0 0 0 0 0 0 0 0 0 0 0 0 0 0 0. 0 0 0 0 0 0. 1920. 0 0 0 0 0 0 0 0 0 0 0 0 0 0 0 0 0 0 0 0 0 0 0 0 0. 0 0 0 0 0 0. 1921. 0 0 0 0 0 0 0 0 0 0 0 0 0 0 0 0 0 0 0 0 0 0 0 0 0. 0 0 0 0 0 0. 1922. 0 0 0 0 0 0 0 0 0 0 0 0 0 0 0 0 0 0 0 0 0 0 0 0 0. 0 0 0 0 0 0. 1923. 0 0 0 0 0 0 0 0 0 0 0 0 0 0 0 0 0 0 0 0 0 0 0 0 0. 0 0 0 0 0 0. 23.
(24) AD AE AT AU BE BH BN CA CH CY DK DE EL ES FI FR HK IE IL IT IS JP KR LU NL NO NZ PT SG SE UK US 1924. 0 0 0 0 0 0 0 0 0 0 0 0 0 0 0 0 0 0 0 0 0 0 0 0 0. 0 0 0 0 0 0. 1925. 0 0 0 0 0 0 0 0 0 0 0 0 0 0 0 0 0 0 0 0 0 0 0 0 0. 0 0 0 0 0 0. 1926. 0 0 0 0 0 0 0 0 0 0 0 0 0 0 0 0 0 0 0 0 0 0 0 0 0. 0 0 0 0 0 0. 1927. 0 0 0 0 0 0 0 0 0 0 0 0 0 0 0 0 0 0 0 0 0 0 0 0 0. 0 0 0 0 0 0. 1928. 0 0 0 0 0 0 0 0 0 0 0 0 0 0 0 0 0 0 0 0 0 0 0 0 0. 0 0 0 0 0 0. 1929. 0 0 0 0 0 0 0 0 0 0 0 0 0 0 0 0 0 0 0 0 0 0 0 0 0. 0 0 0 0 0 0. 1930. 0 0 0 0 0 0 0 0 0 0 0 0 0 0 0 0 0 0 0 0 0 0 0 0 0. 0 0 0 0 0 0. 1931. 0 0 0 0 0 0 0 0 0 0 0 0 0 0 0 0 0 0 0 0 0 0 0 0 0. 0 0 0 0 0 0. 1932. 0 0 0 0 0 0 0 0 0 0 0 0 0 0 0 0 0 0 0 0 0 0 0 0 0. 0 0 0 0 0 0. 1933. 0 0 0 0 0 0 0 0 0 0 0 0 0 0 0 0 0 0 0 0 0 0 0 0 0. 0 0 0 0 0 0. 1934. 0 0 0 0 0 0 0 0 0 0 0 0 0 0 0 0 0 0 0 0 0 0 0 0 0. 0 0 0 0 0 0. 1935. 0 0 0 0 0 0 0 0 0 0 0 0 0 0 0 0 0 0 0 0 0 0 0 0 0. 0 0 0 0 0 0. 1936. 0 0 0 0 0 0 0 0 0 0 0 0 0 0 0 0 0 0 0 0 0 0 0 0 0. 0 0 0 0 0 0. 1937. 0 0 0 0 0 0 0 0 0 0 0 0 0 0 0 0 0 0 0 0 0 0 0 0 0. 0 0 0 0 0 0. 1938. 0 0 0 0 0 0 0 0 0 0 0 0 0 0 0 0 0 0 0 0 0 1 0 0 0. 1 0 0 0 0 0. 1939. 0 0 0 0 0 0 0 0 0 0 0 0 0 0 0 0 0 0 0 0 0. 0 0 0. 0 0 0 0 0. 1940. 0 0 0 0 0 0 0 0 0 0 0 0 0 0 0 0 0 0 0 0 0. 0 0 0. 0 0 0 0 0. 1941. 0 0 0 0 0 0 0 0 0 0 0 1 0 0 0 0 0 0 0 0 0. 0 0 0. 0 0 0 0 0. 1942. 0 0 0 0 0 0 0 0 0 0 0. 0 0 0 0 0 0 0 0 0. 0 0 0. 0 0 0 0 0. 1943. 0 0 0 0 0 0 0 0 0 0 0. 0 0 0 0 0 0 0 0 0. 0 0 0. 0 0 0 0 0. 1944. 0 0 0 0 1 0 0 0 0 0 0. 0 0 0 0 0 0 0 0 0. 0 0 0. 0 0 0 0 0. 1945. 0 0 0 0. 0 0 0 0 0 0. 0 0 0 0 0 0 0 0 0. 0 0 0. 0 0 0 0 0. 1946. 0 0 0 0. 0 0 0 0 0 0. 0 0 0 0 0 0 0 0 0. 0 0 0. 0 0 0 0 0. 1947. 0 0 0 0. 0 0 0 0 0 0. 0 0 0 0 0 0 0 0 0. 0 0 0. 0 0 0 0 0. 1948. 0 0 0 0. 0 0 0 0 0 0. 0 0 0 0 0 0 0 0 0. 0 0 0. 0 0 0 1 0. 1949. 0 0 0 0. 0 0 0 0 0 0. 0 0 0 0 0 0 0 0 0. 0 0 0. 0 0 0. 0. 1950. 0 0 0 0. 0 0 0 0 0 0. 0 0 0 0 0 0 0 0 0. 0 0 0. 0 0 0. 0. 1951. 0 0 0 0. 0 0 0 0 0 0. 0 0 0 0 0 0 0 0 0. 0 0 0. 0 0 0. 0. 1952. 0 0 0 0. 0 0 0 0 0 0. 0 0 0 0 0 0 0 0 0. 0 0 0. 0 0 0. 0. 1953. 0 0 0 0. 0 0 0 0 0 0. 0 0 0 0 0 0 0 0 0. 0 0 0. 0 0 0. 0. 1954. 0 0 0 0. 0 0 0 0 0 0. 0 0 0 0 0 0 0 0 0. 0 0 0. 0 0 0. 0. 1955. 0 0 0 0. 0 0 0 0 0 0. 0 0 0 0 0 0 0 0 0. 0 0 0. 0 0 1. 0. 1956. 0 0 0 0. 0 0 0 0 0 0. 0 0 0 0 0 0 0 0 0. 0 0 0. 0 0. 0. 1957. 0 0 0 0. 1 0 0 0 0 0. 0 0 0 0 0 0 0 0 0. 0 0 0. 0 0. 0. 1958. 0 0 0 0. 1 0 0 0 0. 0 0 0 0 0 0 0 0 0. 0 0 0. 0 0. 0. 1959. 0 0 0 0. 0 0 0 0. 0 0 0 0 0 0 0 0 0. 0 0 0. 0 0. 0. 1960. 0 0 0 0. 0 0 0 0. 0 0 0 0 0 0 0 0 0. 0 0 0. 0 0. 0. 1961. 0 0 0 0. 0 0 0 0. 0 0 0 0 0 0 0 0 0. 0 0 0. 0 0. 0. 1962. 0 0 0 0. 0 0 0 0. 0 0 0 0 0 0 0 0 0. 0 0 0. 0 0. 0. 1963. 0 0 0 0. 0 0 0 0. 0 0 0 0 0 0 0 0 0. 0 0 0. 0 0. 0. 1964. 0 0 0 0. 0 0 0 0. 0 0 0 0 0 0 0 0 0. 0 0 0. 0 0. 0. 24.
(25) AD AE AT AU BE BH BN CA CH CY DK DE EL ES FI FR HK IE IL IT IS JP KR LU NL NO NZ PT SG SE UK US 1965. 0 0 0 0. 0 0 0 0. 0 0 0 0 0 0 0 0 0. 0 0 0. 0 0. 0. 1966. 1 0 0 0. 1 0 0 0. 0 0 0 0 0 0 0 0 0. 0 0 1. 0 0. 0. 1967. 0 1 0. 0 0 0. 0 0 0 0 0 0 0 0 0. 0 0. 0 0. 0. 1968. 0. 0. 0 0 0. 0 0 0 0 0 0 0 0 0. 0 0. 0 0. 0. 1969. 0. 0. 0 0 0. 0 0 0 0 0 0 0 0 0. 0 0. 0 0. 0. 1970. 0. 0. 0 0 0. 0 0 0 0 0 0 0 0 0. 0 0. 0 0. 0. 1971. 1. 0. 0 0 0. 0 0 0 0 0 0 0 0 0. 0 0. 0 0. 0. 1972. 0. 0 0 0. 0 0 1 0 0 0 0 0 0. 0 0. 0 0. 0. 1973. 0. 0 0 1. 0 0. 0 0 0 0 0 0. 0 1. 0 0. 0. 1974. 0. 0 0. 0 0. 1 0 0 0 0 0. 0. 0 0. 0. 1975. 1. 0 0. 0 0. 0 0 0 0 0. 0. 0 0. 0. 1976. 0 0. 0 0. 0 0 0 0 0. 0. 0 0. 0. 1977. 0 0. 0 0. 0 1 0 0 0. 0. 0 0. 0. 1978. 0 0. 0 0. 0. 0 1 0. 0. 0 0. 0. 1979. 0 0. 0 0. 0. 0. 0. 0. 1 0. 0. 1980. 0 1. 0 0. 0. 0. 0. 0. 0. 0. 1981. 0. 0 0. 0. 0. 0. 0. 0. 0. 1982. 0. 0 0. 0. 0. 0. 0. 0. 0. 1983. 0. 1 0. 0. 0. 0. 0. 0. 0. 1984. 0. 0. 0. 0. 0. 0. 0. 0. 1985. 0. 0. 0. 0. 0. 0. 0. 0. 1986. 0. 1. 0. 0. 0. 0. 0. 0. 1987. 0. 0. 0. 0. 0. 0. 0. 1988. 0. 0. 0. 0. 1. 0. 0. 1989. 0. 0. 0. 0. 0. 0. 1990. 0. 0. 0. 1. 0. 0. 1991. 0. 0. 0. 0. 0. 1992. 0. 0. 0. 0. 0. 1993. 0. 1. 0. 1. 0. 1994. 1. 1995. 0. 0. 1. 0. 1996. 0. 1997. 0. 1998. 0. 1999. 0. 2000. 0. 2001. 0. 2002. 0. 2003. 0. 2004. 0. 2005. 0. 25.
(26) AD AE AT AU BE BH BN CA CH CY DK DE EL ES FI FR HK IE IL IT IS JP KR LU NL NO NZ PT SG SE UK US 2006. 0. 2007. 0. 2008. 0. 2009. 0. 2010. 0. 2011. 0. 2012. 0. 2013. 0. 2014. 1. AD = Andorra, AE = United Arab Emirates, AT = Austria, AU = Australia, BE = Belgium, BH = Bahrain, BN = Brunei, CA = Canada, CH = Switzerland, CY = Cyprus, DK = Denmark, DE = Germany, EL = Greece, ES = Spain, FI = Finland, FR = France, HK = Hong Kong, IE = Ireland, IL = Israel, IT = Italy, IS = Iceland, JP = Japan, KR = South Korea, KW = Kuwait, LU = Luxembourg, NL = Netherlands, NO = Norway, NZ = New Zealand, PT = Portugal, SG = Singapore, SE = Sweden, UK =United Kingdom, US = United States. 0= no universal health care policy adopted, 1 = universal health care policy adopted.. * Sources used see Reference, source list. The cumulative adoption curve shows a very clear S-shape just like the theory and the hypothesis predicted. It becomes especially clear if it is compared with figure 1 and 2. The cumulative adoption curves look almost exactly alike. This shows evidence of a temporal pattern in the adoption of universal health care among the developed nations, which in turn is a strong indicator of policy diffusion. Figure 4: Adoption curves of universal health care policies in developed countries. 26.
(27) From table 1 it is clear that the first country to adopt a universal health care policy was Norway in 1912. Norway, the innovator country, remains alone for more than fifteen years. It isn’t until 1938 when two countries, Japan and New Zealand, join Norway and adopt a universal health care policy as well. Shortly after that Germany and Belgium follow in 1941 and in 1944. Rogers (1995) would have categorized these four countries as the important early adopters. Together they make up 12,5% of the countries in the dataset. They give the spread of universal health care policies a spark and add momentum to the movement. Then in the 1950’s and 1960’s about four countries per decade join the group by adopting universal health care policies of their own. This group includes the UK (1948), Sweden (1955), Bahrain (1957), Brunei (1958), Andorra (1966), Canada (1966), The Netherlands (1966) and Austria (1967). Rogers (1995) would classify this group as the early majority. The United Arab Emirates (1971) and Finland (1972) also belong to this group even though they did not adopt a universal health care policy until the early 70’s. They still fall within the 34% of the early majority group and together with the other early majority countries make up 31.3% of the countries in the dataset (Rogers, 1995). Then between 1970 and 1980 the amount of countries that join reaches its high point when ten countries adopt a universal health care policy. Denmark and Luxembourg both adopt one in 1973, France in 1974, Australia in 1975, Ireland in 1977, Italy in 1978, Portugal in 1979 and Cyprus in 1980. The movement continues, albeit a little less strongly, in the 1980’s when Greece (1983), Spain (1985), Korea (1988) and Iceland (1990) also adopt universal health care policies. According to Rogers’s theory this big group that started to adopt universal health care policies in the 1970’s and the 1980’s could be considered as the late majority (Rogers, 1995). Together this group of countries formed 37,5% of the countries in the dataset. Following this group are the so called laggards who are the slowest in adopting an innovation. This group includes Hong Kong and Singapore, who both adopt a universal health care policy in 1993, quickly followed by Switzerland in 1994 and Israel in 1995. The ultimate laggard is the United States that will adopt a universal health care policy in 2014, which is almost ten years after the last developed country, adopted one. Together the laggards make up 15,6% of the countries in the dataset which fits the theory by Rogers (1995) who uses 16% to mark the laggards group. To summarize, the first hypothesis can be confirmed. Countries are more likely to adopt a universal health care system if other countries already adopted a universal health care system. This can be clearly seen in the S-shaped adoption curve, which shows that the number of adopters increases when the number of countries that have already adopted a policy also increases. When the high point has been reached and most countries have already adopted a universal health care policy the movement slows down and the adoption curve tapers off. This is a strong indicator that policy diffusion occurred in the adoption of universal health care among the developed nations. 27.
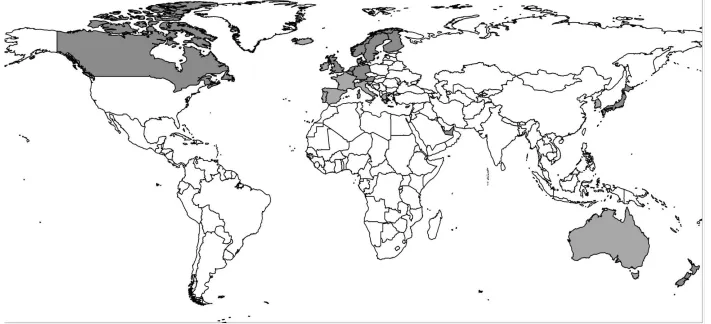
(28) 6. Spatial diffusion patterns in universal health care Now that the first part of the research question about the occurrence of temporal patterns has been answered it is time to focus on the spatial aspect which will be done in this chapter. To study whether spatial patterns in the adoption of universal health care among the developed countries can be observed two hypotheses were tested. As was explained in chapter 3.2 spatial diffusion patterns can be linked to the likelihood that states adopt policies in relation to their neighbors. Therefore the following hypothesis was used to uncover any spatial diffusion patterns in the adoption of universal healthcare: The likelihood that a state adopts a universal health care system is higher when its geographic neighbors have already adopted a universal health care system. To find out whether this is indeed the case a map was created that shows which countries adopted universal health care in what year category. To keep things clear only the following five categories were used: 1912, 1913-1944, 1945-1972, 19730-1990 and 1991-2014. Each category corresponds with one of the groups proposed by Rogers (Rogers, 1995). 1912 corresponds with the innovators, 1913-1944 with the early adopters, 1945-1972 with the early majority, 19730-1990 with the late majority and 1991-2014 with the laggards. The earlier the category the darker the color will be, meaning that countries adopting universal health care in 1912 will be black and countries that adopt universal health care between 1991 and 2014 will be a very light grey. To show the spread of universal health care among the developed nations separate maps were also created for each category and can be found in figure 6, 7, 8, 9, and 10. While the results of the S-curve in the previous chapter showed a rather obvious pattern, the pattern on the maps here is far less obvious (see figures 5, 6, 7, 8, 9, and 10). According to the theory it should depict the diffusion of universal health care as ink-blots (J. L. Walker, 1969), meaning that the first countries to adopt it are the darkest in color, with their neighbors, who adopt it after them, slightly lighter in color. The maps with the adoption categories should depict a similar spread. The map depicting the innovators should show the first policy adopters, followed by the early adopters map that should show the innovator countries being surrounded by neighbors who have also adopted universal health care. The early majority map should then show the early adopters being surrounded by neighbors that have also adopted universal health care. The same goes for the late majority and laggards maps. With Norway being the first adopter it would mean that universal health care policies were supposed to, according to the theory, spread first to Europe and then to the rest of the world. This would mean, in an ideal situation, that Norway would be darkest in color, as it was the first to adopt universal health care. Then it should have been followed by Sweden, Denmark and. 28.
(29) Figure 5: The spread of universal health care in the developed countries. 29.
(30) Figure 6: The spread of universal health care in the developed countries – 1912 (innovator). 30.
(31) Figure 7: The spread of universal health care in the developed countries – 1944 (early adopters). 31.
(32) Figure 8: The spread of universal health care in the developed countries – 1972 (early majority). 32.
(33) Figure 9: The spread of universal health care in the developed countries – 1990 (late majority). 33.
(34) Figure 10: The spread of universal health care in the developed countries – 2014 (laggards). 34.
(35) Finland colored in a very dark grey. This is however not the case as New Zealand, Japan and Germany are the first to follow Norway, not Sweden Denmark and Finland. The individual maps separated by adoption category also show that Sweden, Denmark and Finland are not part of the early adopters. Instead they are part of the early and late majority. This clearly contradicts the theory about spatial diffusion patterns as New Zealand and Japan are very far apart from Norway. Not only are they far away from Norway, they are also far apart from each other. While Germany is a lot closer to Norway than Japan and New Zealand, it is not a neighboring country either. If the map is more closely examined there does seem to be some sort of pattern among the Scandinavian countries (see figure 11). The map shows Norway as the darkest in color and thus as the innovator, with its neighbor, Sweden, in a medium grey. Followed by Sweden’s neighbors, Finland, also in medium grey and Denmark in a lighter shade of grey. This makes it look like a pattern at first glance, however if the event history table is used and placed next to the map, the pattern weakens. From the event history table one can see that Norway is the first to adopt a universal health care policy in 1912 and is followed by Sweden in 1955. There are more than four decades between them. The longer it takes for a neighbor to adopt the more uncertain one can be that it was the neighbor that somehow caused the surrounding countries to also adopt universal health care. In other words, whether policy was diffused between them. While it is true that it was not until 1938 when other countries started to adopt universal health care policies, there are still six countries that preceded Sweden in adopting them. It is therefore not dark grey in color but a medium grey, making the pattern rather weak. Looking at Sweden’s neighbors does not make the pattern any stronger. Finland and Denmark follow Sweden in 1972 and 1973, which results in a medium grey for Finland and a light grey for Denmark. The first countries that adopt a universal health care policy after Sweden are Bahrain, Brunei, Canada, The Netherlands, Austria and the United Arab Emirates. So even though they did ‘follow’ Sweden within a certain time period, they were certainly not the first to do so. They did however adopt a universal health care policy right after each other, Finland in 1972 and Denmark in 1973. This is the only geographic ‘pattern’ among the Scandinavian countries. Most of the findings here go against the theory and the predictions made by Walker (1973) and Weyland (2005) who predicted that innovations would be first emulated by neighboring countries before spreading to other regions. This would result in an ink-blot like pattern spatial adoption pattern. It should be quite clear now that this is not the case here. The first time that the innovation was adopted somewhere else it was at the other side of the world, while the theory predicted that it should have been adopted by a neighbor or at least by a country in the same region as the innovator.. 35.
(36) Figure 11: The spread of universal health care in Europe. Even though there are no prominent spatial patterns visible in the adoption of universal health care, some things do stand out, like some of the mediteranean countries. Italy, Portugal, Cyprus, Greece and Spain all adopt universal health care systems after each other. Unfortunately this does not appear on the map due to the limited amount of categories. However, the maps do show that all of them belong to the late majority group of adopters (see figure 5 and 9). Italy is the first to adopt a universal health care policy in 1978 followed by Portugal in 1979, Cyprus in 1980, Greece in 1983 and Spain in 1986. Most do not follow a neighboring country except for Greece that adopts a universal health care policy three years after Cyprus. This seems to be the only account of neighboring countries adopting universal health care policies after each other.The only thing that comes close is the aforementioned case of Finland and Denmark. While they are not neighboring countries they both share a border with Sweden. Testing the ‘Families of Nations’ theory has mixed results. The third hypothesis predicts that the likelihood that a state adopts a universal health care system is higher if states from the same family of nations have already adopted a universal health care system. This does not seem to always be the case. Starting with the Englisch speaking family of nations, which includes, New-Zeeland, the United Kingdom, Canada, Australia, Ireland and the United States. This family of nations is very mixed in regards to the year in which they adopt universal health care. As can be seen in Figure 7, NewZeeland is part of the early adopters group, the United Kingdom and Canada are part of the early majority, Australia and Ireland are part of the late majority and the United States is part of the. 36.
(37) laggards. There does not seem to be any cohesion in their adoption rate let alone a pattern. However, if the event history table is consulted one can see that Ireland is the first to adopt universal health care after Australia. This is not enough though to be considered as a pattern.. The second family is the Continental family of nations, which constists of Austria, Belgium, France, Germany, Italy and the Netherlands and closely resembles the first family in its inconsistency. From figure 6 it is clear that Germany and Belgium are part of the early adopters, that Austria and the Netherlands are part of the early majority and that France and Italy are part of the late majority. Again no pattern emerges. However, the event history table does show that Belgium was the first to adopt universal health care after Germany and that Austria also is the first to adopt universal health care after the Netherlands. France and Italy also adopt universal health care relatively close after one another. No real pattern emerges though because there is too much distance in between these ‘mini patterns’. This results in the three different adopter categories (early adopter, early majority and late majority).. The third family is the Scandinavian family of nations and consists of Denmark, Finland, Norway and Sweden. This family of nations also has diverging years of adoption, albeit less than the previous two families. In figure 5 one can see that Norway is the innovator, that Sweden and Finland are among the early majority and that Denmark is part of the late majority. If the event history table is consulted it is can be seen that Denmark (together with Luxembourg) adopts a universal health care policy one year after Finland. While there are two countries that adopted universal health care right after each other, no real pattern can be found in the Scandinavian family of nations.. The fourth family of nations is the Southern family of nations comprising of Greece, Portugal and Spain. This is the most cohesive family of nations. As can be seen in figure 5, all the countries belong to the late majority group and adopt universal health care policies closely after one another. This is confirmed by the event history table which shows that Portugal was the first of its family to adopt universal health care, followed after four years by Greece. Spain was the first to adopt universal health care right after Greece, a few years later. A pattern of policy diffusion can thus be found among the Southern family of nations.. To quickly summerize, there are some indicators that hint at a geographic spatial diffusion pattern in the adoption of universal health care, mainly among the scandinavian and the mediteranean countries. However these indicators are rather weak and are certainly not strong enough to overcome the gap between the predictions of the theory and practise. Therefore it is safe to say that 37.
(38) the second hypothesis of this research project, which is: The likelihood that a state adopts a universal health care system is increased if its geographic neighbors have already adopted a universal health care system, cannot be confirmed. The third hypothesis which is, the likelihood that a state adopts a universal health care system is higher if states from the same family of nations have already adopted a universal health care system, also cannot be confirmed. While more evidence was found for a cultural spatial pattern than for a geographic spatial pattern, it was not enough to confirm the third hypothesis. Only in the Southern family of nations a real pattern was found, while in the other families only small indicators were found.. 7. Conclusion The intention of this bachelor thesis was to examine whether there were spatial or temporal patterns in the adoption of universal health care among the developed countries. In order to do this the following research question was formulated: To what extend can temporal or spatial patterns be observed among the adoption of universal health care policies in the developed nations, between 1912 and 2014? For practical purposes the research question was split into two parts, each with its own corresponding hypotheses. The first part focused on the temporal aspect of the research question as it tried to find out if there was indeed a temporal pattern in the adoption of universal health care. The hypothesis, “the likelihood that a state adopts a universal health care system is increased by the amount of other states that have already adopted a universal health care system” was formulated to help find an answer. To find out if the hypothesis was indeed true, a cumulative adoption curve was created with the acquired data. The cumulative adoption curve was indeed S-shaped which means that the hypothesis is indeed true. Countries are more likely to adopt a universal health care policy if the number of countries that have already adopted such a policy increases. When the high point has been reached and most countries have already adopted a universal health care policy the adoption rate slows down and the adoption curve tapers off. This is a strong indicator that universal health care policies were diffused among the developed nations. The second part focused on the spatial aspect of the research question and looked at whether there was a spatial pattern in the adoption of universal health care policies. To answer this, two hypotheses were formulated. The first on was “the likelihood that a state adopts a universal health care system is increased if its geographic neighbors have already adopted a universal health care system”. To test the hypothesis a map was created that showed when countries adopted universal 38.
(39) healthcare. The map showed that geographic neighbors were actually not prone to ‘follow’ each other in adopting universal health care policies. There were some weak indicators that hinted at a geographic spatial pattern, mainly among the Scandinavian and the Mediterranean countries. However these were not strong enough to overcome the gap between the predictions of the theory and practise. Thus the second hypothesis cannot be confirmed. The third hypothesis, “the likelihood that a state adopts a universal health care system is higher if states from the same family of nations have already adopted a universal health care system” could also not be confirmed. While there was more evidence for a cultural spatial pattern than for a geographic spatial pattern it was not enough to actually confirm the hypothesis.. Now that the seperates parts of the research question have been answered, the entire research question can also be answered. There is definintely a temporal diffusion pattern in the adoption of universal health care policies among the developed countries, which means that the theory described by Rogers, Gray and Weyland is true when it comes to the diffusion of universal health care policies. However the same cannot be said about possible spatial patterns. While there were some indicators of a spatial pattern they were too weak to confirm th existence of spatial patterns. So there is a temporal pattern but no spatial pattern in the adoption of universal health care among the developed countries. This means that countries are indeed more likely to adopt universal health care if other countries have already adopted universal health care. The likelyhood does not seem to be influenced by geographical proximity of the other countries that have already adopted universal health care nor by whether these countries are in the same family of nations. Overall though, the research shows that there are strong signs of policy diffusion of universal health care policies among the developed countries.. For future research it is interesting to take a closer look at some of the mediteranean countries and the Southern family of nations and search for more indicators of policy diffusion of universal health care. The Southern family of nations was the only family that did show a pattern in the adoption of universal health care and all of the mediteranean countries that were included in the dataset, with the exeption of Isreal, belonged to the same adopters catagorie. More research could also be done about the thirteen countries that were not included in the families of nations. First research would need to be done to determine whether they fit into one of the existing four families or whether new families of nations need to be created. Once this is done one can examine if these new families of nations show stronger or weaker sign of spatial policy diffusion patterns in the adoption of universal health care.. 39.
(40) 8. References Barack. Obama on the issues. (2008). Washington http://projects.washingtonpost.com/2008-presidentialcandidates/issues/candidates/barack-obama/#health-care. Post.. Retrieved. from. Beck, N., Gleditsch, K. S., & Beardsley, K. (2006). Space in more than Geography: Using Spatial Econometrics in the Study of Political Economy’,. International Studies Quarterly, 50, 27-44. Berry, F. S., & Berry, W. D. (1990). STATE LOTTERY ADOPTIONS AS POLICY INNOVATIONS - AN EVENT HISTORY ANALYSIS. [Article]. American Political Science Review, 84(2), 395-415. Bigg, M. (2010). U.N. health organization praises U.S. health reforms. Reuters. Retrieved from http://www.reuters.com/article/2010/03/24/us-usa-healthcare-whoidUSTRE62N5AU20100324 Broek, R. L. a. E. A.-v. d. (2010). The Drawbacks of Dutch-Style Health Care Rules: Lessons for Americans. Backgrounder, 2435. Busse, R., & Riesber, A. (2004). Health Care Systems in Transition - Germany: The European Observatory on Health Systems and Policies. Castles, F. G. (1993). Families of Nations. Patterns of Public Policy in Western Democracies. Aldershot: Dartmouth Publishing Company. Castles, F. G., & Obinger, H. (2008). Worlds, Families, Regimes: Country Clusters in European and OECD Area Public Policy. West European Politics, 31(1-2), 321-344. CSDH. (2008). Closing the gap in a generation: health equity through action on the social determinants of health. Final Report of the Commission on Social Determinants of Health. Geneva: World Health Organization. Dobbin, F., Simmons, B., & Garrett, G. (2007). The global diffusion of public policies: Social construction, coercion, competition, or learning? [Review]. Annual Review of Sociology, 33, 449-472. Docteur, E., Suppanz, H., & Wo, J. (2003). The US health system: an assessment and prospective directions for reform: OECD. Dolowitz, D., & Marsh, D. (1996). Who learns what from whom: A review of the policy transfer literature. Political Studies, 44(2), 343-357. Dolowitz, D. P., & Marsh, D. (2000). Learning from abroad: The role of policy transfer in contemporary policy-making. Governance-an International Journal of Policy and Administration, 13(1), 5-24. Elkins, Z., & Simmons, B. (2005). On Waves, Clusters, and Diffusion: A Conceptual Framework. The ANNALS of the American Academy of Political and Social Science, 598(1), 33-51. Figueras, J., Mckee, M., Mossialos, E., & Saltman, R. B. (2004). Social health insurance systems in western Europe Gray, V. (1973). Innovation in the States: A Diffusion Study. The American Political Science Review, 67(4), 1174-1185.. 40.
Figure


+7


Outline
Related documents
WK: 10 In reports, students demonstrate use of a range of elaboration strategies by… • Identifying details/information related to topic or to a given focus (pictures
Nevertheless, despite differences in microbiota between male and female mice evident in our data as well as in previous reports [ 44 ], ASV_5969 was transferred from Jax to Tac in
Note the Change: a Comparative Study of Demonetization Efforts Note the Change: a Comparative Study of Demonetization Efforts in India and Sweden.. in India and Sweden
Therefore, based on the fact above, through this study, the author is intended to (1) map the implementation maturity of risk management and (2) figure out the influence of
As little as 9 g of high quality milk protein is able to augment the downstream signalling response induced by resistance exercise in middle aged men but does not po- tentiate
This Qualification is the industry standard for veterinary nurses who provide support for an extensive range of emergency and critical care procedures within a veterinary hospital or
Please read and make sure you understand all of the safety warnings and precautions prior to using your Giraffe Heavy Duty extension wand.. If you have any questions regarding the
Schematic diagrams for (a) overview of the proposed simulation processes, (b) a lithium ion battery composed of an anode, a separator, and a cathode, (c) representing
