In animal production it is necessary to improve genotypic and some environmental conditions (feeding, climate, ventilation and temperature) in order to increase the efficiency of selection meth-ods. However, conventional methods for enhanced production in animal husbandry take longer pe-riods of time and involve some difficulties both in keeping animals alive and controlling diseases. Therefore, methodologies rendering faster solu-tions and/or innovasolu-tions in more economical tech-niques have gained more importance.
One of the factors affecting the quality of car-casses in broilers is the abdominal fat ratio. Excess fattening in chicken carcasses is not desirable be-cause of consumer preferences, and excess fatten-ing causes some difficulties in slaughterfatten-ing and lowering the rate of feed efficiency of broilers.
As reported by Scheele et al. (1981), total body weights in broilers usually have 15–20% fat that is distributed in the carcass as follows; (1) 15% is in the blood and other organs and (2) 85% is found in some adipose tissues such as abdominal
fat, skin and muscles (Evans, 1977). The abdomi-nal fat tissue constitutes approximately 2–3% of the broiler live weight (Leenstra, 1986). Sex, age, feed efficiency, genotype and feeding are some of the main factors affecting abdominal fattening in broilers. Fat tissues are larger in female and old broilers than in male and young ones (Edwards et al., 1973). Chickens with good feed-conversion abil-ity have less abdominal fat (Whitehead and Griffin, 1984). Differences in abdominal and carcass fats between genotypes have been shown to indicate the importance of the genetic effect in fat deposition (Edwards and Denman, 1975). Feeding factors have a considerable impact on the carcass composition of broiler chickens (McLeod, 1982).
Amino acid deficiency in feeds affects animal metabolism as it changes the feeding pattern and also causes a lowered feed intake proportional to the amino acid deficiency (Rogers and Leung, 1973; Boorman, 1979). The reason for low feed in-take is a rapid decrease in the limiting amino acid concentration in blood induced by imbalanced
Relationship between abdominal fat and methionine
deficiency in broilers
S. KIRAZ, T. ŞENGÜL
Department of Animal Science, Faculty of Agriculture, Harran University, Sanliurfa, Turkey
ABSTRACT: A study was conducted to determine the relationship between abdominal fat and the intake of methio-nine deficient diet in broilers. In this study, 66 male broilers at the age of 35 days were used. They were divided into two groups (control, n = 13, and methionine deficient group, n = 53) and all birds were housed in individual pens. During the experiment, normal and deficient diet contained 0.55% and 0.25% methionine, respectively. Control group was fed normal diet for 19 days. Treatment group received methionine deficient diet for 4 days and normal diet for 15 days. Body weight and feed intake were recorded daily. High (HG) and low (LG) groups were theoretically created according to the rates of decreases in individual feed intake. Percent decrease in feed intake of HG and LG groups was 29.4 ± 2.0 and –1.3 ± 1.7, respectively. Abdominal fat in HG and LG groups amounted to 1.62 ± 0.1 and 1.73 ± 0.2%, respectively. The feed conversion ratio of HG and LG groups was 3.1 ± 0.1 and 3.4 ± 0.2, respectively. There was a negative correlation (–0.45 in HG and –0.43 in LG) between the percent decrease in feed intake and abdominal fat.
amino acids (Harper et al., 1970). Additionally, inadequate amino acid intake affects animal ap-petite, growth and reproduction (Boorman, 1979). Picard et al. (1993) studied the reactions of broiler chickens to feed intake using feeds with deficient essential amino acids and found that within the first 24 hours deficient feeds were taken up at a lower rate by 26% compared to standard feeds. Pesti et al. (1994) stated that the genetic struc-ture plays an important role in determining the relationship between the plasma amino acid con-centration and carcass composition. Similarly, Boa-Amponsem et al.(1991) reported that genetic stocks might have different responses to amino acid deficiency and/or imbalance. There are two leading factors contributing to differences in pro-tein intake between lean and fat lines: namely, the determination of genetic effects on protein synthesis and degradation and an increased level of amino acid oxidation in FL lines (Whitehead and Griffin, 1986).
The goal of this study was to determine the rela-tion between the levels of individual abdominal fat-tening insufficient methionine feed intake in broiler chickens. Thus, better feed converting chickens, fed with deficient methionine feeds and depending on the decrease in feed intake, determined based on
their feed consumption in a short period of time. Namely, this method was investigated if it could be used as an indirect selection criterion.
MATERIAL AND METHODS
Animals and housing
The animal material consisted of 66 male broil-ers that were 35 days old (Avian). Chickens were randomly placed in individual compartments with wooden floors (45 × 45 × 45 cm in size) and wood shavings as litter. In this study individual feeders and water cups were used. Fluorescent lamps were used for lighting in a period of 23 : 1 hours (light: dark) each day.
Feeds and feeding
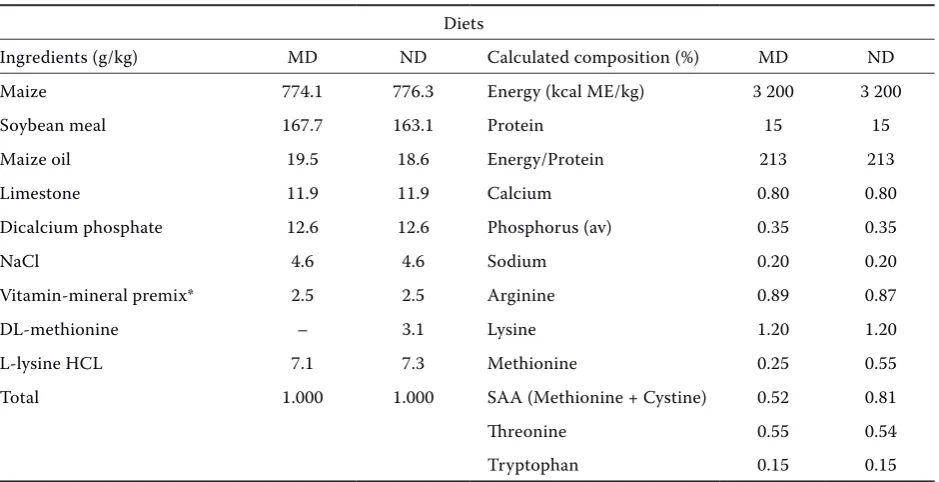
[image:2.595.64.534.470.711.2]Two different diets were applied: the one was pre-pared normally (ND) while the other was deficient in methionine (MD). The only difference between normal diet and methionine-deficient one was the content of synthetic crystallized DL-methionine (Table 1).
Table 1. Composition of methionine-deficient (MD) and normal (ND) diets
Diets
Ingredients (g/kg) MD ND Calculated composition (%) MD ND
Maize 774.1 776.3 Energy (kcal ME/kg) 3 200 3 200
Soybean meal 167.7 163.1 Protein 15 15
Maize oil 19.5 18.6 Energy/Protein 213 213
Limestone 11.9 11.9 Calcium 0.80 0.80
Dicalcium phosphate 12.6 12.6 Phosphorus (av) 0.35 0.35
NaCl 4.6 4.6 Sodium 0.20 0.20
Vitamin-mineral premix* 2.5 2.5 Arginine 0.89 0.87
DL-methionine – 3.1 Lysine 1.20 1.20
L-lysine HCL 7.1 7.3 Methionine 0.25 0.55
Total 1.000 1.000 SAA (Methionine + Cystine) 0.52 0.81
Threonine 0.55 0.54
Tryptophan 0.15 0.15
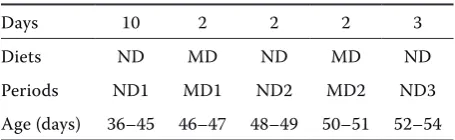
At the beginning, chickens were divided into two groups according to their live weights in such a way that one group was a treatment group (MD) (1695 ± 23 g, n = 53) and the other was a control group (1715 ± 54 g, n = 13) with no statistical difference. Feeding was carried out in different periods during the growth period as shown in Table 2. All chickens were fed normal diet for the first 10 days (ND1). Control group received normal diet throughout the study. Treatment group was fed methionine-defi-cient diet on the 11th and 12th day (MD1) and on the 13th and 14th day it received normal diet (ND2); then on the 15th and 16th day methionine-deficient diet (MD2), and finally on the 17th, 18th, and 19th day the birds received normal diet.
Measurements
Live weight and feed intake were measured on a daily basis, at 5:00 pm throughout the study. At the end, all chickens were slaughtered and their abdominal fat and carcass weights were measured with a digital scale (±1 g sensitivity).
Decrease in feed intake, forming the groups and the analysis
To determine the relationship between abdomi-nal fattening and decrease in feed intake, the fol-lowing relation was used in treatment groups: DFI = [(A – B)/A] × 100 (1)
where: DFI = percent decrease in feed intake (%)
A = average amount of feed taken during the
period of ND2 (g)
B = average amount of feed taken during the
period of MD2 (g)
Because of possible behavioural problems in chickens fed methionine-deficient diet in period 1
for the first time, the decreases in feed intake re-corded in the second period were taken as a basis for our calculations (Kare and Rogers, 1976).
Groups were formed on the basis of feed intake values calculated from equation 1. These values were arranged in an ascending order, and 10 chick-ens with the highest decrease in feed intake were designated as the high group (HG). Other 10 chick-ens with the lowest decrease were included in the low (LG) groups. Statistical analysis was carried out using SPSS (version 10.0) software.
RESULTS
Daily feed intake
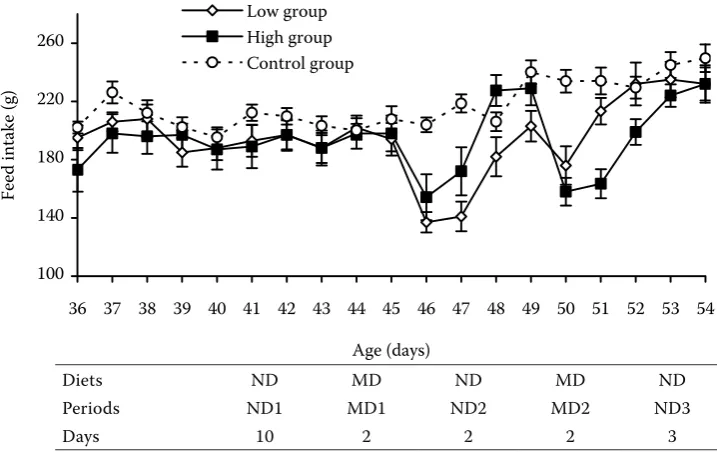
Average feed intake with standard error values taken from 10 chickens is represented by a whisker diagram (period of days 36–45 in Figure 1). During the first 10-day period of feeding an adequate di-etary methionine content, the feed intake values of three groups showed a similar pattern resulting in an insignificant difference (Figure 1). In the first two-day period of methionine-deficient feeding (days 46–47), LG and HG groups had the markedly lowest feed intake. After that period, on the first day (period of days 48–49 in Figure 1) when normal diets were given to chickens, the feed consumption increased in both groups (LG and HG). A similar feed intake pattern was also observed in the second period (period of days 49–54 in Figure 1) of methio-nine-deficient feeding. Both groups increased their average daily feed intake up to the control level on the third day of normal feeding period (ND3).
Average feed intake in different feeding periods
[image:3.595.63.291.100.170.2]In the first 10-day period, the analysis of feed consumption indicated no significant differences between groups (Table 3). In the MD1 period, feed intake values differed significantly between the groups (P < 0.01). There was no difference between control group (CG) and HG in the first period in which normal feeding was low in ND2, however, LG was significantly different (P < 0.01) compared to CG. In the MD2 period, feed intake values sig-nificantly differed between the three groups (P < 0.01), but there was no difference between the three groups in the third period.
Table 2. Feeding periods
Days 10 2 2 2 3
Diets ND MD ND MD ND
Periods ND1 MD1 ND2 MD2 ND3
Age (days) 36–45 46–47 48–49 50–51 52–54
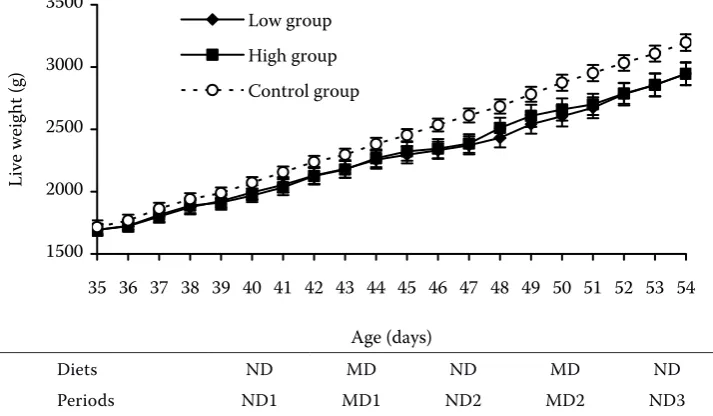
Live weight
Live weight values (average of 10 chickens) of control group were higher compared to the other groups in all feeding periods (P < 0.05). The differ-ence was even more pronounced starting from the 46th day of methionine-deficient feeding.
Feed consumption and feed conversion ratio
In the first 10-day period, the feed conversion ra-tio, live weight gain and feed consumption values of LG and HG indicated that HG feed efficient values were higher than LG. However, there was no signifi-cant difference between the groups (Table 4).
Relation between decrease in feed intake (DFI %) and abdominal fat
In LG and HG groups, the values of a decrease in feed intake and abdominal fat were –1.3, 29.4 (%) and 1.73, 1.62 (g/100g LW), respectively (Table 5). The correlations between abdominal fat (AF) values and decrease in feed intake (DFI) were –0.43 and –0.45 for the LG and HG groups, respectively. The regressions of AF on DFI resulted in the following coefficients:
For LG group: AF = –0.0435 [DFI] + 1.6748 For HG group: AF = –0.0222 [DFI] + 2.2676 100
140 180 220 260
36 37 38 39 40 41 42 43 44 45 46 47 48 49 50 51 52 53 54
Age (days)
Feed
intake
(g)
Low group High group Control group
Diets ND MD ND MD ND
Periods ND1 MD1 ND2 MD2 ND3
[image:4.595.116.475.86.314.2]Days 10 2 2 2 3
Table 3. Standard errors and average values (g/day) of feed intake for feeding periods
Periods CG (n = 13) LG (n = 10) HG (n = 10)
ND1 (days 36–45) 207 ± 1.2a 196 ± 6.2a 193 ± 10.6a
MD1 (days 46–47) 212 ± 5.3c 139 ± 6.3a 164 ± 12.7b
ND2 (days 48–49) 223 ± 4.8b 193 ± 7.6a 228 ± 10.8b
MD2 (days 50–51) 233 ± 7.1c 195 ± 6.8b 161 ± 7.4a
ND3 (days 52–54) 241 ± 6.6a 233 ± 10.6a 218 ± 7.9a
CG = control group, LG = cow group, HG = high group MD = methionine-deficient diet, ND = normal diet
[image:4.595.63.532.607.710.2]a,b,c =values within a row with no common superscripts differ significantly (P < 0.01)
DISCUSSION
In this study, the first symptom of amino acid defi-ciency in diets was a decrease in animals’ appetite simi-larly like in previous studies (Rogers and Leung, 1973; Picard et al., 1993). When given adequate feeding after
methionine-deficient diet the feed intake values ad-justed to the normal level on the same day similarly like in Almquist (1954) and Picard et al. (1993).
[image:5.595.65.533.114.184.2]This research indicated that the values of ab-dominal fattening of the two experimental broiler groups were numerically different. Although the Table 4. Feed consumption, live weight gain and feed conversion ratio of groups in the period of ND1 (days 36– 45)
Traits LG (n = 10) HG (n = 10)
Feed consumption (g) 1 956 ± 62 1 921 ± 106
Live weight gain (g) 603 ± 41 631 ± 53
Feed conversion ratio 3.4 ± 0.2 3.1 ± 0.1
[image:5.595.61.532.262.347.2]LG = low group, HG = high group
Table 5. The average values and standard errors of abdominal fat (AF), decrease in feed intake (DFI), carcass weight (g) and carcass percentage (carcass weight/live weight) in low (LG) and high (HG) groups
Traits LG (n = 10) HG (n = 10)
Decrease in feed intake (DFI) (%) –1.3 ± 1.7 29.4 ± 1.2
Abdominal fat (AF) (g/100g LW) 1.73 ± 0.2 1.62 ± 0.1
Carcass weight (g) 2 021 ± 74 2 063 ± 71
Carcass percentage (%) 68.4 ± 0.7 70.1 ± 0.8
LG = low group, HG = high group
Diets ND MD ND MD ND
Periods ND1 MD1 ND2 MD2 ND3
Days 10 2 2 2 3
1500 2000 2500 3000 3500
35 36 37 38 39 40 41 42 43 44 45 46 47 48 49 50 51 52 53 54
Age (days)
Li
ve
w
ei
gh
t (
g)
Low group High group Control group
[image:5.595.117.474.406.614.2]feed intake values of LG group were higher than those in HG group, these fattened LG group chick-ens had lower live weight gains indicating that HG was more feed efficient than LG. Similarly, in previ-ous studies lean lines (LL) had better feed conver-sion efficiency than fat lines (FL) (Leclercq, 1983; Whitehead and Griffin, 1985). This result agrees with the study of Geraert et al. (1990), who stated that the need of some amino acids might vary de-pending on the genotype and the ideal balance of amino acids might show differences between fat and less fat lines. This opinion was also supported by Pesti et al. (1994) and Saunderson (1988), who reported differences in the metabolism of 1 amino acid between the fat and lean lines, and by Leclerq et al. (1983) and Geraert et al. (1987), who found out differences in plasma profiles of 2 amino acids between the LL and FL lines. Pym (1990) explained differences in both metabolism and nutrition re-quirements via genetic variation in birds.
CONCLUSION
This study indicated that the amino acid need in broilers differs depending on fatty and less fatty groups. The less fatty group (HG) needs a higher amount of methionine, therefore it is more sensitive to methionine deficient feeding. Consequently, the use of methionine-deficient feeding against abdom-inal fattening might be utilized in broiler chickens as an indirect selection criterion.
REFERENCES
Almquist H.J. (1954): Utilization of amino acid by chick. Arch. Biochem. Biophys., 52, 197–202.
Boa-Amponsem K., Dunnington E.A., Siegel P.B. (1991): Genotype, feeding regimen, and diet interactions in meat chickens, II. Feeding behaviour. Poult. Sci., 70, 689–696.
Boorman K.N. (1979): Regulation of protein and amino acid intake. In:Boorman K.N., Freeman B.M. (eds.): Food Intake Regulation in Poultry. British Poultry Sci-ence Ltd., Symposium XIV. Edinburgh, Scotland. 87–126.
Edwards Jr. H.M., Denman F., Abou-Ashour A., Nugara D. (1973): Carcass composition studies. 1. Influences of age, sex and type of dietary fat supplementation on total carcass and fatty acid composition. Poult. Sci.,
52, 934–948.
Edwards H.M. Jr., Denman F. (1975): Carcass compo-sition studies. 2. Influences of breed, sex and diet on gross composition of the carcass and fatty acid com-position of the adipose tissue. Poult. Sci., 54, 1230– 1238.
Evans A.J. (1977): The growth of fat. In: Boorman K.N., Wilson B.J. (eds.): Growth and Poultry Meat Produc-tion. Brit. Poult. Sci. Ltd. Edinburgh, Scotland. 29– 64.
Geraert P.A., Leclercq B., Larbier M. (1987): Effects of dietary glucogenic amino acid supplementation on growth performance, body composition and plasma free amino acid levels in genetically lean and fat chick-ens. Reprod. Nutr. Develop., 28, 1041–1051.
Geraert P.A., Larbier M., Leclercq B., Macleod M.G. (1990): Nitrogen metabolism in genetically fat and lean chickens. Poult. Sci., 69, 1911–1921.
Harper A.E., Benevenga N.J., Wohlhueter R.M. (1970): Effects of ingestion of disproportionate amounts of amino acids. Physiol. Rev., 50, 428–558.
Kare M.R., Rogers J.R. Jr. (1976): Sense of organs. In: Sturke P.D. (ed.): Avian Physiology. Springer Verlag, New York. 29–52.
Leclercq B. (1983): The influence of dietary protein con-tent on the performance of genetically lean or fat grow-ing chicken. Brit. Poult. Sci., 24, 581.
Leenstra F.R. (1986): Effect of age, sex, genotype and environment on fat deposition in broiler chickens. World’s Poult. Sci. J., 42, 12–25.
McLeod J.A. (1982): Nutritional factors influencing carcass fat in broilers. Zootechn. Int., 7, 60–64.
Pesti G.M., Leclercq B., Chagneau A.M., Cochard T. (1994): Comparative responses of genetically lean and fat chickens to lysine, arginine and non-essential amino acid supply: II. Plasma amino acid responses. Brit. Poult. Sci., 35, 697–707.
Picard M.L., Uzu G., Dunnington E.A., Siegel P.B. (1993): Food intake adjustment of chicks: short term reactions to deficiencies in lysine, methionine and tryptophan. Brit. Poult. Sci., 34, 737–746.
Pym R.A.E. (1990): Nutritional genetics. In: Crawford R.D. (ed.): Poulty Breeding and Genetics. Elsevier, Am-sterdam. 847–876.
Rogers Q.R., Leung P.M.B. (1973): The influence of amino acids on the neuroregulation of food intake. Federation Proceedings American Socs., Experimental Biology,
32, 1709–1719
Scheele C.W., Schagen P.J.W., Van. H., Ten H.G.M. (1981): Abdominal and total fat content of three broiler strains at two ages affected by nutritional factors. In:Mulder R.W.A.W., Scheele C.W., Veer-kamp C.H., Beekbergen (eds.): Quality of Poultry Meat. The Netherlands. 397–407.
Whitehead C.C., Griffin H.D. (1984): Development of divergent lines of lean and fat broilers using plasma very low density lipoprotein concentration as selection criterion: The first three generations. Brit. Poult. Sci.,
25, 573–582.
Whitehead C.C., Griffin H.D. (1985): Direct and corre-lated response to selection for decreased body fat in
broilers. In: Hıll W.G., Manson J.M., Hewitt D., Harlow (eds.): Poultry Genetics and Breeding, Brit. Poult. Sci. Ltd., 113–123.
Whitehead C.C., Griffin H.D. (1986): Development of divergent lines of lean and fat broilers using plasma very low density lipoprotein concentration as selection criterion: result over the four generation and lack of effect of dietary fat on performance and carcass fat content. Brit. Poult. Sci., 27, 317–324.
Receipt: 04–09–29 Accepted after corrections: 05–03–10
Corresponding Author
Assoc. Prof. Dr. Turgay Şengül, Harran University, Faculty of Agriculture, Department of Animal Science, 63200 Sanliurfa, Turkey