Mechanical Properties and Press Formability at Room Temperature of AZ31 Mg Alloy Processed by Single Roller Drive Rolling
7
0
0
Full text
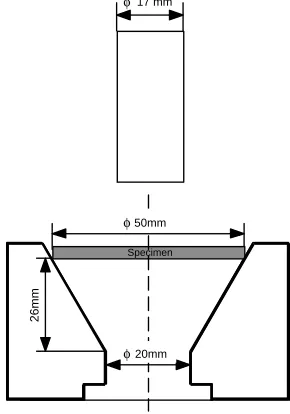
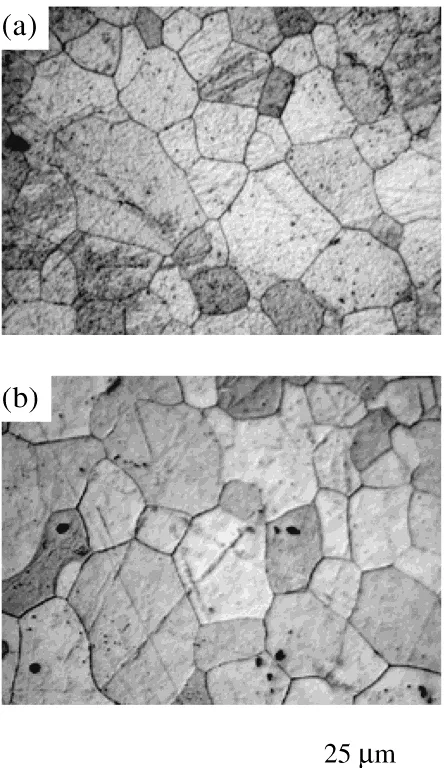
(2) Mechanical Properties and Press Formability at Room Temperature of AZ31 Mg Alloy Processed. temperature, where the angle between the tensile direction and the rolling direction was 0 deg. Additional tensile tests were conducted for the specimens rolled at 673 K, where the angle between the tensile direction and the rolling direction was 45 deg and 90 deg to investigate the anisotropy of tensile properties. The Lankford value (r-value) for each direction was measured on the specimens deformed to ε = 5%. Specimens with 50 mm in diameter and 1 mm in thickness were machined from the sheets rolled at 673 K. Conical cup tests were carried out at room temperature to investigate the press formability, as shown in Fig. 1. The forming speed was 60 mm/min. Microstructures of the specimens deformed to failure by conical cup tests were observed by optical microscopy.. 2555. rolled specimens processed by single roller drive rolling are shown in Fig. 3, where the RD-TD plane is observed. The rolling temperature is (a) 473 K, (b) 573 K and (c) 673 K, respectively. The grains of the rolled specimens were not elongated to the rolling direction and the grain sizes were smaller than that of the specimen prior to rolling, indicating dynamic recrystallization occurred by rolling. Microstructure of the normal rolled specimens at each rolling temperature was al-. 3. Results 3.1 Microstructure Microstructure of the specimen prior to rolling is shown in Fig. 2. The grain size was 91 µm. Microstructures of the as17 mm. 50mm. 26mm. Specimen. 20mm. Fig. 1 Schematic illustration of the conical cup test.. Fig. 2 Microstructure of the specimen prior to rolling.. Fig. 3 Microstructures of the as-rolled specimens processed by single roller drive rolling, where the RD-TD plane is observed. The rolling temperature is (a) 473 K, (b) 573 K and (c) 673 K..
(3) 2556. Y. Chino et al. Table 1 The grain size of the as-rolled specimens and the annealed specimens by single roller drive rolling and by normal rolling.. Rolling temperature (K) 473 523 573 623 673. Grain size (µm) Single roller drive rolling Normal rolling As-rolled Annealed As-rolled Annealed specimen specimen specimen specimen 5.0 6.0 7.6 10.7 17.3. 19.0. 17.8. 5.2 6.4 12.2 13.9 21.5. 17.3. 19.4. specimen and the normal rolled specimen when the rolling temperature was the same. On the other hand, the grain size was strongly affected by the rolling temperature concerning to the as-rolled specimen. The (0002) and (101̄1) pole figures of the single roller drive rolled specimen and the normal rolled specimen are shown in Fig. 5 and Fig. 6 for the specimens rolled at 673 K, respectively. The basal plane tended to be parallel to the RDTD plane for the normal rolled specimen, however, the basal plane tended to incline at about 10 deg to the RD-TD plane for the single roller drive rolled specimen. Furthermore, it is of interest to note that the intensity of (0002) texture for the single roller drive rolled specimen was weaker than that for the normal rolled specimen. On the other hand, for the (101̄1) pole figures, there was not large difference in intensity of texture between the single roller drive rolled specimen and the normal rolled specimen. These trends about texture of the rolled specimens did not change by annealing.. Fig. 4 Microstructures of the annealed specimens processed by single roller drive rolling at (a) 473 K and (b) 673 K, where the RD-TD plane is observed. The annealing is conducted at 673 K for 1.8 × 10³ s.. most the same as that of the single roller drive rolled specimens. Microstructures of the annealed specimens processed by single roller drive rolling at (a) 473 K and (b) 673 K are shown in Fig. 4, where the RD-TD plane is observed. The annealing was conducted at 673 K for 1.8 × 10³ s. Grain growth occurred by annealing for the specimen rolled at 473 K, on the other hand, little grain growth occurred for the specimen rolled at 673 K. As a result, the grain size of the annealed specimen which was rolled at 473 K was almost the same as that of annealed specimen which was rolled at 673 K. Microstructure of the annealed specimens processed by the normal rolled specimens at each rolling temperature was almost the same as that of the single roller drive rolled specimens. Thus, there was not large difference in grain growth characteristics as well as grain refinement between the single roller drive rolled specimens and the normal rolled specimens. The grain size of the as-rolled specimens and the annealed specimens processed by single roller drive rolling and normal rolling is listed in Table 1. Concerning to the as-rolled specimen and the annealed specimen, there was not large difference in grain size of the ND-RD plane and TD-ND plane as well as the RD-TD plane between the single roller drive rolled. 3.2 Tensile tests The 0.2% proof stress, ultimate tensile strength and elongation to failure by tensile tests are shown in Table 2 for the asrolled specimens processed by the single roller drive rolling and by the normal rolling and also for the annealed specimens processed by the same procedure, respectively. It should be noted that the single roller drive rolled specimens showed the lower 0.2% proof stress than the normal rolled specimens. The 0.2% proof stress decreased with rolling temperature for the as-rolled specimens. However, it hardly changed with rolling temperature for the annealed specimens. This is attributed to grain growth by annealing. The single roller drive rolled specimens showed a little lower ultimate tensile strength than the normal rolled specimens. The ultimate tensile strength hardly changed with rolling temperature for both the as-rolled specimens and the annealed specimens. There was not difference in elongation to failure between the single roller drive rolled specimens and the normal rolled specimens. The elongation was significantly increased by annealing for both the specimens. Thus, although, there was large difference in 0.2% proof stress between the single roller drive rolled specimens and the normal rolled specimens, difference in ultimate tensile strength and elongation between them was rather small or negligible. The relationship between the 0.2% proof stress for a polycrystalline metal and the grain size can be given by σ0.2 = σo + K d −1/2. (2).
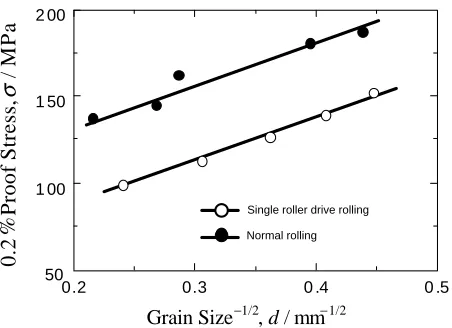
(4) Mechanical Properties and Press Formability at Room Temperature of AZ31 Mg Alloy Processed. 2557. Fig. 5 The (0002) pole figures of (a) the single roller drive rolled specimen and (b) the normal rolled specimen for the specimens rolled at 673 K.. Fig. 6 The (101̄1) pole figures of (a) the single roller drive rolled specimen and (b) the normal rolled specimen for the specimens rolled at 673 K. Table 2 The 0.2% proof stress, ultimate tensile strength and elongation to failure by tensile tests for the as-rolled specimens and the annealed specimens by single roller drive rolling and by normal rolling. Rolling temperature (K). 0.2% Proof stress (MPa) As-rolled Annealed. Tensile strength (MPa) As-rolled Annealed. Elongation (%) As-rolled Annealed. Single roller drive rolling. 473 523 573 623 673. 152 139 126 113 99. 127 98 119 120 125. 276 242 258 260 252. 240 229 225 216 245. 6 16 10 7 11. 38 22 30 28 30. Normal rolling. 473 523 573 623 673. 187 181 162 145 137. 127 131 141 123 136. 276 291 276 252 269. 240 252 250 283 243. 10 14 5 11 4. 39 26 34 34 27. where σ0.2 is the 0.2% proof stress for a polycrystalline metal σo is the stress the slip band could sustain if there were no resistance to slip across grain boundaries, K is a constant and d is the grain size. The variation in 0.2% proof stress as a function of the inverse of square root of grain size is shown in Fig. 7 for the as-rolled specimens. Inspection of Fig. 7 reveals that the difference in 0.2% proof stress between the single. roller drive rolled specimen and the normal rolled specimen is attributed to the difference in stress the slip band could sustain if there were no resistance to slip across grain boundaries. The difference in stress the slip band could sustain if there were no resistance to slip across grain boundaries is likely to be related to the difference in texture.14).
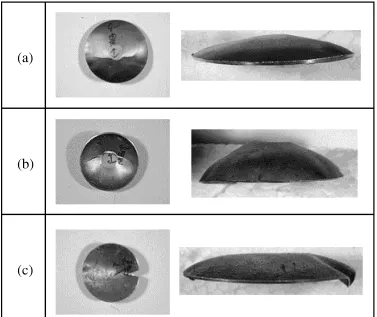
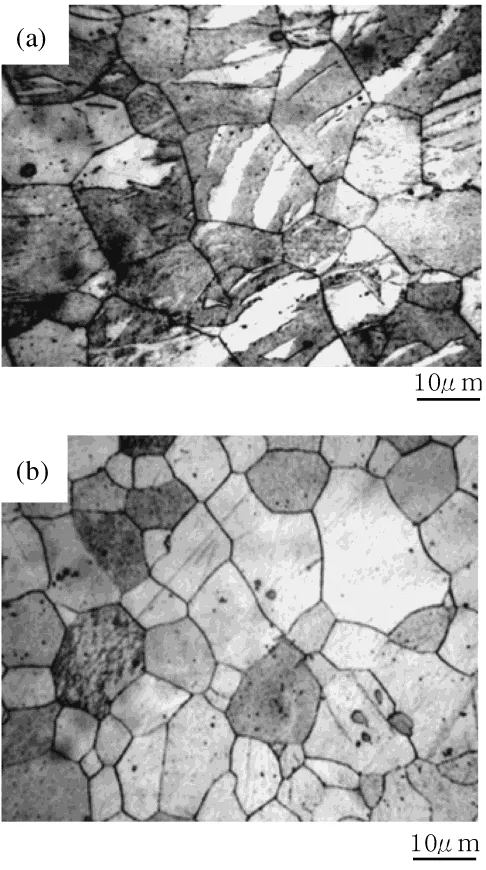
(5) Y. Chino et al.. 2 00. Table 3 The r-value for the specimens rolled at 673 K.. 1 50. Angle∗. Single roller drive rolling. Normal rolling. As-rolled. 0 deg 45 deg 90 deg. 0.56 1.57 1.13. 0.14 2.62 1.14. Annealed. 0 deg 45 deg 90 deg. 1.08 3.00 2.90. 1.30 2.50 1.05. 1 00 Single roller drive rolling Normal rolling. 0.2. Proof Stress,. / MPa. 2558. 50 0.2. 0.3. Grain Size. ∗ The. 0 .4 1/2. , d / mm. angle between the tensile direction and the rolling direction.. 0 .5 1/2. Fig. 7 The variation in 0.2% proof stress as a function of the inverse of square root of grain size for the as-rolled specimens.. 3.3 Conical cup tests Press formability at room temperature was investigated by conical cup tests on the specimens rolled at 673 K. The result is summarized in Fig. 8 for (a) the as-rolled specimen processed by single roller drive rolling, (b) the annealed specimen processed by single roller drive rolling and (c) the annealed specimen processed by normal rolling, respectively. For the single roller drive rolled specimens, sufficient forming was not attained for the as-rolled specimen, as shown in (a), but the formability was improved by annealing, as shown in (b). It should be noted that the single roller drive rolled specimen exhibited rather better formability than the normal rolled specimen as shown in (c). Thus, the conical cup tests showed that the press formability of the single roller drive rolled specimen was rather better than that of the normal rolled specimen. From the results of tensile tests, as shown in Table 2, where the angle between the tensile direction and the rolling direction was 0 deg, the difference in elongation between them was negligible. Clearly, the press formability does not correspond to the unidirectional ductility. 4. Discussion It is known that press formability is related to the strainhardening exponent (n-value) and the Lankford value (rvalue). The true stress-true strain curves of the annealed specimens processed by single roller drive rolling and by normal rolling at 673 K are shown in Fig. 9. From Fig. 9, the n-value of the single roller drive rolled specimen was almost the same as that of the normal rolled specimen. To investigate the r-value, additional tensile tests were conducted for the specimens rolled at 673 K, where the angle between the tensile direction and the rolling direction was 45 deg and 90 deg. The r-value for the specimens rolled at 673 K is listed in Table 3. It is important to investigate the anisotropy of the r-value because the anisotropy of flow characteristics leads to poor formability. The average r-value and planar anisotropy may be given by17) r̄ = (r0 + r90 + 2r45 )/4. (3). ∆r = (r0 + r90 − 2r45 )/2. (4). where r̄ is the average r-value, ∆r is the planar anisotropy, r0 is the r-value where the angle between the tensile direction and the rolling direction is 0 deg, r45 is the r-value for the angle of 45 deg and r90 is for 90 deg. The average r-value and planar anisotropy are listed in Table 4 for the specimens processed by single roller drive rolling and by normal rolling at 673 K. It should be noted that the average r-value is large and the absolute value of planar anisotropy is low for the annealed specimen processed by single roller drive rolling, compared to those for other specimens except the r-value of the as-rolled specimen processed by single roller drive rolling. Therefore, it is likely that not only the large average r-value, but also the low planar anisotropy lead to improvement of press formability for the annealed specimen processed by single roller drive rolling. The number of independent modes for the basal slip in hcp metals is 2.1) Hence, it is required to accommodate discontinuity of flow due to the lack of slip systems by twinning for a polycrystalline Mg.1, 18) Microstructures of the specimens formed by the conical cup tests are shown in Fig. 10, where (a) the annealed specimen processed by single roller drive rolling at 673 K and (b) the annealed specimen processed by normal rolling at 673 K. It is of interest to note that twins were observed in many grains for the single roller drive rolled specimen, however, no twins were observed for the normal rolled specimen. As shown in Fig. 5, single roller drive rolling served to reduce the intensity of (0002) texture, compared to normal rolling. Therefore, it is suggested that the weaker intensity of (0002) texture leads to twining as accommodation of slip deformation, resulting in the low planar anisotropy for the single roller drive rolled specimen. This points out the importance of control of texture for improvement of press formability at room temperature for Mg based materials. 5. Conclusions Mechanical properties and press formability at room temperature of AZ31 Mg alloy processed by single roller drive rolling were compared with those of the one processed by normal rolling using tensile tests and conical cup tests. The results are concluded as follows. (1) The single roller drive rolled specimen showed the weaker intensity of (0002) texture than the normal rolled specimen. On the other hand, the grain size of the single roller drive rolled specimens was almost the same as that of the normal rolled specimens..
(6) Mechanical Properties and Press Formability at Room Temperature of AZ31 Mg Alloy Processed. 2559. Fig. 8 The results of the conical cup tests for (a) the as-rolled specimen processed by single roller drive rolling at 673 K, (b) the annealed specimens processed by single roller drive rolling at 673 K and (c) the annealed specimens processed by normal rolling at 673 K. Table 4 The average r-value and planar anisotropy for the specimens processed by single roller drive rolling and by normal rolling at 673 K. Average r-value. Planer anisotropy. Single roller drive rolling. Normal rolling. Single roller drive rolling. Normal rolling. 1.2 2.5. 1.6 1.8. −0.8 −1.0. −2.0 −1.3. As-rolled Annealed. 300. St ress, MPa. Normal rolling. 200. Single roller drive rolling. 100. 0 0.0. 0.1. 0.2. 0.3. 0.4. Strain Fig. 9 The true stress-true strain curves of the annealed specimens processed by single roller drive rolling and by normal rolling at 673 K.. (2) The single roller drive rolled specimens showed the lower 0.2% proof stress than the normal rolled specimens.. This is likely to be related to the difference in intensity of texture. On the other hand, the difference in unidirectional elongation between them was negligible. (3) The conical cup tests showed that the press formability of the single roller drive rolled specimen was rather better than that of the normal rolled specimen. Clearly, the press formability did not correspond to the unidirectional ductility. (4) The average r-value was large and the planar anisotropy was low for the single roller drive rolled specimen, compared to for the normal rolled specimen. This resulted in improvement of the press formability by single roller drive rolling. (5) Twins were observed for the single roller drive rolled specimen formed by the conical cup test, however, no twins were observed for the normal rolled specimen. Therefore, it is suggested that the weaker intensity of (0002) texture leads to twining as accommodation of slip deformation, resulting in the low planar anisotropy for the single roller drive rolled specimen..
(7) 2560. Y. Chino et al.. REFERENCES 1) M. H. Yoo: Metall. Trans. A 12A (1981) 409–418. 2) S. Morozumi, M. Kikuchi and H. Yoshinaga: Trans. JIM 17 (1976) 158– 164. 3) H. Yoshinaga and R. Horiuchi: Trans. JIM 4 (1963) 1–8. 4) H. Yoshinaga and R. Horiuchi: Trans. JIM 5 (1963) 14–21. 5) R. Armstrong, I. Codd, R. M. Douthwaite and N. J. Petch: Philos. Mag. 7 (1962) 45–58. 6) M. Mabuchi and K. Higashi: Acta Mater. 44 (1996) 4611–4618. 7) J. A. Chapman and D. V. Wilson: J. Inst. Metals 91 (1962–63) 39–40. 8) K. Kubota, M. Mabuchi and K. Higashi: J. Mater. Sci. 34 (1999) 2255– 2262. 9) T. Mohri, M. Mabuchi, N. Saito and M. Nakamura: Mater. Sci. Eng. A257 (1998) 287–294. 10) T. Mohri, M. Mabuchi, M. Nakamura, T. Asahina, H. Iwasaki, T. Aizawa and K. Higashi: Mater. Sci. Eng. A290 (2000) 139–144. 11) Y. Chino, M. Mabuchi, K. Shimojima, Y. Yamada, C. E. Wen, K. Miwa, M. Nakamura, T. Asahina, K. Higashi and T. Aizawa: Mater. Trans. 42 (2001) 414–417. 12) M. Mabuchi, Y. Chino, H. Iwasaki, T. Aizawa and K. Higashi: Mater. Trans. 42 (2001) 1182–1188. 13) H. Watanabe, H. Tsutsui, T. Mukai, K. Ishikawa, Y. Okanda, M. Kohzu and K. Higashi: Mater. Trans. 42 (2001) 1200–1205. 14) D. V. Wilson and J. A. Chapman: Philos. Mag. 8 (1963) 1543–1551. 15) S. R. Agnew and M. H. Yoo: Magnesium Technology 2000, ed. by H. I. Kaplan, J. Hryn and B. Clow (The Minerals, Metals & Materials Society, Warrendale, PA, 2000) pp. 331–339. 16) T. Sakai, S. Hamada and Y. Saito: Scr. Mater. 44 (2001) 2569–2573. 17) J. Hu, K. Ikeda and T. Murakami: J. Japan Inst. METALS 60 (1996) 1130–1135. 18) F. E. Hauser, C. D. Starr, L. Tietzand and J. E. Dorn: Trans. ASM 47 (1955) 102–134.. Fig. 10 Microstructures of the specimens formed by the conical cup tests, where (a) the annealed specimen processed by single roller drive rolling at 673 K and (b) the annealed specimen processed by normal rolling at 673 K..
(8)
Figure

+3
Related documents
When the distribution of the positions of those applying mobbing behaviors according to the views of the staff is being examined, it was determined that the 57.5% of the
Teachers having command over teaching methodology differed significantly in favour of public schools’ heads in the category of strongly agree.. Giving attention to
When labour pain exceeds a woman’s expectations and coping abilities, it may be viewed negatively by both women themselves, and their care providers.. Alexandra
Figure 4: Image created using Snapgene portraying the CATS Library preparation method for compatibility with the Meyer libraries: Blue N = sample DNA/target sequence, Magenta =
This is supported by an analytical argument for the scaling of the penetration depth of newly arrived random walkers, and by numerical evidence on the Laurent coefficients
Prognostic nomogram (A) and calibration curve (B-C) of Cbl-b expression combined with histological differentiation, pN category, and serum CA19-9 levels in patients with
derivatives markets being able to satisfy private liquidity demands even in the face of possible losses on cash positions , there is little incentive for capital to flow out of cash
These sets of criteria are subject of several studies of which Geringer (1991) and Cummings & Holmberg (2012) form the foundation in this research. The categorization is based
