The urea as a product of liver detoxification of ammonium is in general an undesirable metabolite in body fluids of mammals, when its concentration
exceeds the physiological limit. Its very low levels are nevertheless also undesirable as they indicate the nitrogen matter malnutrition. The control of
Supported by the Ministry of Education, Youth and Sports of the Czech Republic (Projects Nos. MSM 2678846201 and 6007665806) and was provided in frame of research activities NRL-RM in Rapotín.
Reliability of results of milk urea analysis by various
methods using artificial milk control samples
O. Hanuš
1, P. Hering
2, J. Frelich
3, M. Jílek
4, V. Genčurová
1, R. Jedelská
11Agro Research Rapotín, s.r.o., Rapotín, Czech Republic
2Czech Moravia Breeders Corporation, Prague, Czech Republic
3Department of Special Livestock Breeding, Agricultural Faculty, University of South Bohemia
in České Budějovice, Czech Republic
4Laboratory Servise, Postřelmov, Czech Republic
ABSTRACT: The milk urea concentration (MUC) is a respected indicator of the health and nutrition status of dairy cows. It is in relation to their reproduction performance, longevity and technological milk indica-tors. The accuracy of the interpretation of results depends on their reliability, which is so important. There are a lot of principles of MUC analyses. Their results can be affected by a number of interferential factors. Many disproportions were noticed for the above-mentioned reasons in laboratory practice. That is the reason why relevant result variation sources are studied. The goal of this paper was to search the relationships between different methods of MUC determination with the use of specifically modified samples on a milk basis with the absence of dissolved components such as lactose. The results of two methods (photometric BI with diacetylmonoxime and FT-MIR (mid infrared)) were disqualified for a large shift and variance of values, unsatisfactory recovery and paralysed relation to other methods (BI r = from 0.184 to 0.213; P > 0.05). Therefore the second BI method was retained in the evaluation, and it was probably a local defect in the performance at disqualification. Nevertheless, the procedure showed poorer recovery (75.5 ± 14.3%) and necessity for methodical modifications for support of result reliability such as increase in the number of calibration points as compared to the contemporary procedure. The results of FT-MIR method were strongly systematically displaced due to lactose absence in particular (by 33.824 ± 3.794 mg/100 ml). Nevertheless, the correlations with results of other relevant methods were tight (from 0.991 to 0.999; P < 0.001). The photo-metrical method with Ehrlich’s agent (para-dimethylaminobenzaldehyde, EH) showed acceptable values of all the evaluated indicators of reliability. The specific Ureakvant method (UR; with conductivity difference measurement) showed the most proper results in combination with all the reliability indicators (recovery as much as 93.2 ± 10.2%; correlation from 0.989 to 1.0; P < 0.001; acceptable ratio of systematic and random error components). It is possible to use the tested specific standard samples for the control or calibration of all methods (BI, EH and UR) with the exception of FT-MIR.
variability in milk urea concentration (MUC) is used for a diagnosis of the energy-nitrogen metabo-lism of cows (Kirchgessner et al., 1986; Gustafsson and Palmquist, 1993; Homolka and Vencl, 1993; Baker et al., 1995; Jonker et al., 1999; Hojman et al., 2004; Jílek et al., 2006; Strusiňska et al., 2006; Zhai et al., 2006). Both the high and the low levels of MUC may thus exert a negative effect on the health of dairy cows, their reproduction performance and longevity (Butler et al., 1996; Říha and Hanuš, 1999; Kubešová et al., 2005). Simultaneously, the high levels of MUC can also act by the deterioration of milk quality (Hanuš et al., 1993a,b). Recently, the genetical effects were also described. Miglior et al. (2006) established breeding values for urea nitrogen content in milk. They found relatively high coefficients of heritability h2 = 0.38 for the 2nd and 0.41 for the 3rd lactation. Surprisingly the geneti-cal correlations between lactations were also high (r = from 0.74 to 0.87 between the 1st and 3rd and between the 2nd and 3rd lactation). This might in-dicate a substantial genetical effect on differences in the ability of cows to utilize nitrogen from feed. For this reason the control of MUC is used in agri-cultural and nutrition laboratories in milk record-ing of dairy cows (individual milk samples) and in quality control of delivered raw milk (bulk milk samples). The results and their interpretation thus serve in consulting the nutrition of dairy cows and in prevention of their metabolism failure.
In spite of the above-mentioned facts, from me-thodical aspects there exists a number of analytical problems, when no reference method has been de-clared in a standard way yet (Lefier, 1999; Broutin, 2000, 2006a,b) while many different analytical prin-ciples are used (Lefier, 1999; Hanuš et al., 1997, 2001; Peterson et al., 2004; Broutin, 2000, 2006a,b) which under certain circumstances can be a source of significantly different results for many reasons. It is the reliability of the results that determines the relevant interpretation and practical application in the nutrition and health status control of dairy cows. For this reason this problem was a repeated target of some authors (Carlsson and Bergström, 1994; Hanuš et al., 1995; Herre, 1998; Klopčič et al., 1999; Peterson et al., 2004; Hering et al., 2007). Also in the Czech Republic it happened during the process of the merging of milk laboratories (2004 to 2006) that many bad interpretations occurred due to the cross application of many methods without a substantial accent on the unification and support of reliability of results by a consistent netting of
relevant laboratories in the proficiency testing of analytical capability. The principles and advantag-es of netted laboratory proficiency tadvantag-esting (Leray, 1993; Wood et al., 1998; Hanuš et al., 1999, 2000) as well as evaluation of its results were discussed in many papers.
As mentioned above, the measurement of MUC as a physiology-health indicator can be done by several methods. FT-MIR technology is viewed as hopeful (Broutin 2006b; Roos et al., 2006) for the health state monitoring of milked ruminant females and for the coordination of prevention of their pro-duction and repropro-duction disorders linked with false nutrition and other bad technologies regard-ing their high milk yield. In spite of this, for milk urea determination direct methods are preferred, especially the specific ones (ureolytical and dif-ferential ones; Lefier, 1999; Broutin, 2000, 2006b), for example AFNOR (France), Eurochem (Italy) or Chemspec (Bentley Instruments, USA). Such is also the opinion of IDF in terms of the running selection of an official reference method (Lefier, 1999), where the specificity is the basic prerequi-site. Here it is necessary to proceed by the differ-ence methods, it means to compare the feedback of the reaction before and after ureolysis or dur-ing ureolysis and obtained parameters (mostly the difference) to calibrate according to known MUC. The most common difference measurements are provided photometrically (AFNOR, Chemspec), by the pH determination (Eurochem) or conducto-metrically (Ureakvant, Czech Republic). Still many other methods of MUC determination (specific or nonspecific ones) on the basis of different princi-ples were described and evaluated (Rajamäki and Rauramaa, 1984; Oltner et al., 1985; Hanuš et al., 1997, 2001; Herre, 1998; Klopčič et al., 1999). A spe-cial problem is the preparation of milk urea stand-ards for adequate calibration of different methods. This has been submitted to experiments and me-thodical examination, including the mutual result relationships of the methods, which are interpreted as potentially reference and other direct or indirect ones (for example filter MIR technology), frame-workly in the following fields:
– the preparation of calibration standards for dif-ferent methods of MUC determination, poten-tially for urea determination in other body fluids (Wolfschoon-Pombo et al., 1981; Oltner et al., 1985; Hanuš et al., 1995, 1997);
potentially biosensors for the analysis of urea concentration in different biological materials, especially in milk (Guilbault and Montalvo, 1970; Sundaram, 1979; Thavarungkul et al., 1991; San-subrino and Mascini, 1994; Koncki et al., 1995; Ciana and Caputo, 1996; Sheppard et al., 1996); – the validation of the relationships of recently
developed principles and methods of MUC de-termination or urea dede-termination in blood to the current methods or to potentially reference ones, mostly specific ureolytical ones (Broutin, 2000);
– a notice of problems of recovery and reliability of urea determination under the conditions of mid filter transmission infrared technology (MIR) in comparison with validated methods, where the determination coefficient of accuracy was about 50% (Here, 1998).
The aim of this study was to evaluate the rela-tionships between the currently used principles of methods of MUC determination in the Czech
Republic, especially of new modern methods (meas-urement in the main area of infrared spectrum with use of Fourier transformations, FT-MIR; Lefier et al., 1996), on artificially constructed control sam-ples on the milk basis and to deduce the relevant methodical recommendations for enhancement of reliability and improvement of practical interpreta-tion of produced analytical results due to obtained theoretical relationships.
MATERIAL AND METHODS
Analytical methods
More detailed characteristic descriptions of the used methods can be found in previous papers (Hanuš et al., 1995, 1997, 2001; Klopčič et al., 1999; Hering et al., 2007). Here only a brief summary is given: – the specific method Ureakvant (UR) is based
[image:3.595.63.534.428.690.2]on difference measurements of a change in the
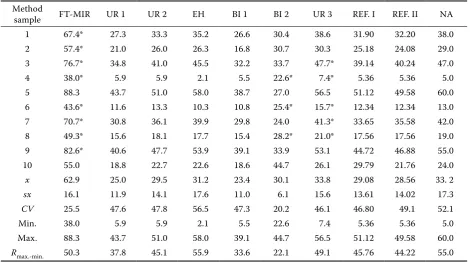
Table 1. The results of analyses of urea concentration (mg/100 ml) in modified control samples by various methods and their reference values after the tests of outliers in two evaluations (I and II), total (before) and after the exclu-sion of FT-MIR and BI-2 methods
Method
sample FT-MIR UR 1 UR 2 EH BI 1 BI 2 UR 3 REF. I REF. II NA 1 67.4* 27.3 33.3 35.2 26.6 30.4 38.6 31.90 32.20 38.0 2 57.4* 21.0 26.0 26.3 16.8 30.7 30.3 25.18 24.08 29.0 3 76.7* 34.8 41.0 45.5 32.2 33.7 47.7* 39.14 40.24 47.0 4 38.0* 5.9 5.9 2.1 5.5 22.6* 7.4* 5.36 5.36 5.0 5 88.3 43.7 51.0 58.0 38.7 27.0 56.5 51.12 49.58 60.0 6 43.6* 11.6 13.3 10.3 10.8 25.4* 15.7* 12.34 12.34 13.0 7 70.7* 30.8 36.1 39.9 29.8 24.0 41.3* 33.65 35.58 42.0 8 49.3* 15.6 18.1 17.7 15.4 28.2* 21.0* 17.56 17.56 19.0 9 82.6* 40.6 47.7 53.9 39.1 33.9 53.1 44.72 46.88 55.0 10 55.0 18.8 22.7 22.6 18.6 44.7 26.1 29.79 21.76 24.0 x 62.9 25.0 29.5 31.2 23.4 30.1 33.8 29.08 28.56 33. 2 sx 16.1 11.9 14.1 17.6 11.0 6.1 15.6 13.61 14.02 17.3 CV 25.5 47.6 47.8 56.5 47.3 20.2 46.1 46.80 49.1 52.1 Min. 38.0 5.9 5.9 2.1 5.5 22.6 7.4 5.36 5.36 5.0 Max. 88.3 43.7 51.0 58.0 39.1 44.7 56.5 51.12 49.58 60.0
Rmax.-min. 50.3 37.8 45.1 55.9 33.6 22.1 49.1 45.76 44.22 55.0
electrical conductivity during the ureolytical hy-drolysis of urea by urease and it was calibrated on a five-point scale of milk urea standards; – the photometrical method BioLaTest (BI) is based
on a change in colour by means of the reaction of diacetylmonoxime measured at 525 nm (Spekol 11, Carl Zeiss, Jena, Germany) and it was cali-brated on one standard water sample;
– the photometrical method with Ehrlich’s solution (EH) is based on a change in colour by means of the reaction of paradimethylaminobenzaldehyde measured at 420 nm (Spekol 11) and it was cali-brated on the five-degree scale of standard water samples;
– the spectrophotometric method in the infrared area of spectrum (FT-MIR) on a Foss 6000 instru-ment (Foss Electric, Denmark) was calibrated on the ten-point scale of samples of native milk with different MUC according to the results of specific reference method (UR).
Design of experiment
The control samples (reference standards) were created on the basis of milk matrix with nearly zero urea concentration. The samples of native UHT milk were precipitated by acidification to pH 4.5 by hydrochloric acid and centrifuged. The supernatant with lactose, native urea and other soluble compounds was removed. Precipitated fat and protein fraction (especially casein) were mixed with pure water and repeatedly centrifuged. This process was repeated three times with the ratio of coagulation and washing water volumes 1:5. Coagulation was subsequently reconstituted in citrate phosphate buffer by pH 7.0. The obtained samples thus contained basic compounds of fat and protein milk phase by the absence of lactose
and other components of the soluble phase includ-ing urea. Known artificial weight additions were added into these modified samples to assess the recovery ability of examined analytical methods. In the experiment the series of 10 samples of modi-fied milk was used (Table 1). The samples were immediately transported to selected laboratories under cold regime conditions. The MUC analyses of the samples (7 participants) were carried out in 6 laboratories (nearly all of them with accredita-tion certificate and two of them with the status of National Reference Laboratory for raw milk) in the Czech Republic using 4 analytical methods. The total recovery (yield) was then determined as a difference of the value measured after the addition from value 0 and 100% was formed by the value of the addition.
Evaluation of results
The results (Table 1) were evaluated by means of the calculation of recovery and of the determina-tion of Euclidian distance for the reliability of labo-ratory results. The principles of these procedures are described in more details in previous papers of Leray (1993) and Hanuš et al. (2006). The mean deviations and variabilities of individual values of these deviations of the participants (laboratories, methods) from reference values and Euclidian dis-tance (RE) of the laboratories from the origin (cen-tre) were calculated. The correlation coefficients between combinations of participants were also calculated. In tables and figures it is possible to find positions of laboratories or methods in terms of the measure of measured result reliability. The discrimination limits of participation success in the proficiency testing in the tables and figures were derived in the following way:
2 4 6 8 10 12 14 16
–20 –10 0 10 20 30 40
d sd
FT-MIR UR-1 UR-2 EH BI-1 BI-2 UR-3
[image:4.595.64.378.609.753.2]FT-MIR UR-1 UR-2 EH BI-1 BI-2 UR-3
– semicircle:
(1) for the average difference (d) as 1.96-times multiplied of standard deviation value d of the set, it means at the conventional level 95% of confidence interval;
(2) for standard deviation of the average differ-ence (SD) by the method of robust estimate as the sum of sd medians of the set and 1.65-times multiplied of standardized quartile es-timate of standard deviation, it means at the conventional level 95%;
(3) by the combination of both the previous (d and SD) limits on the basis of the mean the limit was created (semicircle in the graph) with discrimination ca 10%;
– tetragon:
(4) for d as the value of one standard deviation in d set;
(5) for SD as the sum of the means of the sd set and its standard deviation.
RESULTS AND DISCUSSION
[image:5.595.70.532.113.232.2]Naturally, there also exist other ways of the prepa-ration of standard samples than water solutions of urea with known additions, and thus concentra-tions (for recovery) or samples of native milk with determined MUC by another reference method. In native milk the MUC was depressed to 0 by addition of urease. The urease was consequently inactivated by the higher temperature. The artifi-cial MUC were added into milk prepared in such a way (Hanuš et al., 1995). Nevertheless, such a procedure can be encumbered with possible re-sidual activity of urease and the samples may not be stable under all circumstances. It is difficult to control of course. On the other hand, the advantage is the complete milk matrix, which decreases the risk of possible undesirable interferential effects on the reliability of the results in the calibrated methods (FT-MIR). However, for research in this
Table 2. General array of participants (I; n = 7) in the milk urea concentration (MUC) determination according to the Euclidian distance from origin (RE)
LAB. d SD RE t v
UR-2 0.434 2.662 2.6971 0.52 NS
UR-1 –4.066 3.127 5.1294 4.11 **
EH 2.074 4.967 5.3826 1.32 NS
UR-3 4.694 3.502 5.8564 4.24 **
BI-1 –5.726 3.893 6.9241 4.65 **
BI-2 0.979 12.839 12.8763 0.24 NS
FT-MIR 33.824 3.794 34.0361 28.19 ***
LAB. = laboratory (method, participant); d = mean deviation (difference, mg/100 ml); SD = variability of mean differen- ce; RE = Euclidian distance; t = value t of the testing parameter of paired test; v = statistical significance (NS = P > 0.05;
* = P ≤ 0.05; ** = P ≤ 0.01; *** = P ≤ 0.001)
1 2 3 4 5 6 7
–8 –
66 –4 –2 d0 2 4 6 8
sd
UR- 1 UR- 2 EH BI -1 UR- 3
UR-1 UR-2 EH BI-1 UR-3
[image:5.595.67.373.607.752.2]work quite a different procedure was applied in the preparation of standard samples on the basis of milk matrix with the absence of soluble compo-nents. The mentioned results are related to this way of preparation. Regarding the various interferential effects Carlsson and Bergström (1994) did not find any effects on the MUC in individual udder quar-ters or any differences between the beginning and the end of milking (different fat contents), when the MUC was calculated in relation to the water phase of milk.
The basic evaluation (Table 1) by the RE method was carried out twice: once in the complete ar-rangement of the results (I) (Figure 1; Table 2) and then with just five participants (II; Figure 2; Table 3), when two of them were excluded. The exclusion was done on the basis of the significant positive difference of the results (d, systematic er-ror) of FT-MIR method (33.824 ± 3.794 mg/100 ml; Table 2; Figure 1). Further due to the unsatisfac-tory correlation of the measured values in one of the methods BI-2 (from 0.184 to 0.213; P > 0.05; Table 4; Figure 3) in comparison with the values of the other methods, when the correlations between these methods were very tight (from 0.989 to 1.0; Table 4; P < 0.001) with the exception of the ex-cluded method. Also the value of random error (SD;
Table 2; Figure 1) was the highest (±12.839 mg per 100 ml). Moreover, the value of total recovery in this participant (140.3 ± 122.1%) was unsatisfactory due to the false application of the method. It means both the average one and especially its variability (CV = 87.0%; Table 5). It is probably the same lo-cal discrepancy in the methodilo-cal procedure or its qualitative assurance as in the previous paper of ours (Hering et al., 2007), because the second BI-1 method was not excluded from the set (II) in this case (Table 3; Figure 2).
[image:6.595.64.531.113.202.2]Due to the exclusion of the mentioned substantial-ly significant interferential effects (Figure 2; Table 3) the second evaluation (II) is thus espressivo more effective than the first one regarding the fact how to evaluate the reliability of the results of the analytical methods by the given RE procedure. It is logically possible to observe lower discrimination limits and higher level of evaluation in demands on analytical procedures. Owing to the fact that the second meth-od BI-1 had gometh-od correlations (from 0.989 to 0.996; P < 0.001; Table 4), although with relatively higher negative d (systematic error; –5.208 mg/100 ml; Table 3), it is possible to state that the method itself is applicable by the adequate calibration. Also the total recovery value of this method (75.5 ± 14.3%; CV = 18.9%) was lower due to the probable negative
Table 3. The array of participants (II) in MUC determination after the exclusion of remote participants (n = 5) according to the Euclidian distance from origin (RE)
LAB. d SD RE t v
UR-2 0.952 0.419 1.0401 7.18 ***
UR-1 –3.548 2.180 4.1642 5.15 ***
EH 2.592 3.588 4.4263 2.28 *
UR-3 5.212 1.705 5.4838 9.67 ***
BI-1 –5.208 3.273 6.1511 5.03 ***
y = 0.0938x + 27.709
R2= 0.0337
n = 10
0 10 20 30 40 50
0 10 20 30 40 50
UR-1
B
I-2
y = 0.0938x + 27.709 R2 = 0.0337
n = 10
0 10 20 30 40 50
UR-1 50
40 30 20 10 0
BI-2
Figure 3. The most suited linear regression relationship (r = 0.184;
[image:6.595.64.346.598.755.2]calibration shift (Table 5). The second case of BI-1 method suggests that the method can work correctly. The improvement can be achieved by using a higher number of calibration samples instead of just one. Probably it would eliminate the marked random ef-fect when the potential error of one standard be-comes the systematic error of linked analyses and its higher probability of occurrence the source of the random error of the method.
The modern FT-MIR method which is the most important subject of the experimental comparison revealed strongly displaced results. It means the large systematic error (d) in the first evaluation. This difference however expressed a very con-stant character, when the coefficient of variation was ±11.2%. It was probably a consequence of the absence of soluble milk components, especially of lactose, and also dissolved minerals and citrates, which originated due to manipulation with samples during the preparation of artificial milk standards. Consequently the total method recovery increased disproportionally including its variability 258.8 ± 185.5% (Table 5; CV = 71.7%) while the correlations with the results of other relevant methods were tight (Table 4; from 0.991 to 0.999; P < 0.001). For
[image:7.595.63.535.116.219.2]this reason and simultaneously in spite of these results this method was excluded from the second evaluation (Figure 2 and Table 3). If the otherwise relatively constant factor (29.7 ± 1.6 mg/100 m, dif-ferences between weights and measurement results, n = 10, CV = 5.4%) was subtracted from measure-ment results, also the total recovery would be sat-isfactory although its variability would be slightly higher (106.6 ± 21.2% and CV = 19.9%) and also the reliability of the MUC results would be better (in expression of d in Figure 2; 4.64 ± 2.32 mg/100 ml as expressed to the reference values II, Table 1). Such complicated treatment of the results is never-theless probably behind the limits of being analyti-cally admissible. Peterson et al. (2004) determined the recovery for Foss 6000 system (FT-MIR) 95.4 ± 10.1%, for Bentley 92.1 ± 2.8%. For this reason the mentioned recovery could not be confirmed in this paper. Peterson et al. (2004) also confronted some of the applied methods for determination of milk urea nitrogen concentration (MUN): when the ini-tial concentration of urea nitrogen increased, the recovery decreased using the Bentley system and CL-10 system. Increased milk fat resulted in the recovery depression using the Foss 6000 system. In
Table 4. Correlation coefficients of linear regression of the relationships between the methods of MUC determi-nation
FT-MIR UR-1 UR-2 EH BI-1 BI-2
UR-1 0.999
UR-2 0.998 0.999
EH 0.998 0.999 1.000
BI-1 0.991 0.993 0.991 0.992
BI-2 0.188 0.184 0.207 0.202 0.209
UR-3 0.997 0.997 0.999 0.999 0.989 0.213
P ≤ 0.001 except BI-2 to the others, P > 0.05
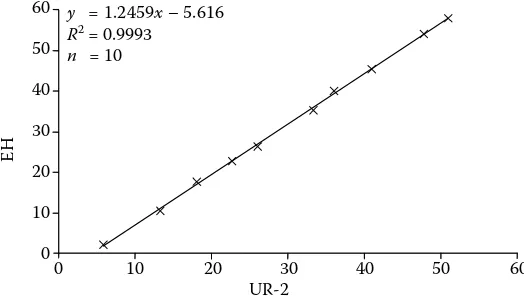
y = 1.2459x-5.616
R2 = 0.9993
n = 10
0 10 20 30 40 50 60
0 10 20 30 40 50 60
EH
UR-2 y = 1.2459x – 5.616 R2 = 0.9993
n = 10
0 10 20 30 40 50 60 UR-2
60 50 40 30 20 10 0
EH
[image:7.595.63.325.607.760.2]4 out of 5 methods the MUN recovery was not con-nected with specific milk components. The MUN recovery was not consistent for laboratories using the methods Foss 4000 and 6000 and the applica-tion of these systems can result in MUN overesti-mation or underestioveresti-mation.
The EH method showed out relatively very hopeful values of total recovery (87.8 ± 17.0%, CV = 19.4%; Table 5) although it had a slightly higher positive systematic error in both evaluations 2.074 and 2.592 mg/100 ml also with the higher value of random error SD (Figures 1 and 2; Tables 2 and 3). However, the correlations of the results with the results of other relevant methods were tight (from 0.992 to 1.0; P < 0.001; Table 4).
None of the tested methods reached positive parameters of the specific UR method, which in two out of three cases (one worse result was prob-ably a local case) showed in fact the best combina-tions of the results in the total recovery (Table 5; UR-1 80.6 ± 14.3%, CV = 17.7; UR-2 93.2 ± 10.2%, CV = 10.9%; UR-3 108.5 ± 15.9%, CV = 14.7%), cor-relations (Table 4; from 0.989 to 1.0; P < 0.001; Figure 4), systematic and random error (Figures 1 and 2; Tables 2 and 3) and this to artificial additions, to one another and also to other relevant methods. Some variability of total recovery is probably a con-sequence of current calibrations of the instruments and of functional states of individual reactors of particular equipments. Generally, advantageous results of the UR method are in fact in accordance with former positive findings (Klopčič et al., 1999; Hanuš et al., 2001; Hering et al., 2007). Comparable positive results of the result reliability of MUC analyses were also described by Broutin (2000,
2006a,b) for the automatic specific (application of urease) method Chemspec (Bentley Instruments, USA) with photometrical output of measurements of the colour intensity in modified Berthelot’s reac-tion (Patton and Crouch, 1977), which is propor-tional to the ammonium concentration.
In the case of specific control samples the pre-sented results suggest simultaneously good effectiv-ity in terms of the result reliabileffectiv-ity of the methods UR, EH and FT-MIR. This means also a good state regarding the possibility of providing information for correct practical interpretations in the field of nutrition and health state control of dairy cows. On the basis of results of this paper and the previous one (Hering et al., 2007) it is possible to state that the BI method requires higher methodical support of result reliability assurance than it has been until now. The results suggest also that the carrying out of such step is not excluded.
CONCLUSION
[image:8.595.64.292.114.248.2]In this paper the method FT-MIR for MUC deter-mination showed relatively paralysed effectivity in terms of result reliability (also by relevant calibra-tion) under the circumstances of work with artifi-cially modified control samples on the milk basis. Such a level of unreliability was nevertheless deter-mined just by the relatively constant systematic shift of MUC values (enhancement), which was the result of the absence of some soluble milk components, es-pecially lactose. But such samples cannot be used for the control of this method in comparison with the other methods. In the IDF evaluation (International Dairy Federation) Lefier (1999) suggested to use a specific enzymatic method especially for the calibra-tion of the indirect instrumental equipment. These results confirm this suggestion, but they further show that it is more important for the prevention of result discrepancies to use a method with locally as-sured recovery (addition or total) than a strict choice of the method principle. In the case of good recov-ery obtained also by a less specific method (without urease) this can offer relevant reference values for the calibration of indirect technique. If modified standard samples on the milk basis are used, it is not commonly possible to use them as control or calibration ones for FT-MIR method. For such a pos-sibility it would be needed to estimate very precisely the eventual interferential effect of modification on MUC determined by the FT-MIR and its variability
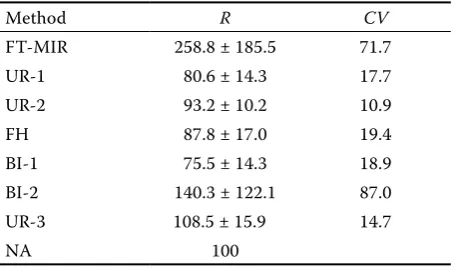
Table 5. Average values of total recovery (%) and their variability for MUC by ten modified samples of milk
Method R CV
FT-MIR 258.8 ± 185.5 71.7 UR-1 80.6 ± 14.3 17.7 UR-2 93.2 ± 10.2 10.9
FH 87.8 ± 17.0 19.4
BI-1 75.5 ± 14.3 18.9 BI-2 140.3 ± 122.1 87.0 UR-3 108.5 ± 15.9 14.7
NA 100
and to accept these values for appropriate control or calibration calculations. Quality managers in ac-credited milk laboratories should pay an appropriate attention to the theoretical and technical perform-ance of methods for MUC determination and their validations minimally in intentions of the results and recommended procedures found here and in a previ-ous paper (Hering et al., 2007). It is necessary to do it in this way in order to reach a necessary positive impact on field interpretations of reliable results in dairy advisory service.
REfERENCES
Baker L.D., Fergusson J.D., Chalupa W. (1995): Respon-se in urea and true protein of milk to different pro- tein feeding schemes for dairy cows. J. Dairy Sci., 78, 2424–2434.
Broutin P.J. (2000): Evaluation of an enzymatic method for the rapid and specific determination of urea in raw milk. 32nd ICAR Session, Bled, Slovenia.
Broutin P.J. (2006a): New applications of mid-infra-red spectrometry for the analysis of milk and milk prod-ucts. 1 Casein. IDF Bull., 406, 2–21.
Broutin P.J. (2006b): Use of highly accurate enzymatic method to evaluate the relationship between milk urea nitrogen and milk composition and yield on bulk and individual milk samples. 35th ICAR Session, Kuopio,
Finland.
Butler W.R., Calaman J.J., Beam S.W. (1996): Plasma and milk urea nitrogen in relation to pregnancy rate in lac-tating dairy cattle. J. Anim. Sci., 74, 858–865.
Carlsson J., Bergström J. (1994): The diurnal variation of urea in cow’s milk and how milk fat content, storage and preservation affects analysis by a flow injection technique. Acta Vet. Scand., 35, 67–77.
Ciana L.D., Caputo G. (1996): Robust, reliable biosensor for continuous monitoring of urea during dialysis. Clin. Chem.,47, 1079–1085.
Guilbault G.G., Montalvo J.G. (1970): An enzyme elec-trode for the substrate urea. J. Am. Chem. Soc., 92, 2533–2538.
Gustafsson A.H., Palmquist D.L. (1993): Diurnal varia-tion of rumen ammonia, serum urea, and milk urea in dairy cows at high and low recovery. J. Dairy Sci., 76, 475–484.
Hanuš O., Genčurová V., Ponížil A., Hlásný K., Gabriel B., Míčová Z. (1993a): The effects of year season, urea, acetone and nitrate additions and native content of microelements on cow’s milk fermentation. Živoč. Výr., 38, 753–762. (in Czech)
Hanuš O., Beber K., Ficnar J., Genčurová V., Gabriel B., Beranová A. (1993b): Relationship between the fermen-tation of bulk milk sample, its composition and con-tents of some metabolites. Živoč. Výr., 38, 635–644. (in Czech)
Hanuš O., Jílek M., Ficnar J., Beranová A., Jedelská R., Havlíčková K., Míčová Z. (1995): Ways of preparing standards for calibration of indirect methods of deter-mination of urea concentration in milk. Živoč. Výr., 40, 441–451. (in Czech)
Hanuš O., Ficnar J., Kopecký J., Jedelská R., Beranová A., Havlíčková K. (1997): A retrospective study of results and evolution of methodical design for preparation of urea milk calibration standard sets. Výzkum v chovu skotu, 2, 7–21. (in Czech)
Hanuš O., Pytloun J., Matouš E., Ficnar J., Genčurová V. (1999): The process of international integration in the framework of commercial importance of analytical work quality control in in dairying – ICAR reference laboratory network. Výzkum v chovu skotu, 4, 35–46. (in Czech)
Hanuš O., Leray O., Pytloun J., Menegain E., Trossat P., Genčurová V., Matouš E., Kopecký J., Jedelská R., Dolínková A. (2000): A retrospective of the interna-tional laboratory integration impact on reliability of milk analysis data. Acta Univ. Agric. Silvic. Mendel. Brun., 4, 121–131. (in Czech)
Hanuš O., Skyva J., Hofbauer J., Klopčič M., Genčurová V., Jedelská R. (2001): Reliability of analytical methods applicable at milk urea determination. Acta Univ. Ag-ric. Silvic. Mendel. Brun., 3, 143–154. (in Czech) Hanuš O., Genčurová V., Janů L., Macek A., Hering P.,
Klimeš M., Zajíčková I. (2006): The analytical result quality assurance at milk composition determination by modifications of laboratory proficiency tests. Výz-kum v chovu skotu, 173, 1–19. (in Czech)
Hanuš O., Hering P., Frelich J., , Jílek M., Genčurová V., Jedelská K. (2008): Reliability of result of milk urea analysis by various methods using artificial milk control samples. Czech J. Anim. Sci., 53, 151–160.
Herre A. (1998): Den Harnstoff-Werten nicht blind ver-trauen! Top Agrar., 2, R10.
Hojman D., Kroll O., Adin G., Gips M., Hanochi B., Ezra E. (2004): Relationships between milk urea and produc-tion, nutrition and fertility traits in Israeli dairy herds. J. Dairy Sci., 87, 1001–1011.
Homolka P., Vencl B. (1993): Urea concentrations in milk and their relationship to the crude protein and ener- gy ratio in feed rations. Živoč. Výr., 38, 529–535. (in Czech)
parity, stage of lactation and milk yield on urea concentra-tion in milk. Czech J. Anim. Sci., 51, 510–517.
Jonker J.S., Kohn R.A., Erdman R.A. (1999): Milk urea nitrogen target concentrations for lactating dairy cows fed according to national research council recommen-dations. J. Dairy Sci., 82, 1261–1273.
Kirchgessner M., Kreuzer M., Roth Maier, Dora A. (1986): Milk urea and protein content to diagnose energy and protein malnutrition of dairy cows. Arch. Anim. Nutr., 36, 192–197.
Klopčič M., Pogačar J., Hanuš O. (1999): Comparison of urea content in milk, measured in different laborato-ries. Acta Agr. Kapos., 3, 71–77.
Koncki R., Mohr G.J., Wolfbeis O.S. (1995): Enzyme bio-sensor for urea based on a novel pH bulk optode mem-brane. Biosens. Bioelectron., 10, 653–659.
Kubešová M. Frelich J. Maršálek M. (2005): Relation of milk components content and reproduction indexes in dairy cows. Collection of Scientific Papers Faculty of Agriculture in České Budějovice Series for Animal Sci-ences, 2, 129–238. (in Czech)
Lefier D. (1999): Comparison of the analytical character-istics of the enzymatic methods for urea determination in milk. 1998. IDF Questionnaire-Report. Urea deter-mination – selection of a reference method for the determination of the urea content of milk. 2099/E. Lefier D., Grappin R., Pochet S. (1996): Determination of
fat, protein and lactose in raw milk by Fourier transform infrared spectroscopy and by analysis with a conventional filter-based milk analyzer. J. AOAC Int., 79, 711–717. Leray O. (1993): CECALAIT: an organization to support
analytical quality assurance in dairy laboratories. In: Proc. International Analytical Quality Assurance and Good Laboratory Practice in Dairy Laboratories. Sonthofen/Germany, Brussels. 349–360.
Miglior F., Sewalem A., Jamrozik J., Kistemaker G., Lefe-bvre G.M., Moore R.K. (2006): Genetic anlysis of MUN and lactose and their relationships with economically important traits in Canadian Holstein cattle. In: 35th
ICAR and Interbull Meeting, Kuopio, Finland. Oltner R., Bengtsson S., Larson K. (1985): Flow injection
analysis for the determination of urea in cows milk. Acta Vet. Scand., 26, 396–404.
Patton C.J., Crouch S.R. (1977): Spectrophotometric and kinetics investigation of the Berthelot reaction for the determination of ammonia. Anal. Chem., 49, 464–466.
Peterson A.B., French K.R., Russek-Cohen E., Kohn R.A. (2004): Comparison of analytical methods and the in-fluence of milk components on milk urea nitrogen recovery. J. Dairy Sci., 87, 1747–1750.
Rajamäki S., Rauramaa A. (1984): The automated deter-mination of urea in milk. Finn. Chem. Lett., 47–48. Roos de A.P.W., Bijgaart van den H.J.C.M., Horlyk J., Jong
de G. (2006): Screening for subclinical ketosis in dairy cattle by Fourier transform infrared spectrometry. In: Technical Prasentations, 35th ICAR Session, 10th June
2006, Kuopio, Finland, 53–59.
Říha J., Hanuš O. (1999): The relationships between re-production indicators of dairy cow herds and meta-bolical and compositional indicators in bulk milk samples. Výzkum v chovu skotu, 2, 1–6. (in Czech) Sansubrino A., Mascini M. (1994): Development of an
optical fibre sensor of ammonia, urea, urease and IgG. Biosens. Bioelectron., 9, 207–216.
Sheppard N.F., Mears D.J., Guiseppi-Elie A. (1996): Model of an immobilized enzyme conductimetric urea biosen-sor. Biosens. Bioelectron., 11, 967–979.
Strusiňska D., Minakowski D., Pysera B., Kaliniewicz J. (2006): Effects of fat-protein supplementation of diets for cows in early lactation on milk yield and composi-tion. Czech J. Anim. Sci., 51, 196–204.
Sundaram P.V. (1979): Immobilized – Enzyme Pipette. Biochem. J., 179, 445–447.
Thavarungkul P., Häkanson H., Holst O., Matiasson B. (1991): Continuous monitoring of urea in blood during dialysis. Biosens. Bioelectron., 101–107.
Wolfschoon-Pombo A., Klostermeyer H., Buchberger J., Graml R. (1981): Harnstoff in der NPN-Fraktion der Kuhmilch – Bestimmung, Vorkommen und Beeinflus-sung. Milchwissenschaft, 36, 426–466.
Wood R., Nilsson A., Wallin H. (1998): Role of proficiency testing in the assessment of laboratory quality. In: Quality in the Food Analysis Laboratory. The Royal Society of Chemistry, Cambridge, UK, 172–202. Zhai S.W., Liu J.X., Wu Y.M., Ye J.A., Xu Y.N. (2006):
Responses of milk urea nitrogen content to dietary crude protein level and degradability in lactating Hol-stein dairy cows. Czech J. Anim. Sci., 51, 518–522.
Received: 2007–08–16 Accepted after corrections: 2007–10–08
Corresponding Author