
ISSN Online: 2164-5752 ISSN Print: 2164-5736
DOI: 10.4236/ojopm.2019.91001 Jan. 31, 2019 1 Open Journal of Organic Polymer Materials
The Effects of Build Parameters and Strain Rate
on the Mechanical Properties of FDM
3D-Printed Acrylonitrile Butadiene Styrene
Kemar Hibbert
1, Grant Warner
1, Celeste Brown
1, Olusegun Ajide
1,2, Gbadebo Owolabi
1,
Amin Azimi
1*1Department of Mechanical Engineering, Howard University, Washington DC, USA 2Department of Mechanical Engineering, University of Ibadan, Ibadan, Nigeria
Abstract
In this paper, the effects of build parameters on the mechanical properties of 3D-printed acrylonitrile butadiene styrene (ABS) produced using fused depo-sition modeling (FDM) are investigated. Full factorial experimental design incorporating a 2-level, 3-factor design with raster angle, layer thickness and interior fill style was carried out. Tensile tests were performed at four differ-ent strain rates to determine how the build parameters influence the mechan-ical properties of the 3-D printed ABS and to assess its strain rate sensitivity under quasi-static loading. It was found that the modulus of toughness of ABS material is most influenced by raster angle, while the interior fill style is the most dominant build parameter that dictates the specimen’s modulus of resilience, yield strength and ultimate tensile strength. At all strain rates, it is further revealed that higher mean values of yield strength, ultimate tensile strength and modulus of resilience were obtained when the interior fill style is solid as opposed to high density. This can be attributed to the denser struc-ture and higher effective cross-sectional area in solid interior fill style in comparison with high density interior fill style. However, the influence of the layer thickness on the investigated mechanical properties was found to be in-consistent. It was noted that specimens built with both 0.254 mm layer thick-ness and the cross [0˚/90˚] raster angle had superior mechanical properties when compared to those built with the 0.3302 mm layer thickness and cross [0˚/90˚] raster angle. This suggests that there is a key interaction between the layer thickness and the raster angle. At any FDM build parameter, it was found that all the mechanical properties investigated in this work exhibited modest sensitivity to strain rates. This study has provided a platform for an appropriate selection of build parameters combinations and strain rates for
How to cite this paper: Hibbert, K., Warner, G., Brown, C., Ajide, O., Owolabi, G. and Azimi, A. (2019) The Effects of Build Parameters and Strain Rate on the Mechanical Properties of FDM 3D-Printed Acrylonitrile Butadiene Styrene. Open Jour-nal of Organic Polymer Materials, 9, 1-27.
https://doi.org/10.4236/ojopm.2019.91001
Received: December 17, 2018 Accepted: January 28, 2019 Published: January 31, 2019
Copyright © 2019 by author(s) and Scientific Research Publishing Inc. This work is licensed under the Creative Commons Attribution International License (CC BY 4.0).
http://creativecommons.org/licenses/by/4.0/
DOI: 10.4236/ojopm.2019.91001 2 Open Journal of Organic Polymer Materials additive manufacturing of 3D-printed ABS with improved mechanical prop-erties.
Keywords
Build Parameters, Mechanical Properties, Additive Manufacturing, 3D Printing, Acrylonitrile Butadiene Styrene
1. Introduction
The ever-increasing demand for the development of new performance materials is attracting unprecedented renewed research interests in materials science. However, the rapid production of critical machine components and complex structures with high precision, at minimal cost, and with the required service properties may not be feasible by the conventional manufacturing techniques [1]-[8]. This was a strong motivation for the emergence of Additive Manufac-turing (AM). Research concerns in AM have risen in a number of distinct ways [9]. It has gained prominence both in the popular media as well as the scientific journals [10] [11]. Research activities on the industrial applications of AM have led to an astronomical expansion in market for components produced through AM [12]. In addition, there is the prediction of a global compound annual growth of 27% in AM [13] and the nearly $11 billion industry in 2015 will in-crease to $26.7 billion by 2019. Furthermore, it was reported that the aggregate share of global AM by the United States, West European and Asian markets is expected to rise from 59.2% recorded in 2014 to an estimated 70% by 2019. Ac-cording to [14], AM market has equally been projected to grow to $3.5 billion in 2017 and to approximately $10 billion in 2022. These exciting market reports may not be realized unless researchers redouble their efforts in the field of AM.
Additive manufacturing can be described as the process of adding material layer by layer to form a part [15]. This contrasts with the traditional method, of-ten referred to as Subtractive Manufacturing (SM), in which material is removed from the bulk to form the desired component. It is a technique that surpasses SM as it opens up opportunity for handling complex shapes with great design flexibility, and reducing waste in the production of machine components [16] [17] [18] [19] [20]. This method has become very popular for industrial and domestic purposes as it provides opportunities for reducing lead time and maximizing inventory strategies [21]. Among different AM technologies availa-ble, FDM remains one of the most versatile techniques due to its inherent flex-ibility and rapid prototyping [4] [7] [12] [22]-[29]. In FDM process, a thermop-lastic filament is heated and extruded using a robotically controlled head where the material is deployed layer by layer on a printing surface in a tempera-ture-controlled environment [27] [30] [31] [32].
accep-DOI: 10.4236/ojopm.2019.91001 3 Open Journal of Organic Polymer Materials tance of FDM for production of structural components (Bumper bars, clarinets, automotive interiors and valves, pipes and fittings, bathtubs, shower stalls, con-nectors, etc.) from polymers. Several research efforts have focused on FDM for manufacturing ABS based components. FDM process with laser-assisted heating was adopted by Jun et al. [33] for improving the forming quality and shape ac-curacy of ABS. Results showed that the laser-assisted heating in the forming of ABS thin-walled parts has enormous effect in increasing the temperature of the local forming regions than the pre and post laser-assisted heating. The signifi-cant benefit of this temperature rise at the local forming regions is the remarka-ble improvement in the tensile strength, shape accuracy and effective bonding width of thin-walled fabricated parts using laser-assisted heating. As part of ef-forts to improve the performance of 3D-printed ABS, graphene nanoplatelets were incorporated in ABS matrix by Dul et al. [27] using a completely sol-vent-free process and then extruded in filaments suitable for FDM. Although the incorporation of graphene nanoplatelets improved tensile modulus, substantial reductions in the ultimate tensile strength, strain at break, coefficient of thermal dilation and creep compliance of the ABS were observed.
The influence of build processing parameters of 3D using FDM on the quality of parts and their functionality has been documented in the literature [34]. Guessama et al. [35] investigated the anisotropic damage effect of 3D printed ABS from FDM. The authors adopted severe compression conditions to describe anisotropy induced when printing under different build orientations. The out-come of the study revealed inconsistent plastic damage. It was concluded in their work that printing orientation is a key build parameter to be considered in order to optimize service properties of FDM 3D printed ABS. While Griffiths et al. [36] studied the influence of FDM build parameters on processing efficiency and performance of build parts, Srivastava et al. [37] employed response surface me-thodology for optimizing FDM process parameters such as (contour width, ras-ter width, air gap, rasras-ter angle, slice height and orientation). From the foregoing and other similar studies [38]-[44], it has been reported in literature that FDM build parameters have enormous effects on cost optimization and performance properties of ABS and other polymeric based materials. Despite that mechanical properties of polymers material are critical for their structural applications, available studies on the influence of FDM build parameters on the mechanical properties of 3D-printed polymer materials are limited.
ef-DOI: 10.4236/ojopm.2019.91001 4 Open Journal of Organic Polymer Materials fective for the optimization of the tensile strength and Young modulus. Wu et al. [41] investigated the effects of raster angle and layer thickness parameters on the mechanical properties of 3D-printed ABS and Polyether-ether-ketone (PEEK). It was found that raster angle and layer thickness have significant effects on their tensile, compressive and bending properties. The combination of 300 µm layer thickness and [0˚/90˚] raster angle led to an optimal improvement in their chanical properties. Although FDM build parameters demonstrated better me-chanical properties for PEEK in comparison to ABS, the challenge of pore for-mation and poor interlayer bonding were reported by the authors as research gaps for future works. In Luzamin et al. [42], the influence of layer thickness, deposition angle and infill parameters on Flexural force in FDM built specimens was studied. It was shown that combinations of 10% infill and 60˚ deposition angle reduced the total build time and improved the maximum flexural strength. The drawback of their works [42] is the issue of high minimum detectable effect size (MDES). Thus, for higher flexural strength at this combination of FDM build parameters, there is need for further research efforts towards reducing the MDES.
Kay [45] studied the effect of raster orientation on the structural response of 3D-printed ABS based material using FDM. The study showed that specimens with raster oriented in the direction of loading exhibited the highest strength. In a study performed by Roberson et al. [46], 3D-printed impact ABS test speci-mens were considered in order to compare the effect of stress concentrator fa-brication on the impact test data from printing and machining approaches. This was done in four different build orientations. There was an evidence of sensitiv-ity to build orientation in terms of impact resistance, impact energy and break energy. An attempt was made by Patel et al. [47] to examine the influence of crack length and layer orientation on 3D-printed ABS specimens. It was found that crack length and layer orientation dictate the fracture properties of the spe-cimens. An increase in crack length enhances the stress intensity factor, but de-creases the required fracture load. Riddick et al. [48] investigated the effects of build direction and orientation on the mechanical response and failure mechanism of the fabricated ABS specimens. The tensile strength, the elongation-at-break and the tensile modulus were characterized along with failure surfaces at differ-ent build direction and raster oridiffer-entation [−45˚/+45˚], [0˚/90˚], [90˚]. Their re-sults showed that the tensile strength, elongation-at-break and tensile modulus were highly dependent upon raster angle and build direction.
thick-DOI: 10.4236/ojopm.2019.91001 5 Open Journal of Organic Polymer Materials ness and raster orientation significantly influenced its mechanical properties. Mishra [51] reported that FDM build parameters such as raster fill pattern enormously influences the mechanical and wear resistance behaviors of 3D- printed ABS specimen. Effort was made to minimize the anisotropic behavior by controlling the raster fill pattern during part buildings. It was found that an in-crease in part orientation and layer thickness inin-creases the surface roughness and presence of residual stresses. Dawoud et al. [52] investigated the influence of selected FDM build parameters on the mechanical response of ABS. The authors explored variations in raster angle and gap as possible criteria for improving the mechanical behavior of ABS material. Maximum tensile and impact strengths were obtained in the study with raster angle of [−45˚/+45˚] whereas [0˚/90˚] fa-vored the attainment of the most enhanced flexural strength. It was however re-ported that a positive gap drastically reduced the investigated mechanical prop-erties.
Owolabi et al. [32] carried out a study to understand the high strain rate dy-namic behavior of 3D-printed ABS produced using FDM. Results obtained showed multiple stages of contraction and expansion during impact loading. The ring-like formation observed around layers of the specimen was noted to lead to the significant manifestation of multistage deformation behavior in 3D-printed ABS. This multistage collapse is an indication of potentials for novel energy absorption mechanism that can be explored at lower strain rates. The manner of fabrication using FDM which absorbed and released the energy thus acting as a multistage spring was attributed to the potential energy absorption mechanism. From the authors’ findings, the choice of FDM as a production technique for 3D-printed ABS can be considered as beneficial if capability for ener-gy absorption is highly paramount. An investigation on the thermo-mechanical creep properties of polymeric materials such as ABS using FDM was conducted by Turk et al. [53]. The outcome of this work showed that FDM build orienta-tions significantly influences the mechanical properties of ABS. Huang et al. [30] investigated the effects of FDM build fiber orientation, filament dimensions, and chemical composition on the mechanical properties of ABS-printed compo-nents. Results of 3D-printed material manifested anisotropic properties at dif-ferent filament extrusion directions. In the study carried out by Aliheidari et al. [54] on the fracture resistance measurement of FDM 3D-printed ABS, it was in-ferred that the degree of interlayer bonding influences the fracture resistance properties of ABS materials.
DOI: 10.4236/ojopm.2019.91001 6 Open Journal of Organic Polymer Materials Apart from the fact that studies on the effects of various combinations of FDM build parameters on mechanical properties of 3D-printed ABS are very sparse, investigations on multiple build styles of three parameters combinations for each build style have not been sighted. In view of these research gaps, there is need for continuous rigorous research efforts in order to further elucidate the influences of different build parameters on the mechanical behaviors of ABS. In this work, an investigation is made into the effects of raster angle, layer thickness and inte-rior fill style at different strain rates on the modulus of toughness and modulus of resilience of 3D-printed ABS which have been rarely reported in literature. In addition, the effects of these parameters on the yield strength and the ultimate tensile strength were studied to complement what have been earlier reported. The printer available for this study only had discrete layer thicknesses available making continued exploration of this parameter impossible. The attempt made on investigating the effects of eight distinct build styles (with three FDM build parameters combinations for each build style) and exploration of different strain rates can be considered as the novelty of the present work. The outcome of this study may provide more useful information for predicting mechanical properties of FDM build 3D-printed ABS.
2. Materials and Methods
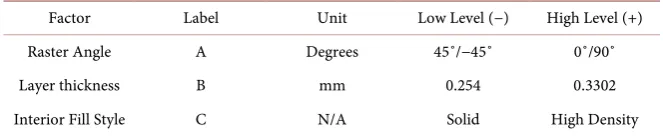
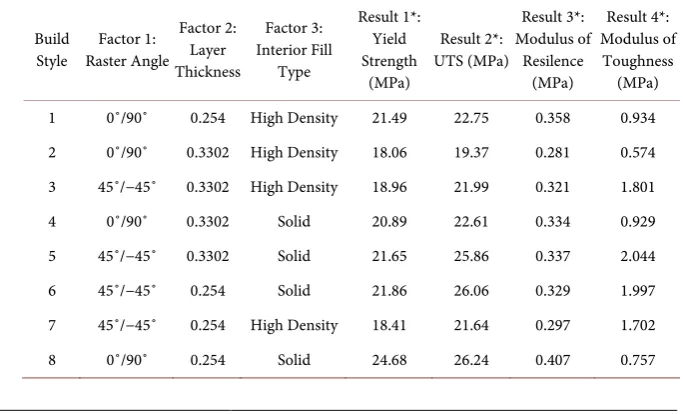
The Specimens used in this work were manufactured from commercially availa-ble ABS P430 filament. This filament was designed for use with the procured 3D printer, the Stratasys Dimension 1200es. The machine’s build envelop was 254 mm × 254 mm × 305 mm. Full factorial design experiment was performed. This experiment incorporated a 2-level, 3-factor design with raster angle, layer thick-ness and interior fill style as illustrated in Table 1. Response variables under in-vestigation include the yield strength, ultimate tensile strength (UTS), modulus of resilience and modulus of toughness. There was a total of 8 build combina-tions as indicated in Table 2.
The ASTM dog bone test specimen was designed using Siemens NX 10 CAD software. The test specimens were designed to conform to ASTM D-638, Stan-dard Test Method for Tensile Testing of Plastics, as illustrated in Figure 1. The CAD file was then exported as an STL file such that it could be interpreted by the FDM software, CatalystEX. Prior to testing, specimens were visually in-spected for any physical damage and labelled per their build style and produc-tion date. Specimens were then condiproduc-tioned for a minimum of 48 hours at 77 degrees Fahrenheit to comply with the ASTM D638 standard. Upon completing the conditioning period, uniaxial tensile tests were carried out using the 50 kN Instron 5569A tensile testing machine equipped with Bluehill data acquisition software, as shown in Figure 2. Testing was carried out at four different strain rates: 0.127 cm/min, 0.5 cm/min, 5 cm/min and 10 cm/min.
DOI: 10.4236/ojopm.2019.91001 7 Open Journal of Organic Polymer Materials Table 1. FDM process parameters and associated levels.
Factor Label Unit Low Level (−) High Level (+)
Raster Angle A Degrees 45˚/−45˚ 0˚/90˚
Layer thickness B mm 0.254 0.3302
Interior Fill Style C N/A Solid High Density
Table 2. Full factorial experimental design.
Build Factor 1: Raster Angle Factor 2: Layer Thickness Factor 3: Interior Fill Style
1 0˚/90˚ (+) 0.254 (−) High Density (+)
2 0˚/90˚ (+) 0.3302 (+) High Density (+)
3 45˚/−45˚ (−) 0.3302 (+) High Density (+)
4 0˚/90˚ (+) 0.3302 (+) Solid (−)
5 45˚/−45˚ (−) 0.3302 (+) Solid (−)
6 45˚/−45˚ (−) 0.254 (−) Solid (−)
7 45˚/−45˚ (−) 0.254 (−) High Density (+)
[image:7.595.208.540.193.506.2] [image:7.595.212.535.527.706.2]8 0˚/90˚ (+) 0.254 (−) Solid (−)
Figure 1. ASTM D638 Dog-Bone Test Specimen [56].
DOI: 10.4236/ojopm.2019.91001 8 Open Journal of Organic Polymer Materials the Bluehill data acquisition software. The yield strength was calculated using the 0.2% offset method, while the modulus of resilience and the modulus of toughness were calculated by finding the area under the stress-strain curve up to the yield point and the point of fracture, respectively. Statistical significance was determined using IBM’s SPSS statistics software. A factorial Analysis of Variance (ANOVA) with four independent variables (raster angle, layer thickness, interior fill style, and strain rate) was conducted at a 95% confidence interval (the signif-icant or risk level α was set at 0.05).
3. Results and Discussion
3.1. Comparison of the Effect of Build Parameter on the
Mechanical Properties of ABS
In Griffiths et al. [36], the ultimate tensile strength that was obtained with 100% infill build parameter is similar to that of the present work where the highest ul-timate tensile strength was obtained with solid interior fill style. The layer thick-ness values in the present work and that of [36] differs by 36.5%, in a build style consisting of interior fill and layer thickness parameters combination. Among the [45˚/−45˚], [0˚], [90˚] and [0˚/90˚] raster angles investigated by Riddick et al. [48], the raster angle [45˚/−45˚] in the vertical build specimens of ABS exhi-bited the highest ultimate tensile strength of 19.80 MPa. Whereas the present study achieved optimum ultimate tensile strength with raster angle of [0˚/90˚]. The optimal ultimate tensile strength of 27.30 MPa was achieved in this work with build style 8 (from optimum combination of build parameters: [0˚/90˚] raster angle, 0.254 mm layer thickness and solid interior fill style). In Rankouhi
et al. [50] and the present study, the choice of low layer thickness seemed to
fa-vor the attainment of the highest ultimate tensile strength. Their tensile test re-sults showed that ABS samples printed with 0.200 mm layer thickness exhibited higher ultimate tensile strength compared with 0.400 mm layer thickness. This is very much similar to the results of the present study where 0.254 mm layer thickness displayed higher ultimate tensile strength than the layer thickness of 0.3302 mm. The maximum ultimate tensile strength was obtained in the study of Dawoud et al. [52] with raster angle of [−45˚/+45˚] contrary to [0˚/90˚] obtained in the present work.
Based on the comparisons made to prior research efforts [36] [48] [50] [52], the results presented in this study on modulus of toughness and modulus of resi-lience of 3D-printed ABS using different build styles (combinations of raster an-gle, layer thickness and interior fill style for each style) and the effect of strain rate on their mechanical properties can be considered as novel contributions to the existing literature.
3.1.1. Raster Angle Observations
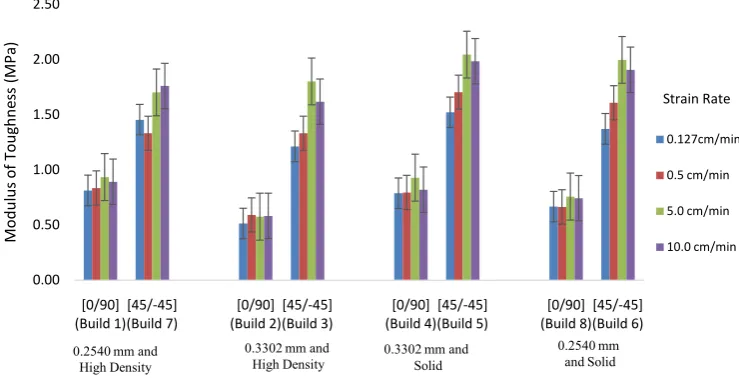
DOI: 10.4236/ojopm.2019.91001 9 Open Journal of Organic Polymer Materials Figure 3. Effect of Raster Angle on Modulus of Toughness.
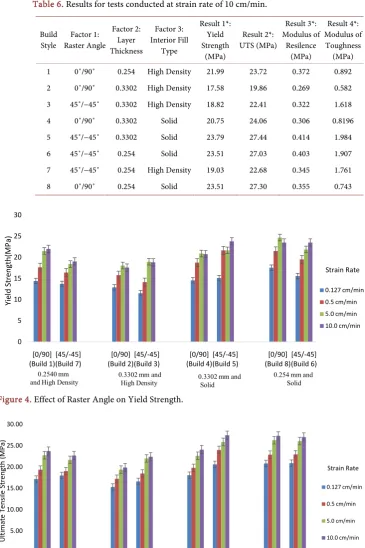
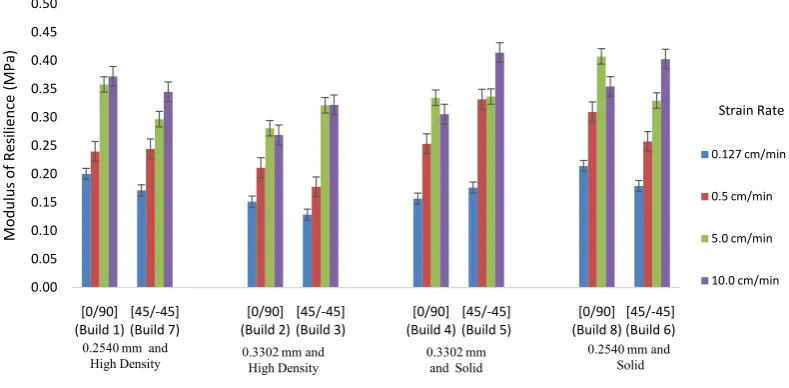
raster angle when compared to specimens built with the [0˚/90˚] raster angle. This observation was consistent throughout the experiment when comparing specimens built with the crisscross [45˚/−45˚] raster angle versus specimens built with the cross [0˚/90˚] raster angle. This difference in raster angle can lead to an increase of up to 200% in modulus of toughness in favor of specimens built with the [45˚/−45˚] raster angle. The results for the other material responses were not as clear. For example, Table 3 shows that build style 1, which was fa-bricated with the cross [0˚/90˚] raster angle, had a higher mean yield strength and modulus of resilience than build style 7, which was fabricated using the crisscross [45˚/−45˚] raster angle while holding the other parameters constant. However, build style 7 had a higher mean UTS and modulus of toughness when compared to build style 1. As the strain rate is increased in Tables 4-6, some overlaps were observed for the mean values of yield strength, UTS, and even modulus of resilience for build style 1 and build style 7. The constant overlaps of error bar and trend reversals in Figures 4-6 make it difficult to identify the relationship between the raster angle and the investigated mechani-cal properties.
3.1.2. Layer Thickness
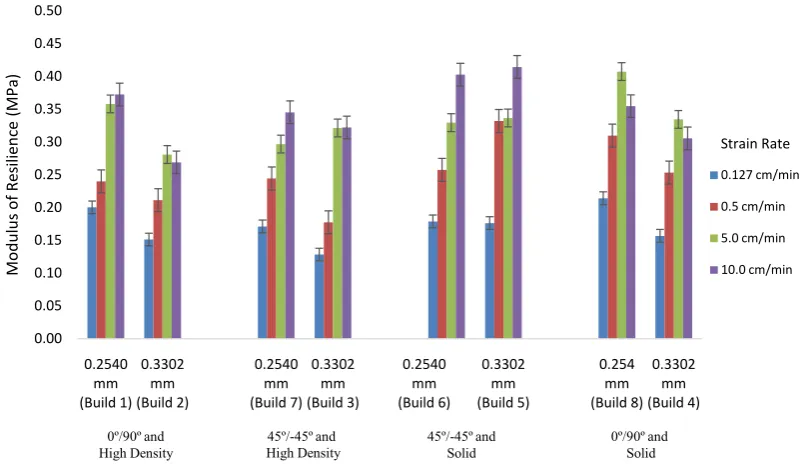
Results obtained showed that the smaller layer thickness of 0.254 mm had su-perior mechanical properties, only for specimens built with the cross [0˚/90˚] raster angle (Factor 1: +). Specimens built with both 0.254 mm layer thickness and the cross [0˚/90˚] raster angle had superior mechanical properties when compared to those built with the 0.3302 mm layer thickness and cross [0˚/90˚] raster angle. When the 0.254 mm layer thickness is combined with the crisscross [45˚/−45˚] raster angle, this trend is either reversed or not distinct. This suggests that there may be key interaction between the layer thickness and the raster an-gle that dictated the mechanical properties of the specimens. This observation is illustrated in Figures 7-10.
0.00 0.50 1.00 1.50 2.00 2.50
[0/90]
(Build 1)[45/-45](Build 7) (Build 2)[0/90][45/-45](Build 3) (Build 4)[0/90][45/-45](Build 5) (Build 8)[0/90][45/-45](Build 6)
M
odul
us
o
f T
oug
hne
ss
(M
Pa
)
0.127cm/min
0.5 cm/min
5.0 cm/min
10.0 cm/min Strain Rate
0.3302 mm and
High Density 0.3302 mm andSolid
0.2540 mm and Solid 0.2540 mm and
DOI: 10.4236/ojopm.2019.91001 10 Open Journal of Organic Polymer Materials Table 3. Results for tests conducted at strain rate of 0.127 cm/min.
Build
Style Raster Angle Factor 1:
Factor 2: Layer Thickness
Factor 3: Inte-rior Fill Type
Result 1*: Yield Strength (MPa) Result 2*: UTS (MPa) Result 3*: Modulus of Resilence (MPa) Result 4*: Modulus of Toughness (MPa)
1 0˚/90˚ 0.254 High Density 14.41 17.17 0.200 0.813
2 0˚/90˚ 0.3302 High Density 12.89 15.31 0.151 0.514
3 45˚/−45˚ 0.3302 High Density 11.51 16.62 0.128 1.213
4 0˚/90˚ 0.3302 Solid 14.55 18.06 0.157 0.788
5 45˚/−45˚ 0.3302 Solid 15.10 20.62 0.176 1.521
6 45˚/−45˚ 0.254 Solid 15.58 20.89 0.179 1.371
7 45˚/−45˚ 0.254 High Density 13.72 18.00 0.171 1.454
[image:10.595.210.540.312.498.2]8 0˚/90˚ 0.254 Solid 17.56 20.82 0.214 0.666
Table 4. Results for tests conducted at strain rate of 0.5 cm/min.
Build
Style Raster Angle Factor 1:
Factor 2: Layer Thickness Factor 3: Interior Fill Type Result 1*: Yield Strength (MPa) Result 2*: UTS (MPa) Result 3*: Modulus of Resilence (MPa) Result 4*: Modulus of Toughness (MPa)
1 0˚/90˚ 0.254 High Density 17.65 19.37 0.240 0.835
2 0˚/90˚ 0.3302 High Density 15.79 17.24 0.211 0.591
3 45˚/−45˚ 0.3302 High Density 14.13 18.48 0.178 1.332
4 0˚/90˚ 0.3302 Solid 18.75 19.79 0.253 0.794
5 45˚/−45˚ 0.3302 Solid 21.65 23.99 0.332 1.704
6 45˚/−45˚ 0.254 Solid 19.51 22.96 0.257 1.608
7 45˚/−45˚ 0.254 High Density 16.41 19.03 0.244 1.332
8 0˚/90˚ 0.254 Solid 21.51 22.89 0.310 0.663
Table 5. Results for tests conducted at strain rate of 5 cm/min.
Build
Style Raster Angle Factor 1: Factor 2: Layer Thickness Factor 3: Interior Fill Type Result 1*: Yield Strength (MPa) Result 2*: UTS (MPa) Result 3*: Modulus of Resilence (MPa) Result 4*: Modulus of Toughness (MPa)
1 0˚/90˚ 0.254 High Density 21.49 22.75 0.358 0.934
2 0˚/90˚ 0.3302 High Density 18.06 19.37 0.281 0.574
3 45˚/−45˚ 0.3302 High Density 18.96 21.99 0.321 1.801
4 0˚/90˚ 0.3302 Solid 20.89 22.61 0.334 0.929
5 45˚/−45˚ 0.3302 Solid 21.65 25.86 0.337 2.044
6 45˚/−45˚ 0.254 Solid 21.86 26.06 0.329 1.997
7 45˚/−45˚ 0.254 High Density 18.41 21.64 0.297 1.702
[image:10.595.198.540.532.739.2]DOI: 10.4236/ojopm.2019.91001 11 Open Journal of Organic Polymer Materials Table 6. Results for tests conducted at strain rate of 10 cm/min.
Build
Style Raster Angle Factor 1:
Factor 2: Layer Thickness Factor 3: Interior Fill Type Result 1*: Yield Strength (MPa) Result 2*: UTS (MPa) Result 3*: Modulus of Resilence (MPa) Result 4*: Modulus of Toughness (MPa)
1 0˚/90˚ 0.254 High Density 21.99 23.72 0.372 0.892
2 0˚/90˚ 0.3302 High Density 17.58 19.86 0.269 0.582
3 45˚/−45˚ 0.3302 High Density 18.82 22.41 0.322 1.618
4 0˚/90˚ 0.3302 Solid 20.75 24.06 0.306 0.8196
5 45˚/−45˚ 0.3302 Solid 23.79 27.44 0.414 1.984
6 45˚/−45˚ 0.254 Solid 23.51 27.03 0.403 1.907
7 45˚/−45˚ 0.254 High Density 19.03 22.68 0.345 1.761
[image:11.595.173.537.474.668.2]8 0˚/90˚ 0.254 Solid 23.51 27.30 0.355 0.743
Figure 4. Effect of Raster Angle on Yield Strength.
Figure 5. Effect of Raster Angle on Ultimate Tensile Strength.
3.1.3. Interior Fill Style
The effect of the interior fill style on the yield strength is illustrated in Figure 11. 0 5 10 15 20 25 30 [0/90]
(Build 1)[45/-45](Build 7) (Build 2)[0/90](Build 3)[45/-45] (Build 4)[0/90](Build 5)[45/-45] (Build 8)[0/90] [45/-45](Build 6)
Yi el d St re ngt h( M Pa ) 0.127 cm/min 0.5 cm/min 5.0 cm/min 10.0 cm/min Strain Rate 0.2540 mm
and High Density 0.3302 mm and High Density 0.3302 mm andSolid 0.254 mm andSolid
0.00 5.00 10.00 15.00 20.00 25.00 30.00 [0/90]
(Build 1)(Build 7)[45/-45] (Build 2)[0/90] (Build 3)[45/-45] (Build 4)[0/90](Build 5)[45/-45] (Build 8)[0/90](Build 6)[45/-45]
Ul tima te T en sil e St ren gt h (M Pa ) 0.127 cm/min 0.5 cm/min 5.0 cm/min 10.0 cm/min Strain Rate
0.2540 mm and
DOI: 10.4236/ojopm.2019.91001 12 Open Journal of Organic Polymer Materials Figure 6. Effect of Raster Angle on Modulus of Resilience.
Figure 7. Effect of Layer Thickness on Yield Strength.
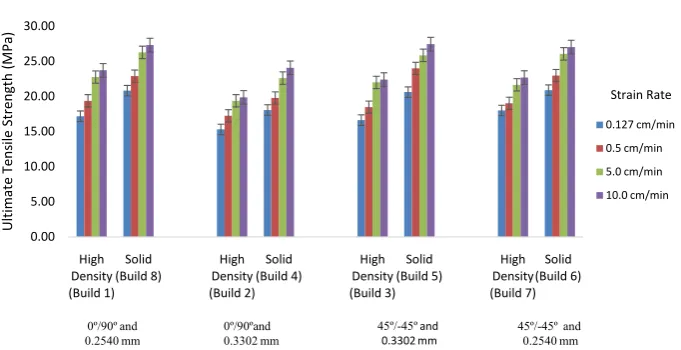
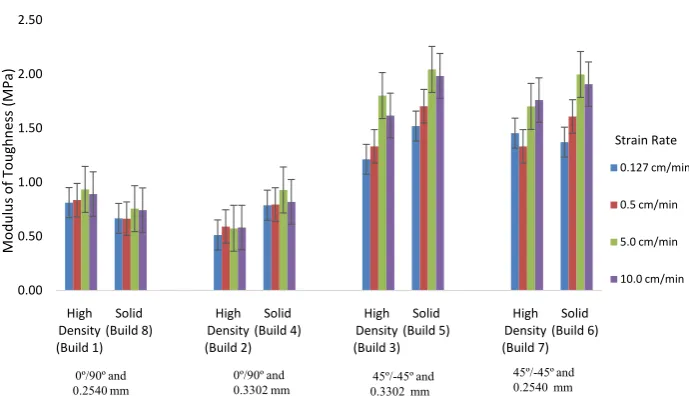
It is shown that build 8 (Solid) had higher average yield strength at all strain rates when compared to build 1 (High Density). This observed increase from 7% to about 53% is consistent across build comparisons in Figure 11 and at all strain rates. The effect of the interior fill style on the UTS is described using Figure 12. It was revealed that build 8, with the solid interior fill style, had a higher UTS for all strain rates in comparison to build 1. This observation is con-sistent across all build comparisons in Figure 8 and at all strain rates with an in-crease ranging from 15% to 29%. Similar observations were noticed on the effect of the interior fill style on the modulus of resilience and modulus of toughness as 0.00 0.05 0.10 0.15 0.20 0.25 0.30 0.35 0.40 0.45 0.50 [0/90]
(Build 1)[45/-45](Build 7) (Build 2)[0/90] (Build 3)[45/-45] (Build 4)[0/90] [45/-45](Build 5) (Build 8)[0/90] [45/-45](Build 6)
M od ul us o f Re sil ie nce (M Pa ) 0.127 cm/min 0.5 cm/min 5.0 cm/min 10.0 cm/min Strain Rate
0.2540 mm and
High Density 0.3302 mm and High Density 0.3302 mm and Solid 0.2540 mm andSolid
0 5 10 15 20 25 30 0.254 mm (Build 1) 0.3302 mm (Build 2) 0.254 mm (Build 7) 0.3302 mm (Build 3) 0.254 mm (Build 6) 0.3302 mm (Build 5) 0.254 mm (Build 8) 0.3302 mm (Build 4) Yi el d St re ngt h ( M Pa ) 0.127 cm/min 0.5 cm/min 5.0 cm/min 10.0 cm/min Strain Rate 45º/-45º and
High Density and Solid45º/-45º
0º/90º and Solid 0º/90º and High
DOI: 10.4236/ojopm.2019.91001 13 Open Journal of Organic Polymer Materials Figure 8. Effect of Layer Thickness on Ultimate Tensile Strength.
Figure 9. Effect of Layer Thickness on Modulus of Resilience.
shown in Figure 13 and Figure 14, respectively. These observations were deemed reasonable since the solid interior fill style can accommodate more stress due to its denser structure and higher effective cross-sectional area than that of the high density interior fill style.
0.00 5.00 10.00 15.00 20.00 25.00 30.00 35.00 0.2540 mm (Build 1) 0.3302 mm (Build 2) 0.2540 mm (Build 7) 0.3302 mm (Build 3) 0.2540 mm (Build 6) 0.3302 mm (Build 5)
U lti ma te T en sil e St ren gt h (M Pa ) 0.127 cm/min 0.5 cm/min 5.0 cm/min 10.0 cm/min Strain Rate
45º/-45º and
High Density and Solid45º/-45º and Solid0º/90º 0º/90º and High
Density 0.00 0.05 0.10 0.15 0.20 0.25 0.30 0.35 0.40 0.45 0.50 0.2540 mm (Build 1) 0.3302 mm (Build 2) 0.2540 mm (Build 7) 0.3302 mm (Build 3) 0.2540 mm (Build 6) 0.3302 mm (Build 5) 0.254 mm (Build 8) 0.3302 mm (Build 4) M od ul us o f Re sil ie nce (M Pa ) 0.127 cm/min 0.5 cm/min 5.0 cm/min 10.0 cm/min Strain Rate 0º/90º and
DOI: 10.4236/ojopm.2019.91001 14 Open Journal of Organic Polymer Materials Figure 10. Effect of Layer Thickness on Modulus of Toughness.
Figure 11. Effect of Interior Fill Style on Yield Strength.
Figure 12. Effect of Interior Fill Style on Ultimate Tensile Strength. 0
5 10 15 20 25 30
High Density (Build 1)
Solid
(Build 8) DensityHigh (Build 2)
Solid
(Build 4) DensityHigh (Build 3)
Solid
(Build 5) DensityHigh (Build 7)
Solid (Build 6)
Yi
el
d St
re
ngt
h (
M
Pa
)
0.127 cm/min
0.5 cm/min
5.0 cm/min
10.0 cm/min
0º/90º and
0.3302 mm 45º/-45º and 0.3302 mm 45º/-45º and 0.2540 mm
Strain Rate
0º/90º and 0.2540 mm
0.00 5.00 10.00 15.00 20.00 25.00 30.00
High Density (Build 1)
Solid
(Build 8) DensityHigh (Build 2)
Solid
(Build 4) DensityHigh (Build 3)
Solid
(Build 5) DensityHigh (Build 7)
Solid (Build 6)
Ul
tima
te T
en
sil
e
St
ren
gt
h
(M
Pa
)
0.127 cm/min 0.5 cm/min 5.0 cm/min 10.0 cm/min
45º/-45ºand
0.3302 mm 45º/-45º and 0.2540 mm
Strain Rate
0º/90º and
[image:14.595.197.541.320.698.2] [image:14.595.199.540.530.705.2]DOI: 10.4236/ojopm.2019.91001 15 Open Journal of Organic Polymer Materials Figure 13. Effect of Interior Fill Style on Modulus of Resilience.
Figure 14. Effect of Interior Fill Style on Modulus of Toughness.
3.2. Statistical Significance
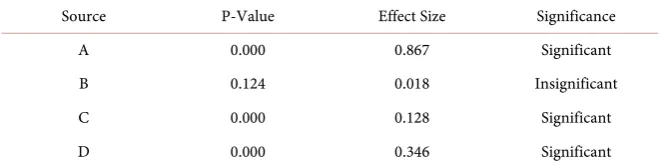
The summary of ANOVA for modulus of toughness, modulus of resilience, UTS and yield strength is illustrated in Tables 7-10. The modulus of tough-ness results indicated a dominant, statistically significant main effect of raster angle (A) (with a p-value = 0.000) followed by a significant main effect in in-terior fill style (C) (p-value = 0.000) and strain rate (D) (p-value = 0.000). The main effect for layer thickness (B) was deemed insignificant. Analysis for the modulus of resilience implies a dominant, statistically significant main effect of strain rate (D) (p-value = 0.000) followed by a significant main effect in in-terior fill style (C) (p-value = 0.000) and layer thickness (B) (p-value = 0.000). The main effect for raster angle (A) was considered insignificant with a p-value of 0.858.
The ANOVA summary for UTS showed a dominant, statistically significant 0.00 0.05 0.10 0.15 0.20 0.25 0.30 0.35 0.40 0.45 0.50 High Density (Build 1) Solid
(Build 8) DensityHigh (Build 2)
Solid
(Build 4) DensityHigh (Build 3)
Solid
(Build 5) DensityHigh (Build 7) Solid (Build 6) M od ul us o
f Re
sil ie nce (M Pa ) 0.127 cm/min 0.5 cm/min 5.0 cm/min 10.0 cm/min Strain Rate 0º/90º and
0.2540 mm 0.3302 mm0º/90º and 45º/-45º and0.3302 mm 45º/-45º and 0.2540 mm
0.00 0.50 1.00 1.50 2.00 2.50 High Density (Build 1) Solid
(Build 8) DensityHigh (Build 2)
Solid
(Build 4) DensityHigh (Build 3)
Solid
(Build 5) DensityHigh (Build 7) Solid (Build 6) M odul us o f T oug hne ss (M Pa ) 0.127 cm/min 0.5 cm/min 5.0 cm/min 10.0 cm/min 0º/90º and
0.3302 mm 0.3302 mm45º/-45º and
45º/-45º and 0.2540 mm 0º/90º and
0.2540 mm
[image:15.595.191.536.293.493.2]DOI: 10.4236/ojopm.2019.91001 16 Open Journal of Organic Polymer Materials Table 7. ANOVA summary table for modulus of toughness.
Source P-Value Effect Size Significance
A 0.000 0.867 Significant
B 0.124 0.018 Insignificant
C 0.000 0.128 Significant
[image:16.595.210.538.207.291.2]D 0.000 0.346 Significant
Table 8. ANOVA summary table for modulus of resilience.
Source P-Value Effect Size Significance
A 0.858 0.000 Insignificant
B 0.000 0.221 Significant
C 0.000 0.329 Significant
[image:16.595.210.539.325.409.2]D 0.000 0.846 Significant
Table 9. ANOVA summary table for UTS.
Source P-Value Effect Size Significance
A 0.000 0.102 Significant
B 0.000 0.503 Significant
C 0.000 0.815 Significant
[image:16.595.210.540.442.527.2]D 0.000 0.917 Significant
Table 10. ANOVA summary table for yield strength.
Source P-Value Effect Size Significance
A 0.000 0.574 Significant
B 0.000 0.720 Significant
C 0.000 0.938 Significant
D 0.000 0.957 Significant
main effect of strain rate (D) (with a p-value = 0.000) and interior fill style (C) (with a p-value = 0.000). This is followed by significant main effects in layer thickness (B) (p-value = 0.000) and raster angle (A) (p-value = 0.000). Also for yield strength, results showed a dominant, statistically significant main effect of strain rate (D) (p-value = 0.000) and interior fill style (C) (p-value = 0.000). This is followed by significant main effects in layer thickness (B) (p-value = 0.000) and raster angle (A) (p-value = 0.000).
3.3. Stress-Strain Curves
DOI: 10.4236/ojopm.2019.91001 17 Open Journal of Organic Polymer Materials Figure 15. Stress Strain Curves for [0˚/90˚] Raster Angle Specimens at 0.5 cm/min.
Figure 16. Stress Strain Curves for [45˚/−45˚] Raster Angle Specimens at 0.5 cm/min.
build styles 1, 2, 4, and 8 (shown in Figure 15) represent those for a brittle ma-terial with the [0˚/90˚] raster angle being the only common process parameter among all the aforementioned build styles. Whereas, the stress-strain curves for build style 3, 5, 6, and 7 (shown in Figure 16) show a more ductile material as they undergo a much larger amount of plastic deformation prior to fracture. Build styles 3, 5, 6, and 7 shared the [45˚/−45˚] raster angle as the only common process parameter. Furthermore, build styles produced with the [−45˚/45˚] ras-ter angle tends to favor the viscous/energy damping properties of ABS. This im-proves the modulus of toughness and ability to tolerate plastic deformation when compared to their [0˚/90˚] counterparts.
0 5 10 15 20 25
0 0.02 0.04 0.06 0.08 0.1
St
re
ss (
M
Pa
)
Engineering Strain
Build Style 1 Build Style 2 Build Style 4 Build Style 8
0 5 10 15 20 25
0 0.02 0.04 0.06 0.08 0.1
St
re
ss (
M
Pa
)
Engineering Strain
[image:17.595.229.516.350.541.2]DOI: 10.4236/ojopm.2019.91001 18 Open Journal of Organic Polymer Materials
3.4. Strain Rate Sensitivity
For all build styles, most mechanical properties investigated in this study exhi-bited modest sensitivity to the strain rate with the mean value of each property increasing as the strain rate is increased. From Figure 17 and Figure 19, a clear distinction between the UTS at the lower strain rates of 0.127 cm/min and 0.5 cm/min was observed. However, this difference is less pronounced at the higher strain rates of 5 cm/min and 10 cm/min. For specimens produced with the [0˚/90˚] raster angle, the mode of failure tended to be more brittle in nature as the strain rate is increased. Surprisingly, this was not the case for specimens produced with the [45˚/−45˚] raster angle as the strain rate seemed to have little effect on the mode of failure and its propensity for plastic deformation.
The effects of strain rate on the other mechanical properties are described us-ing Figure 18-21 were generated with the mean values for each mechanical prop-erty over the four strain rates. Similar to the UTS, there is a distinctive increase
(a)
(b)
0 5 10 15 20 25
0 0.01 0.02 0.03 0.04 0.05 0.06 0.07
St
re
ss (
M
Pa
)
Engineering Strain
0 5 10 15 20 25
0 0.01 0.02 0.03 0.04 0.05 0.06
St
re
ss (
M
Pa
)
DOI: 10.4236/ojopm.2019.91001 19 Open Journal of Organic Polymer Materials
(c)
(d)
(e)
0 5 10 15 20 25
0 0.02 0.04 0.06 0.08 0.1 0.12
St
re
ss (
M
Pa
)
Engineering Strain
0 5 10 15 20 25 30
0 0.01 0.02 0.03 0.04 0.05 0.06
St
re
ss (
M
Pa
)
Engineering Strain
0 5 10 15 20 25 30
0 0.02 0.04 0.06 0.08 0.1 0.12
St
re
ss (
M
Pa
)
DOI: 10.4236/ojopm.2019.91001 20 Open Journal of Organic Polymer Materials
(f)
(g)
[image:20.595.221.522.66.678.2](h)
Figure 17. Strain rate sensitivity of 3D printed ABS with different build styles. (a) Build Style 1; (b) Build Style 2; (c) Build Style 3; (d) Build Style 4; (e) Build Style 5; (f) Build Style 6; (g) Build Style 7; (h) Build Style 8.
0 5 10 15 20 25 30
0 0.02 0.04 0.06 0.08 0.1
St
re
ss (
M
Pa
)
Engineering Strain
0 5 10 15 20 25
0 0.02 0.04 0.06 0.08 0.1 0.12
St
re
ss (
M
Pa
)
Engineering Strain
0 5 10 15 20 25 30
0 0.01 0.02 0.03 0.04 0.05 0.06
St
ess (
M
Pa
)
Engineering Strain
DOI: 10.4236/ojopm.2019.91001 21 Open Journal of Organic Polymer Materials Figure 18. Effect of Strain Rate on Yield Strength.
Figure 19. Effect of Strain Rate on Ultimate Tensile Strength.
Figure 20. Effect of Strain Rate on Modulus of Resilience.
0 5 10 15 20 25 30
Build Style 1
+1,-1,+1 Build Style 2+1,+1,+1 Build Style 3-1,+1,+1 Build Style 4+1,+1,-1 Build Style 5-1,+1,-1 Build Style 6-1,-1,-1 Build Style 7-1,-1,+1 Build Style 8+1,-1,-1
Yie
ld
S
tre
ng
th
(MP
a)
0.127 cm/min
0.5 cm/min
5.0 cm/min
10.0 cm/min Strain Rate
0.00 5.00 10.00 15.00 20.00 25.00 30.00
Build Style 1
+1,-1,+1 Build Style 2+1,+1,+1 Build Style 3-1,+1,+1 Build Style 4+1,+1,-1 Build Style 5-1,+1,-1 Build Style 6-1,-1,-1 Build Style 7-1,-1,+1 Build Style 8+1,-1,-1
U
lti
ma
te T
en
sil
e
St
ren
gt
h
(M
Pa
)
0.127 cm/min
0.5 cm/min
5.0 cm/min
10.0 cm/min Strain Rate
0.00 0.05 0.10 0.15 0.20 0.25 0.30 0.35 0.40 0.45 0.50
Build Style 1
+1,-1,+1 Build Style 2+1,+1,+1 Build Style 3-1,+1,+1 Build Style 4+1,+1,-1 Build Style 5-1,+1,-1 Build Style 6-1,-1,-1 Build Style 7-1,-1,+1 Build Style 8+1,-1,-1
M
od
ul
us
o
f Re
sil
ie
nce
(M
Pa
)
[image:21.595.115.539.519.716.2]DOI: 10.4236/ojopm.2019.91001 22 Open Journal of Organic Polymer Materials Figure 21. Effect of Strain Rate on Modulus of Toughness.
in the mean yield strength and modulus of resilience as the strain rate is in-creased from 0.127 cm/min to 0.5 cm/min. However, there is significant overlap in the mean yield strength values at the higher strain rates of 5 cm/min and 10 cm/min. Based on Figure 21, the effect of strain rate on the modulus of tough-ness seemed to depend on the build style. For specimens produced with the [45˚/−45˚] raster angle, there was a noticeable increase in mean toughness as the strain rate increased. However, specimens produced with the [0˚/90˚] raster an-gle exhibit significant overlap in the mean toughness at all four strain rates.
4. Conclusions
This study focused on investigating the influence of build parameters on the mechanical properties of 3D-printed ABS manufactured using FDM. The fol-lowing specific conclusions can be drawn based on this study:
1) The effect of raster angle was highly significant on modulus of toughness. Specimens built with the [45˚/−45˚] raster angle have potentials for improving the modulus of toughness by 200% when compared to specimens built with the [0˚/90˚] raster angle. At a strain rate of 5 cm/min and [45˚/−45˚] raster angle, a substantial modulus of toughness 2.044 MPa was achieved.
2) The modulus of resilience is strongly influenced by strain rate values. At any build style combinations of parameters, a significant improvement in mod-ulus of resilience is achievable at higher strain rates. A very high modmod-ulus of re-silience was achieved to be 0.414 MPa with specimens built with the [45˚/−45˚] raster angle and solid interior fill style.
3) The UTS and yield strength properties were observed to be dominantly af-fected by strain rate and interior fill style. High UTS of 27.44 MPa and yield strength of 23.79 MPa were obtained with specimens built with the [45˚/−45˚] raster angle and solid interior fill style at a strain rate of 10 cm/min.
4) Although specimens built with both 0.254 mm layer thickness and the cross [0˚/90˚] raster angle had superior mechanical properties to those built with the 0.00
0.50 1.00 1.50 2.00 2.50
Build Style 1
+1,-1,+1 Build Style 2+1,+1,+1 Build Style 3-1,+1,+1 Build Style 4+1,+1,-1 Build Style 5-1,+1,-1 Build Style 6-1,-1,-1 Build Style 7-1,-1,+1 Build Style 8+1,-1,-1
M
odul
us
o
f T
oug
hne
ss
(M
Pa
)
0.127cm/min 0.5 cm/min 5.0 cm/min 10.0 cm/min
DOI: 10.4236/ojopm.2019.91001 23 Open Journal of Organic Polymer Materials 0.3302 mm layer thickness and cross [0˚/90˚] raster angle, the effects of the layer thickness on the mechanical properties was found to be inconsistent. The impli-cation of this is that the interaction between the layer thickness and the raster angle is significant.
5) Specimens built with the solid interior fill style have greater yield strength and UTS than those built with high density. This is mostly due to the added density in the solid fill style that allows the accommodation of more stress than the high density fill style.
Future study will focus on dynamic behavior and wear resistance of the 3D- printed polymers to increase their potential applications in industry.
Acknowledgements
The authors gratefully acknowledge the financial support of Consortium for Advanced Manufacturing. The contributions of Wes Everhart (KCP) are also well appreciated.
Data Availability Statement
Data will be made available on request.
Conflicts of Interest
The authors declare no conflicts of interest regarding the publication of this pa-per.
References
[1] Yakovlev, A., Trunova, E., Grevey, D., Pilloz, M. and Smurov, I. (2005) La-ser-Assisted Direct Manufacturing of Functionally Graded 3D Objects. Surface and Coatings Technology, 190, 15-24. https://doi.org/10.1016/j.surfcoat.2004.07.070
[2] Alimardani, M., Toyserkani, E. and Huissoon, J.P. (2007) Three-Dimensional Nu-merical Approach for Geometrical Prediction of Multilayer Laser Solid Freeform Fabrication Process. Journal of Laser Applications, 19, 14-25.
https://doi.org/10.2351/1.2402518
[3] Ivanova, O., Williams, C. and Thomas, C. (2013) Additive Manufacturing (AM) and Nanotechnology: Promises and Challenges. Rapid Prototyping Journal, 19, 353-364.
https://doi.org/10.1108/RPJ-12-2011-0127
[4] Gurrala, P.K. and Regalla, S.P. (2014) DOE Based Parametric Study of Volumetric Change of FDM Parts. Procedia Materials Science, 6, 354-360.
https://doi.org/10.1016/j.mspro.2014.07.045
[5] Domingo-Espin, M., Puigoriol-Forcada, J.M., Garcia-Granada, A., Liuma, J., Bor-ros, S. and Reyes, G. (2015) Mechanical Property Characterization and Simulation of Fused Deposition Modeling Polycarbonate Parts. Materials & Design, 83, 670-677.
https://doi.org/10.1016/j.matdes.2015.06.074
[6] Srivastava, M., Maheshwari, S. and Kundra, T.K. (2015) Virtual Modelling and Si-mulation of Functionally Graded Material Component using FDM Technique. Ma-terials Today: Proceedings, 2, 3471-3480.
DOI: 10.4236/ojopm.2019.91001 24 Open Journal of Organic Polymer Materials Using Teaching-Learning-Based Optimization Algorithms. Engineering Science and Technology, 19, 587-603. https://doi.org/10.1016/j.jestch.2015.09.008
[8] Wulle, F., Coupek, D., Schaffner, F., Verl, A., Oberhofer, F. and Maier, T. (2017) Workpiece and Machine Design in Additive Manufacturing for Multi-Axis Fused Deposition Modeling. Procedia CIRP, 60, 229-234.
https://doi.org/10.1016/j.procir.2017.01.046
[9] Gross, B.C., Erkal, J.L., Lockwood, S.Y., Chen, C. and Spence, D.M. (2014) Evalua-tion of 3D Printing and Its Potential Impact on Biotechnology and the Chemical Sciences. Analytical Chemistry, 86, 3240-3253. https://doi.org/10.1021/ac403397r
[10] Slotwinski, J.A. and Moylan, S.P. (2014) Metals-Based Additives Manufacturing: Metrology Needs and Standardization Efforts. American Society for Precision En-gineering, 57, 11-12.
[11] Wohler, T. (2012) Additive Manufacturing and 3D Printing State of the Industry. Wohlers’ Report, Wohlers Associates Inc.
[12] Galantucci, L.M., Lavecchia, F. and Percoco, G. (2010) Quantitative Analysis of a Chemical Treatment to Reduce Roughness of Parts Fabricated Using Fused Deposi-tion Modeling. CIRP Annals, 59, 247-250. https://doi.org/10.1016/j.cirp.2010.03.074
[13] I.D.C. (2016) Worldwide Spending on 3D Printing to Grow from Nearly $11 Billion to $26.7 Billion by 2019. https://3dprint.com
[14] Forster, A.M. (2015) Materials Testing Standards for Additive Manufacturing of Polymer Materials: State of the Art and Standards Applicability. National Institute of Standard Technology. https://doi.org/10.6028/NIST.IR.8059
[15] Leon, A.C., Chen, Q., Palaganas, N.B., Palaganas, J.O., Manapat, J. and Advincala, R.C. (2016) High Performance Polymer Nanocomposites for Additive Manufactur-ing Applications. Reactive and Functional Polymers, 103, 141-155.
https://doi.org/10.1016/j.reactfunctpolym.2016.04.010
[16] Gibson, I., Rosen, D.W. and Stucker, B. (2010) Additive Manufacturing Technolo-gies-Rapid Prototyping to Direct Digital Manufacturing. Springer, Berlin, 459. [17] Tekinalp, H.L., Kunc, V., Velez-Garcia, G.M., Duty, C.E., Love, L.J., Naskar, A.K.,
Blue, C.A. and Ozcan, S. (2014) Highly Oriented Carbon Fiber Polymer Composites via Additive Manufacturing. Composites Science and Technology, 105, 144-150.
https://doi.org/10.1016/j.compscitech.2014.10.009
[18] Olsson, A., Hellsing, M.S. and Rennie, A.R. (2017) New Possibilities Using Additive Manufacturing with Materials That Are Difficult to Process and with Complex Structures, Royal Swedish Academy of Sciences. Physica Scripta, 92, 1-8.
https://doi.org/10.1088/1402-4896/aa694e
[19] Kardel, K., Ghaednia, H., Carrano, A.L. and Marghitu, D.B. (2017) Experimental and Theoretical Modeling of Behavior of 3D-Printed Polymers under Collision with a Rigid Rod. Additive Manufacturing, 14, 87-94.
https://doi.org/10.1016/j.addma.2017.01.004
[20] Wang, L. and Gardner, D.J. (2017) Effect of Fused Modeling Processing Parameters on Impact Strength of Cellular Polypropylene. Polymer, 113, 74-80.
https://doi.org/10.1016/j.polymer.2017.02.055
[21] Ransikarbum, K., Ha, S., Ma, J. and Kim, N. (2017) Multi-Objective Optimization Analysis for Part-to-Printer Assignment in a Network of 3D Fused Deposition Modeling. Journal of Manufacturing Systems, 43, 35-46.
https://doi.org/10.1016/j.jmsy.2017.02.012
DOI: 10.4236/ojopm.2019.91001 25 Open Journal of Organic Polymer Materials Empirical Modelling of FDM Process for Compressive Strength Improvement. Journal of Advanced Research, 3, 81-90. https://doi.org/10.1016/j.jare.2011.05.001
[23] Lee, B.H., Abdullah, J. and Khan, Z.A. (2005) Optimization of Rapid Prototyping Parameters for Production of Flexible ABS Object. Journal of Materials Processing Technology, 169, 54-61.https://doi.org/10.1016/j.jmatprotec.2005.02.259
[24] Raut, S., Jaitti, V.S., Khedhar, N.K. and Singh, T.P. (2014) Investigation of the Effect of Built Orientation on Mechanical Properties and Total Cost of FDM Parts. Proce-dia Materials Science, 6, 1625-1630.https://doi.org/10.1016/j.mspro.2014.07.146
[25] Ning, F., Cong, W., Qiu, J., Wei, J. and Wang, S. (2015) Additive Manufacturing of Carbon Reinforced Thermoplastic Composites using Fused Deposition Modeling. Composites Part B: Engineering, 80, 369-378.
https://doi.org/10.1016/j.compositesb.2015.06.013
[26] Lederle, F., Gabriella, F.M., Brunotte, P., Kaldun, C. and Hubner, E.G. (2016) Im-proved Mechanical Properties of 3D-Printed Parts by Fused Deposition Modeling Processed under the Exclusion of Oxygen. Progress in Additive Manufacturing, 1, 3-7.https://doi.org/10.1007/s40964-016-0010-y
[27] Dul, S., Fambri, L. and Pegoretti, A. (2016) Fused Deposition Modeling with ABS Graphene Nanocomposites. Composites Part A: Applied Science and Manufactur-ing, 85, 181-191.https://doi.org/10.1016/j.compositesa.2016.03.013
[28] Alhijjaj, M., Belton, P. and Qi, S. (2016) An Investigation to the Use of Polymer Blends to Improve the Printability of and Regulate Drug Release from Pharmaceut-ical Solid Dispersions Prepared via Fused Deposition Modeling (FDM) 3D Printing. European Journal of Pharmaceutics and Biopharmaceutics, 108, 111-125.
https://doi.org/10.1016/j.ejpb.2016.08.016
[29] Shemelya, C., Rosa, A.D.L., Torrado, A.R., Yu, K., Domanowski, J., Bonacuse, P.J., Martin, R.E., Juhasz, M., Hurwiftz, F., Wicker, R.B., Conner, B., MacDonald, E. and Roberson, D.A. (2017) Anisotropy of Thermal Conductivity in 3D Printed Polymer Matrix Composites for Space Based Cube Satellites. Additive Manufacturing, 16, 186-196.https://doi.org/10.1016/j.addma.2017.05.012
[30] Huang, B. and Singamneni, S. (2014) Raster Angle Mechanics in Fused Deposition Modelling. Journal of Composite Materials, 49, 363-383.
https://doi.org/10.1177/0021998313519153
[31] Alaimo, G., Marconi, S., Costato, L. and Auricchi, F. (2017) Influence of Me-so-Structure and Chemical Composition on FDM 3-D Printed Parts. Composites Part B: Engineering, 113, 371-380.
https://doi.org/10.1016/j.compositesb.2017.01.019
[32] Owolabi, G., Peterson, A., Habtour, E., Riddict, J., Coalney, M., Olasumboye, A. and Boiling, D. (2016) Dynamic Response of Acrylonitrile Butadiene Styrene under Im-pact Loading. International Journal of Mechanical and Materials Engineering, 11, 1-8.https://doi.org/10.1186/s40712-016-0056-0
[33] Du, J., Wei, Z., Wang, X., Wang, J. and Chen, Z. (2016) An Improved Fused Depo-sition Modeling Process for Forming Large Size Thin Walled Parts. Journal of Ma-terials Processing Technology, 234, 332-341.
https://doi.org/10.1016/j.jmatprotec.2016.04.005
[34] Alafaghani, A., Qattawi, A., Alrawi, B. and Guzman, A. (2017) Experimental Opti-mization of Fused Deposition Modelling Processing Parameters: Design for Manu-facturing Approach. Procedia Manufacturing, 10, 791-803.
https://doi.org/10.1016/j.promfg.2017.07.079
DOI: 10.4236/ojopm.2019.91001 26 Open Journal of Organic Polymer Materials Inferred to 3D-Printed Polymers Using Fused Deposition Modelling and Subject to Severe Compressions. European Polymer Journal, 85, 324-340.
https://doi.org/10.1016/j.eurpolymj.2016.10.030
[36] Griffiths, C.A., Howarth, J., Rowbotham, G.D. and Rees, A. (2016) Effect of Build Parameters on Processing Efficiency and Material Performance in Fused Deposition Modelling. Procedia CIRP, 49, 28-32.https://doi.org/10.1016/j.procir.2015.07.024
[37] Srivastava, M., Macheshwari, S., Kundra, T.K. and Rathee, S. (2017) Multi-Response Optimization of Fused Deposition Modelling Process Parameters of ABS Using Re-sponse Surface Methodology (RSM)-Based Desirability. Materials Today: Proceed-ings, 4, 1972-1977.https://doi.org/10.1016/j.matpr.2017.02.043
[38] Anitha, R., Arunachalam, S. and Radhakrishman, P. (2001) Critical Parameters In-fluencing the Quality of Prototypes in Fused Deposition Modelling. Journal of Ma-terials Processing Technology, 118, 385-388.
https://doi.org/10.1016/S0924-0136(01)00980-3
[39] Novakova-Marcincinova, L. and Novak-Marcincin, J. (2012) Testing of Materials for Prototyping Fused Deposition Modelling Technology. International Journal of Industrial and Manufacturing Engineering, 6, 2082-2085.
[40] Arsat, A.N.B. (2015) Study on the Properties of Parts Manufacture Using Fused Deposition Modelling (FDM). Bachelor of Mechanical Engineering Thesis, Faculty of Mechanical Engineering, Universiti Technikal, Malaysia Melaka, 1-24.
[41] Wu, W., Geng, P., Li, G., Zhao, D., Zhang, H. and Zhao, J. (2015) Influence of Layer Thickness and Raster Angle on the Mechanical Properties of 3D-Printed and PEEK and a Comparative Mechanical Study between PEEK and ABS Materials. Materials, 8, 5834-5846.https://doi.org/10.3390/ma8095271
[42] Luzamin, O., Mourin, D. and Plancak, M. (2014) Effect of Layer Thickness, Deposi-tion Angle and Infill on Maximum Flexural Force in FDM-Built Specimens. Journal for Technology of Plasticity, 39, 50-59.
[43] Gardan, J., Makke, A. and Recho, N. (2016) A Method to Improve the Fracture Toughness Using 3D Printing Extrusion Deposition. Procedia Structural Integrity, 2, 144-151.https://doi.org/10.1016/j.prostr.2016.06.019
[44] Fischer, M. and Schoppner, V. (2017) Fatigue Behaviour of FDM Parts Manufac-tured with Ultem 9085. Journal of the Minerals, Metals, and Materials Society, 69, 563-568.https://doi.org/10.1007/s11837-016-2197-2
[45] Kay, R.N. (2014) Effect of Raster Orientation on the Structural Properties of Com-ponents Fabricated by Fused Deposition Modelling. Master of Science, Thesis in Mechanical Engineering, Ohio State University, Columbus, 1-145.
[46] Roberson, R.A., Angel, R., Perez, T., Shemelya, C.M., Rivera, A., MacDonald, E. and Wicker, R.B. (2015) Comparison of Stress Concentrator Fabrication for 3D Printed Polymeric Izod Impact Test Specimens. Additive Manufacturing, 7, 1-11.
https://doi.org/10.1016/j.addma.2015.05.002
[47] Patel, R., Shah, H.N. and Kumari, S.V. (2015) Experimental Investigation of Frac-ture of ABS Material by ASTM-5045 for Different Crack Length and Layer of Orientation Using FDM Process. International Journal of Mechanical and Industrial Technology, 3, 77-83.
[48] Riddick, J.C., Haile, M., Wahlde, R.V., Cole, D.P., Bamiduro, O. and Johnson, T.E. (2016) Fractographic Analysis of Tensile Failure of Acryonitrile Butadiene Styrene Fabricated by Fused Deposition Modeling. Additive Manufacturing, 11, 49-59.
https://doi.org/10.1016/j.addma.2016.03.007
DOI: 10.4236/ojopm.2019.91001 27 Open Journal of Organic Polymer Materials Anisotropic Elasticity and Yielding of 3D Printed Material. Composites Part B: En-gineering, 99, 506-513.https://doi.org/10.1016/j.compositesb.2016.06.009
[50] Rankouhi, B., Javadpour, S. and Delfanian, F. (2016) Failure Analysis and Mechan-ical Characterization of 3D Printed ABS with Respect to Layer Thickness and Orientation. Journal of Failure Analysis and Prevention, 16, 467-481.
https://doi.org/10.1007/s11668-016-0113-2
[51] Mishra, S.B. (2016) A Study on Parametric Appraisal of Fused Deposition Model-ling. PhD Thesis, National Institute of Technology, Rourkela, 1-126.
[52] Dawoud, M., Taha, I. and Ebeid, S.J. (2016) Mechanical Behavior of ABS: An Expe-rimental Study using FDM and Injection Moulding Techniques. Journal of Manu-facturing Processes, 21, 39-45. https://doi.org/10.1016/j.jmapro.2015.11.002
[53] Turk, D., Brenni, F., Zogg, M. and Meboldt, M. (2017) Mechanical Characterization of 3D Printed Polymers Processing. Materials & Design, 118, 256-265.
https://doi.org/10.1016/j.matdes.2017.01.050
[54] Aliheidari, N., Tripuraneni, R., Ameli, A. and Nadimpalli, S. (2017) Fracture Resis-tance Measurement of Fused Deposition Modeling 3D Printed Polymer. Polymer Testing, 60, 94-101. https://doi.org/10.1016/j.polymertesting.2017.03.016
[55] Faes, M., Ferrans, E. and Moens, D. (2016) Influence of Interlayer Cooling Time on the Quasi-Static Properties of ABS Components Produced via Fused Deposition Modelling. Procedia CIRP, 42, 748-753.https://doi.org/10.1016/j.procir.2016.02.313
![Figure 15. Stress Strain Curves for [0˚/90˚] Raster Angle Specimens at 0.5 cm/min.](https://thumb-us.123doks.com/thumbv2/123dok_us/9213867.408408/17.595.229.516.350.541/figure-stress-strain-curves-raster-angle-specimens-min.webp)
