Debugger
Because of last-minute changes to CodeWarrior, some of the information in this manual may be inaccurate. Please read the Release Notes on the CodeWarrior
Otherwise, no part of this documentation may be reproduced or transmitted in any form by any means, electronic or mechanical, including photocopying, recording, or by any information storage and retrieval system, without permission in writing from Metrowerks, Inc.
Metrowerks, the Metrowerks logo, and CodeWarrior are registered trademarks of Metrowerks, Inc.
All other trademarks belong to their respective owners.
How to Contact Metrowerks:
U.S.A. Metrowerks Corporation 9801 Metric Blvd., Suite #100 Austin, TX 78758 - U.S.A. Europe Metrowerks Europe
Riehenring 175 - CH-4058 Basel (Switzerland)
ASIA/PACIFIC Metrowerks Japan - Shibuya Mitsuba Building 5F - Udagawa-cho 20-11, Shibuya-ku - Tokyo 150-0042 Japan
World Wide Web http://www.metrowerks.com
Registration Information http://www.metrowerks.com/register mailto:[email protected]
Desktop Technical Support http://www.metrowerks.com/support/desktop/ mailto:[email protected]
Embedded Technical Support http://www.metrowerks.com/support/embedded/ U.S.A: mailto:[email protected] Europe: mailto:[email protected] Asia/Pac mailto:[email protected]
Sales, Marketing, & Licensing mailto:[email protected]
Table of Contents
1 Important Notice
17
Copyrights . . . 17
Trademarks . . . 17
Warranty . . . 18
2 Overview
19
About This Guide . . . 19Highlights . . . 20
Read the Release Notes . . . 20
Document Conventions . . . 20
3 Introduction
23
What Is the Simulator/Debugger? . . . 23What Is a Simulator/Debugger Application? . . . 24
What Is a Simulator/Debugger Execution Framework? . . . 25
Understanding the Simulator/Debugger Concept . . . 26
The Simulator/Debugger Execution Framework . . . 26
Objects and Services . . . 27
Framework Components . . . 27
Demo Version Limitations Components . . . 28
4 Simulator/Debugger User Interface
29
Introduction. . . 29Application Programs . . . 30
Start the Debugger . . . 30
Start the debugger from the IDE . . . 30
Starting the Debugger from a Command Line . . . 31
Simulator/Debugger Main Menu Bar . . . 33
Simulator/DebuggerSimulator/Debugger Toolbar . . . 33
Simulator/Debugger Status Bar . . . 34
Object Info Bar of the Simulator/Debugger Components . . . 34
View Menu . . . 39
Run Menu . . . 42
Target Menu . . . 45
Simulator Menu . . . 48
Component Menu . . . 56
Window Menu . . . 57
Help Menu . . . 58
Component Associated Menus . . . 61
Component Main Menu . . . 61
Component Popup Menu . . . 61
Highlights of the User Interface . . . 62
Smart User Interface: Activating Services with Drag and Drop . . . 62
To Drag and Drop an Object . . . 64
Drag and Drop Combinations . . . 65
Selection Dialog Box . . . 69
5 Framework Components
71
Component Introduction . . . 71CPU component . . . 71
Window components. . . 71
Target components . . . 72
Components Window . . . 72
General Component . . . 73
Adc_Dac component. . . 74
Assembly Component . . . 80
Command Line Component . . . 86
Coverage Component . . . 91
DAC Component . . . 96
Data Component . . . 98
Memory Component . . . . 111
IT_Keyboard . . . . 122
Keyboard . . . . 126
LCD Display Component . . . . 130
Monitor components . . . . 137
Push Buttons components . . . . 141
MicroC Component . . . . 144
Procedure Component . . . . 151
Profiler Component . . . . 154
Programmable IO_Ports . . . . 159
Recorder Component . . . . 162
Register Component . . . . 166
Seven segments display component . . . . 171
SoftTrace Component . . . . 175
Source Component . . . . 178
Stimulation Component . . . . 192
TestTerm Component . . . . 195
Terminal Component . . . . 201
Wagon Component . . . . 205
Visualization Utilities . . . . 208
Analog Meter Component . . . . 209
Inspector Component . . . . 211
IO LED Component . . . . 220
LED Component . . . . 222
The Phone Component . . . . 224
VisualizationTool . . . . 227
6 Control Points
244
Control points introduction . . . . 244Breakpoints setting dialog . . . . 246
Breakpoint Symbols . . . . 246
Description of the Dialog . . . . 247
Multiple selections in the dialog . . . . 248
Checking condition in dialog . . . . 248
Saving Breakpoints . . . . 249
Define Breakpoints . . . . 251
Identify all Positions Where a Breakpoint Can Be Defined . . . . 251
Define a Temporary Breakpoint . . . . 252
Define a Permanent Breakpoint . . . . 253
Define a Counting Breakpoint . . . . 253
Define a Conditional Breakpoint . . . . 255
Delete a Breakpoint . . . . 256
Description of the Dialog . . . . 259
Multiple selections in the dialog . . . . 260
Checking condition in the dialog . . . . 261
General Rules for Halting on a Control Point. . . . 261
Define Watchpoints. . . . 262
Defining a Read Watchpoint . . . . 262
Defining a Write Watchpoint . . . . 263
Defining a Read/Write Watchpoint . . . . 264
Defining a Counting Watchpoint . . . . 264
Defining a Conditional Watchpoint . . . . 265
Deleting a Watchpoint . . . . 267
Associate a Command with a Watchpoint . . . . 268
7 Debugger Commands
269
Simulator/Debugger Commands. . . . 269List of Available Commands . . . . 270
Definitions of Terms Commonly Used in Command Syntaxes . . . . . 280
A . . . . 282
ACTIVATE . . . . 283
ADDCHANNEL . . . . 283
ADCPORT . . . . 284
ADDXPR . . . . 284
ATTRIBUTES . . . . 284
AT . . . . 296
AUTOSIZE . . . . 297
BASE . . . . 297
BC . . . . 298
BCKCOLOR. . . . 299
BD . . . . 300
BS . . . . 300
CALL . . . . 303
CD . . . . 303
CF . . . . 304
CLOCK . . . . 307
CLOSE . . . . 307
COPYMEM . . . . 307
CPORT . . . . 308
CR . . . . 309
CYCLE . . . . 309
DASM . . . . 310
DB . . . . 311
DDEPROTOCOL . . . . 312
DEFINE . . . . 313
DELCHANNEL . . . . 314
DETAILS . . . . 315
DL . . . . 315
DUMP . . . . 316
DW . . . . 316
E . . . . 317
ELSE . . . . 318
ELSEIF . . . . 318
ENDFOCUS . . . . 319
ENDFOR . . . . 319
ENDIF . . . . 320
ENDWHILE . . . . 320
EXECUTE . . . . 321
EXIT . . . . 321
FILL . . . . 321
FILTER . . . . 322
FIND . . . . 322
FINDPROC . . . . 323
FOCUS . . . . 323
FOLD . . . . 324
FONT . . . . 325
FOR . . . . 325
FPRINTF . . . . 326
FRAMES . . . . 326
G . . . . 327
GO. . . . 327
GOTO . . . . 328
IF . . . . 330
INSPECTOROUTPUT . . . . 331
INSPECTORUPDATE . . . . 331
ITPORT. . . . 332
ITVECT . . . . 332
KPORT . . . . 333
LCDPORT . . . . 333
LINKADDR . . . . 334
LF . . . . 334
LOAD . . . . 335
LOADCODE . . . . 337
LOADMEM . . . . 337
LOADSYMBOLS . . . . 338
LOG . . . . 338
LS . . . . 342
MEM . . . . 343
MS. . . . 344
NB . . . . 345
NOCR . . . . 347
NOLF . . . . 347
OPEN . . . . 347
OPENFILE . . . . 348
OPENIO . . . . 348
OUTPUT . . . . 349
P . . . . 349
PAUSETEST. . . . 351
PBPORT . . . . 351
PORT . . . . 352
PRINTF. . . . 352
PTRARRAY . . . . 352
RD . . . . 353
RECORD . . . . 354
REGBASE . . . . 354
REGFILE . . . . 355
REPEAT . . . . 355
RESET . . . . 355
RESETMEM. . . . 357
RESETRAM . . . . 358
RESETSTAT . . . . 358
RESTART . . . . 358
RETURN . . . . 359
RS . . . . 359
S . . . . 360
SAVE. . . . 361
SAVEBP . . . . 361
SEGPORT . . . . 362
SET . . . . 363
SETCOLORS . . . . 363
SETCONTROL . . . . 364
SETCPU . . . . 364
SHOWCYCLES . . . . 365
SLAY . . . . 366
SLINE . . . . 366
SMEM . . . . 367
SMOD . . . . 367
SPC . . . . 368
SPROC . . . . 369
SREC . . . . 369
STEPINTO . . . . 370
STEPOUT . . . . 371
STEPOVER . . . . 371
STOP. . . . 372
T . . . . 373
TESTBOX . . . . 373
TUPDATE. . . . 374
UNDEF . . . . 374
UNFOLD . . . . 377
UNTIL . . . . 377
UPDATERATE . . . . 378
VER . . . . 378
WL . . . . 381
WPORT. . . . 382
WW . . . . 382
ZOOM . . . . 383
8 True Time I/O Stimulation
384
Stimulation Program examples . . . . 384Running an Example Program Without Stimulation . . . . 384
Example Program with Periodical Stimulation of a Variable . . . . 387
Example Program with Stimulated Interrupt . . . . 388
Example of a Larger Stimulation File . . . . 390
Stimulation Input File Syntax . . . . 393
9 Real Time Kernel Awareness
396
Real Time Kernel Awareness Introduction . . . . 396Inspecting the state of a task . . . . 397
Task description language . . . . 398
Example of application . . . . 400
Inspecting data structures of the Kernel . . . . 401
Register assignments for the RTK awareness. . . . 402
OSEK Kernel Awareness . . . . 402
OSEK ORTI . . . . 403
OSEK RTK Inspector component. . . . 405
10 Environment
412
Debugger environment . . . . 412The Current Directory . . . . 413
Global Initialization File (MCUTOOLS.INI) (PC only) . . . . 414
Local Configuration File (usually project.ini) . . . . 415
Configuration of the Default Layout for the Simulator/Debugger: the PROJECT.INI File . . . . 416
Paths . . . . 420
Environment Variable Details . . . . 422
ABSPATH . . . . 423
ABSPATH: Absolute Path . . . . 423
DEFAULTDIR . . . . 424
DEFAULTDIR: Default Current Directory . . . . 424
ENVIRONMENT . . . . 425
GENPATH . . . . 426
GENPATH: #include “File” Path . . . . 426
LIBRARYPATH . . . . 427
LIBRARYPATH: ‘include <File>’ Path . . . . 427
OBJPATH . . . . 428
OBJPATH: Object File Path . . . . 428
TMP . . . . 429
TMP: Temporary directory . . . . 429
USELIBPATH. . . . 430
USELIBPATH: Using LIBPATH Environment Variable . . . . 430
Searching order for sources files . . . . 431
Searching Order in the Simulator/Debugger for C source files (*.c, *.cpp). 431 Searching Order in the Simulator/Debugger for Assembly source files (*.dbg) 431 Searching Order in the Simulator/Debugger for object files (HILOADER) 431 Files of the Simulator/Debugger. . . . 432
11 How To ...
435
How To Configure the Simulator/Debugger . . . . 435
How To Configure the Simulator/Debugger for Use from Desktop on Win 95, Win 98,Win NT4.0 or Win2000 . . . . 436
How To Start the Simulator/Debugger . . . . 436
How To Start the Simulator/Debugger from WinEdit . . . . 436
Automating startup of the Simulator/Debugger . . . . 437
How To Load an Application . . . . 439
How To Start an Application . . . . 440
How To Stop an Application . . . . 440
How To Step in the Application . . . . 441
How to step on Source Level . . . . 441
How to Step on Assembly Level . . . . 443
How To Work on Variables . . . . 443
How to Display Local Variable from a Function . . . . 444
How to Display Global Variable from a Module . . . . 444
How to Change the Format for the Display of Variable Value . . . . 445
How to Modify a Variable Value . . . . 446
How to Load an Address Register with the Address of a variable . . . . 447
How To Work on Register . . . . 448
How to Change the Format of the Register display . . . . 448
How to Modify a Register Content . . . . 448
How to Get a Memory Dump starting at the Address where a Register is pointing . . . . 450
How to Modify the content of a Memory Address . . . . 451
How to Consult Assembler Instructions Generated by a Source Statement . . 451 How To view Code . . . . 452
How to Communicate with the Application . . . . 453
About startup.cmd, reset.cmd, preload.cmd, postload.cmd . . . . 453
12 CodeWarrior Integration
455
Requirements . . . . 455Debugger Configuration . . . . 455
13 Debugger DDE capabilities
457
Debugger DDE Server . . . . 457DDE introduction . . . . 457
Debugger DDE implementation . . . . 457
14 Synchronized debugging through DA-C IDE
459
Requirements . . . . 459Configuring DA-C IDE for Metrowerks Tool Kit . . . . 459
Creating a new project . . . . 460
Configure the working directories . . . . 460
Debugger Interface . . . . 471
Principle of Communication between DA-C IDE and Simulator/Debugger 472 Synchronized debugging. . . . 477
Troubleshooting . . . . 477
15 Full Chip Simulation
505
Introduction. . . . 505Supported Derivatives. . . . 507
Communication Modules . . . . 514
BF (Byteflight) . . . . 514
BLCD (J1850 Bus) . . . . 514
MSCAN (Motorola Scalable CAN) . . . . 514
SCI (Serial Communication Interface) . . . . 514
SPI (Serial Peripheral Interface) . . . . 517
Converter Modules . . . . 517
ATD (Analog to Digital Converter) . . . . 517
Memory Modules . . . . 519
EETS (EEPROM) . . . . 519
FTS (Flash) . . . . 519
Misc. Modules . . . . 519
VREG (Voltage Regulator) . . . . 519
Port I/O Modules . . . . 520
MEBI (Multiplexed External Bus Interface) . . . . 520
PIM (Port Integration Module) . . . . 520
Timer Modules . . . . 520
CRG (Clock and Reset Generator) . . . . 520
ECT (Enhanced Capture Timer) . . . . 522
Not memory mapped registers . . . . 525
PWM (Pulse Width Modulator) . . . . 526
TIM (Timer Module) . . . . 528
16 Full Chip Simulation Tutorials
529
Guess the number . . . . 529Step 1 - Environment setup . . . . 529
Step 2 - Creating the project . . . . 529
Step 3 - ‘Target CPU’ window . . . . 531
Step 4 - ‘Bean Selector’ window . . . . 532
Step 5 - ‘Project Panel’ window . . . . 532
Step 6 - ‘Bean Inspector AS1:AsynchroSerial’ window . . . . 533
Step 7 - Generation of driver code . . . . 534
Step 8 - Verification of the files created . . . . 534
Step 9 - Entering the user code . . . . 535
Step 10 - Run . . . . 536
PWM Channel 0 . . . . 537
Step 1 - Environment setup . . . . 537
Step 2 - Creating the project . . . . 537
Step 3 - ‘Target CPU’ window . . . . 538
Step 6 - ‘Bean Inspector PWM8.PWM. . . . 539
Step 7 - Generation of driver code . . . . 539
Step 8 - Verification of the files created . . . . 539
Step 9 - Entering the user code . . . . 540
Step 10 - Run . . . . 540
17 Scripting
543
The Component Object Model Interface . . . . 543Parameters: . . . . 543
Return Values: . . . . 544
Manual Registration . . . . 544
Scripting Example . . . . 544
Remote Scripting another HI-WAVE . . . . 545
COM_START . . . . 545
COM_EXIT . . . . 545
COM_EXE . . . . 546
18 Appendix
547
Messages in Status Bar . . . . 547Status Messages . . . . 547
Stepping, Breakpoint and Watchpoints Messages . . . . 548
CPU Specific Messages . . . . 549
Target Specific Messages . . . . 550
More Simulator Peculiar Messages: Memory Access Messages . . . . . 551
EBNF Notation . . . . 552
Introduction to EBNF . . . . 552
“Expression” Definition in EBNF . . . . 554
Constant Standard Notation . . . . 557
Register Description File . . . . 558
OSEK ORTI File Sample . . . . 561
Bug Reports . . . . 568
Technical Support . . . . 571
E-mail . . . . 571
FAX . . . . 571
Support by MAIL . . . . 571
Internet . . . . 572
1
Important Notice
This chapter provides information about Copyright, Trademarks and warranty.
Click any of the following links to jump to the corresponding section of this chapter:
• Copyrights • Trademarks • Warranty
Copyrights
Metrowerks CodeWarrior copyright ©1993–2003 by Metrowerks, Inc. and its licensors.
All rights reserved.
Documentation stored on the compact disk(s) may be printed by licensee for personal use. Except for the foregoing, no part of this documentation may be reproduced or transmitted in any form by any means, electronic or mechanical, including photocopying, recording, or any information storage and retrieval system, without permission in writing from Metrowerks, Inc.
Trademarks
ALL SOFTWARE AND DOCUMENTATION ON THE COMPACT DISK(S) ARE SUBJECT TO THE LICENSE AGREEMENT.
Warranty
While every effort has been made to ensure the accuracy of all information in this document, Metrowerks assumes no liability to any party for any loss or damage caused by errors or omissions or by statements of any kind in the Simulator/Debugger user’s guide, its updates, supplements, or special editions, whether such errors are omissions or statements resulting from negligence, accident, or any other cause. Metrowerks further assumes no liability arising out of the application or use of any product or system described here; nor any liability for incidental or consequential damages arising from the use of this document and the related product.
Metrowerks disclaims all warranties regarding the information contained herein, whether expressed, implied or statutory, including implied
warranties of merchantability or fitness for a particular purpose.
2
Overview
This chapter provides an overview of the structure from the debugger documentation.
About This Guide
This document includes information to become familiar with the
Simulator/Debugger, to use all functions and help you understand how to use this environment. This document is divided into the following chapters:
• TheIntroduction chapter introduces the Simulator/Debugger concept. • The Simulator/Debugger User Interface chapter provides all details
about the Simulator/Debugger user interface environment i.e., menus, toolbars, status bars and drag and drop facilities.
• The Framework Components chapter contains descriptions of each basic component and visualization utility.
• The Debugger Commands chapter describes and provides examples of all Commands line Commands.
• The True Time I/O Stimulation chapter explains the principle and provides examples on the Stimulation component.
• The Real Time Kernel Awareness chapter contains descriptions of the Real Time concept and related applications.
• The Environment chapter contains information for defining the application environment.
• The Control Points chapter is dedicated to the control points and associated dialogs.
• The How To ... chapter provides answers for common questions and describes how to use advanced features of the Simulator/Debugger. • The CodeWarrior Integration chapter explains how to configure the
Simulator/Debugger for use with CodeWarrior.
• The Appendix contains information about all the Simulator/Debugger messages, the EBNF notation and how to get Technical Support. • The “Index” contains all keywords for the Simulator/Debugger.
Highlights
• True 32-bit application
• Powerful features for embedded debugging
• Special features for real time embedded debugging • Powerful features for True Time Simulation • Various and Same look Target Interfaces • User Interface
• Versatile and intuitive drag and drop functions between components • Folding and unfolding of objects like functions, structures, classes • Graphical editing of user defined objects
• Visualization functions
• Smart interactions with objects • Extensibility function
• Both Powerful Simulation & Debugger • Show Me How Tool
• GUI (graphical user interface) version including command line • Context sensitive help
• Configurable GUI with Tool Bar
• Smooth integration into third party tools
• Supports HIWARE and ELF/Dwarf Object File Format and Motorola S-Records
Read the Release Notes
Before you use a tool such as the Debugger, read the release notes. They contain important last-minute information about new features and technical issues or incompatibilities that may not be included in the documentation.
Document Conventions
General terms
• Choose.
This term is used to select an item from a menu or a list/combo box.
• Check.
This term is used to select a check box item.
• Uncheck.
This term is used to deselect a selected check box item.
All keyboard keys are given as , , , , ,
etc.
Also the left mouse button is and considered as a key.
• Key1 + Key2.
When you have to press two keys at the same time. The “+ “ sign means that Key1 is held down while Key2 is pressed. Example: +
, + .
Mouse operations
• Click
The word “click” means click the left mouse button once.
• Right-click
This “click” operation is done with the right mouse button.
• Double-click
This is a double “click” operation.
• + Key, example: + .
This means that you press and hold down the left mouse button while you drag the mouse. If you perform this operation on an object that has been designed to be dragged, this object will move with the mouse arrow and drop when you unclick the mouse.
• Unclick.
When you release the left mouse button after a drag operation or when you have completed a “ + Key” operation.
Font styles
• Bold
Words in bold are menu items and entries.
• Courier
This font is used for filenames and pathnames, commands, command syntaxes and examples.
Examples
C:\HIWAVE\PROJECT.INI
in>Memory < ADR on
Menu Paths
When asked to follow specific selections/entries in menus and submenus, the following selections are given in a list of items separated by the “>” separator. Example: Choose Window > Options > Autosize. Here you click Window in the Simulator/Debugger main menu bar, drag the mouse to the Options submenu then check or uncheck Autosize.
Others
3
Introduction
This chapter is an introduction to the Simulator/Debugger from Metrowerks used in 8/16 bit embedded applications.
Click any of the following links to jump to the corresponding section of this chapter:
• What Is the Simulator/Debugger?
• What Is a Simulator/Debugger Application?
• What Is a Simulator/Debugger Execution Framework? • Understanding the Simulator/Debugger Concept
What Is the Simulator/Debugger?
The Simulator/Debugger is a member of the tool family for Embedded Development. It is a Multipurpose Tool that you can use for various tasks in the embedded system and industrial control world. Some typical tasks are:
• Simulation and debugging of an embedded application.
• Simulation and debugging of real time embedded applications. • Simulation and/or cross-debugging of an embedded application. • Multi-Language Debugging: Assembly, C and C++
• True Time Stimulation
• User Components creation with the Peripheral Builder
• Simulation of a hardware design (e.g., board, processor, I/O chip). • Building a target application using an object oriented approach.
What Is a Simulator/Debugger Application?
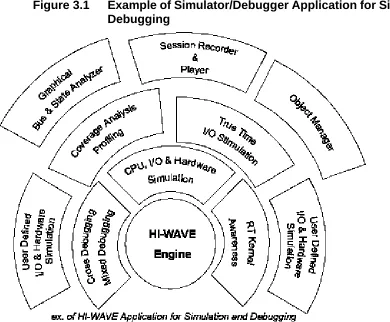
A Simulator/DebuggerSimulator/Debugger Application contains the Simulator/Debugger Engine and a set of debugger components bound to the task that they should perform (for example a simulation and debugging session). The Simulator/Debugger Engine is the heart of the system. It monitors and coordinates the tasks of the components. Each Simulator/ Debugger Component has its own functionality (e.g., source level debugging, profiling, I/O stimulation).
You can adapt your Simulator/Debugger application to your specific needs. Integrating or removing the Simulator/Debugger Components is very easy. You can also choose a default configuration, refer to Figure 3.1.
You can add additional Simulator/Debugger Components (for example, for simulation of a specific I/O peripheral chip) and integrate them with your Simulator/Debugger Application.
Figure 3.1 Example of Simulator/Debugger Application for Simulation and Debugging
What Is a Simulator/Debugger Execution
Framework?
Since the Simulator/Debugger is a Multipurpose Tool you have to use the components according to the task you want to run. In other words, you either build a Simulator/Debugger Execution Framework or use a default one.
Understanding the Simulator/Debugger Concept
This section provides an overview of the Simulator/Debugger concept.
The Simulator/Debugger Execution Framework
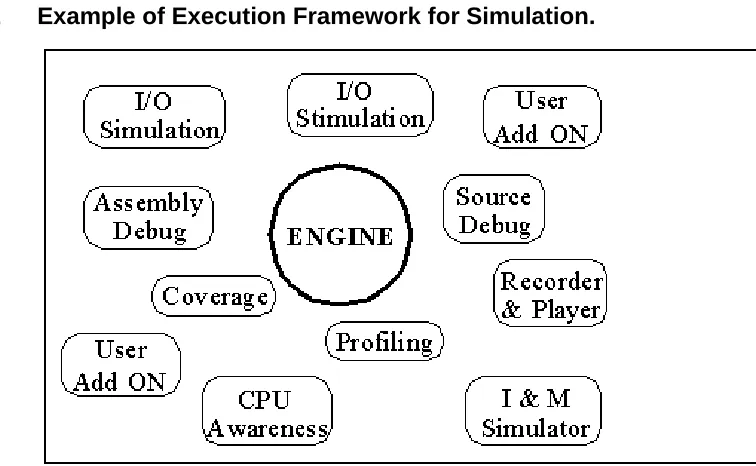
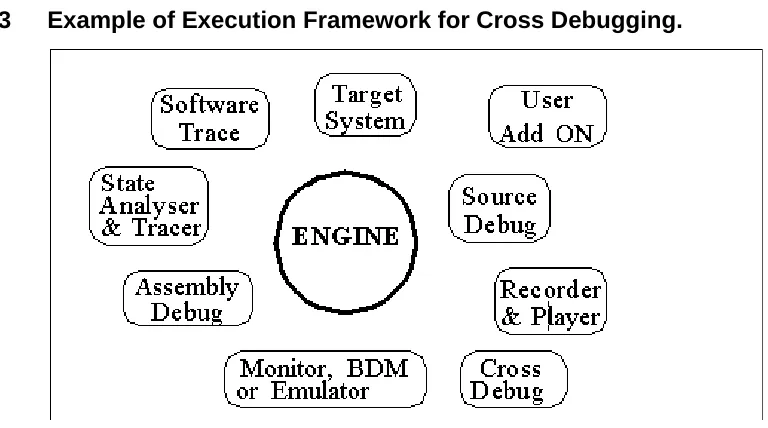
[image:26.595.135.513.298.531.2]Any Simulator/Debugger based task you create (for example: testing and debugging a target application, running a visualization application), has a specific debugger “Execution Framework”. A Simulator/Debugger Execution Framework is a set of user selected and configured Framework Components, such as shown in Figure 3.2 and Figure 3.3. The debugger engine is always present.
Figure 3.3 Example of Execution Framework for Cross Debugging.
Objects and Services
An object provides one or more services. For example an object of a variable type holds values in a specific range. An object like the Bus Analyzer component graphically displays the bus state. An I/O Simulation object provides the behavior of the corresponding hardware peripheral. Providing services is the ultimate goal of objects and that is why they are created and used. An object has a state, behavior and identity.
Framework Components
A Simulator/Debugger Framework Component is an object that you can integrate or remove from an Execution Framework. Each Framework component belongs to a service class.
Examples of Framework Components:
• Simulator/Debugger Engine • CPU Simulator
• Source Level Debug Component • Assembly Debug Component • Profiler
If any hardware component is present (e.g., target board, I/O peripheral, emulators), it is also considered to be a Framework component.
Demo Version Limitations Components
4
Simulator/Debugger User
Interface
This chapter describes the Simulator/Debugger User Interface.
Click any of the following links to jump to the corresponding section of this chapter:
• Introduction
• Application Programs • Start the Debugger
• Simulator/Debugger Main Menu Bar • Simulator/Debugger Status Bar • Simulator/Debugger Status Bar
• Object Info Bar of the Simulator/Debugger Components • Function of the Main Menu Bar
• Component Associated Menus • Highlights of the User Interface
Introduction
The Simulator/Debugger main window acts as a container for windows of all other components. Additionally, it provides a global menu bar, a tool bar, a status bar for status information, and object information bars for several components.
• Auto tiled, component windows are automatically resized when the main window is resized
• Overlapped
• Icon (windows that are currently minimized).
Application Programs
After installation, all executable programs are placed in the `prog'
subdirectory, e.g. if you installed the software in `C:\Metrowerks' on a PC, all program files are located in C:\Metrowerks\PROG (for details refer to installation guide).
The following list provides an overview of the files used for C/C++ debugging.
hiwave.exe Debugger executable file
hibase.dll Debugger main function dll
elfload.dll Debugger loader dll
*.wnd Debugger component
*.tgt Debugger target file
*.cpu Debugger CPU awareness file
Start the Debugger
This section explains how to start the debugger from the IDE or a command line.
Start the debugger from the IDE
Figure 4.1 IDE Debug button.
Starting the Debugger from a Command Line
You can start the HI-WAVE debugger from a (DOS) command line. The command syntax is shown below:
HIWAVE.EXE [<AbsFileName> {-<options>}]
where AbsFileName is the name of the application to load in the debugger. Options may be introduced by a minus character.
Options are:
• -T=<time>: test mode. The debugger will terminate after the specified time (in seconds). The default value is 300 seconds, e.g:
c:\Metrowerks\prog\hiwave.exe -T=10
The debugger will terminate after 10 seconds.
• -Target=<targetname> sets the specified target, e.g.:
C:\Metrowerks\prog\hiwave.exe
c:\Metrowerks\demo\hc12\sim\fibo.abs -w -Target=sim
Starts the debugger, sets the simulator target, and loads fibo.abs file.
• W: wait mode will wait even when a <exeName> is specified, e.g. -W
• -Instance=%currentTargetName: defines a build instance name. When a build instance is defined, the same one will be used e.g.
c:\Metrowerks\prog\hiwave.exe -Instance=%currentTargetName
• -Prod: specifies the project directory and/or project file to be used at start-up: -Prod = <fileName> e.g.
c:\Metrowerks\prog\hiwave.exe -Prod=c:\demoproject\test.pjt
• -Nodefaults: will not load the default layout (see section 4 of the Project file Activation) e.g.
c:\Metrowerks\prog\hiwave.exe -nodefaults
• -Cmd specifies a command to be executed at start-up: -cmd = '"' {characters} e.g.
c:\Metrowerks\prog\hiwave.exe -cmd="open recorder"
• -C: specifies a command file to be executed at start-up: -c <cmdFile> e.g.
c:\Metrowerks\prog\hiwave.exe -c c:\temp\mycommandfile.txt
• -ENVpath: "-Env" <Environment Variable> "=" <Variable Setting>, this option sets an environment variable. This environment variable may be used to overwrite system environment variables e.g.
c:\Metrowerks\prog\hiwave.exe -EnvOBJPATH=c:\sources\obj
NOTE Options are not case sensitive.
Order of commands
Commands specified by options are executed in the following order:
1. Load (activate) the project file (see below). If the project file is not specified, “project.ini”is used by default.
2. Load <exeFile> if available and start* running unless option |(W) was specified
3. Execute command file <cmdFile> if specified
4. Execute command if specified
NOTE * In version 6.0 of the debugger, the loaded program is started after all command and command files are executed.
WARNING! The function Open in the File menu will interpret any file without an .ini extension as a command file and not a project file.
Example
C:\Metrowerks\PROG \DEMO\TEST.ABS -w -d
Simulator/Debugger Main Menu Bar
This Menu Bar, shown in Figure 4.2 is associated with the main function of the debugger application, target, and selected windows.
Figure 4.2 Debugger Main Menu Bar
NOTE You can select menu commands by pressing the ALT key to select the menu bar and press the key corresponding to the underlined letter in the menu command.
Simulator/DebuggerSimulator/Debugger Toolbar
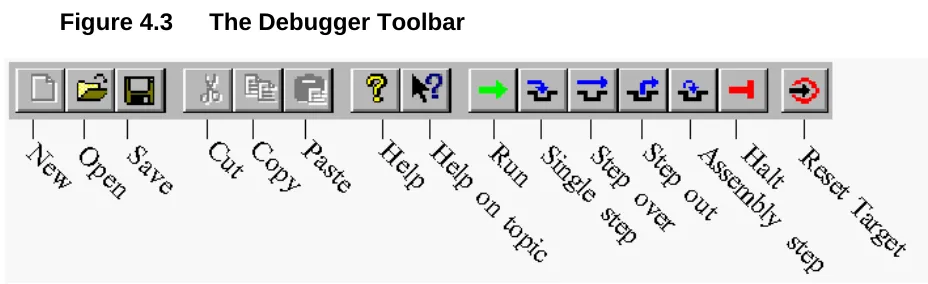
This toolbar is the default toolbar. Most menu commands have a related shortcut icon on the debugger toolbar.
Figure 4.3 The Debugger Toolbar
A tool tip is available when you point the mouse at an icon.
Simulator/Debugger Status Bar
The status bar at the bottom of the debugger window, shown in Figure 4.4 contains a context sensitive help line for target specific information, e.g., number of CPU cycles for the Simulator target and execution status. All messages that appear in the status bar are described in Messages in Status Bar.
Figure 4.4 The Debugger Status Bar
Object Info Bar of the Simulator/Debugger
Components
Figure 4.5 Object Info Bar of Debugger Window Components
Function of the Main Menu Bar
Table 4.7 describes menus entries available in the menu bar (Figure 4.6).
Figure 4.6 Debugger Main Menu
Table 4.1 Description of the Main Menu Entries
Menu entry Description
File Contains entries to manage debugger configuration files.
View Contains entries to configure the toolbar.
Run Contains entries to monitor a simulation or debug session.
Target Contains entries to select the debugger target.
Component Contains entries to select and configure extra component window
Data Contains entries to select Data component functions.
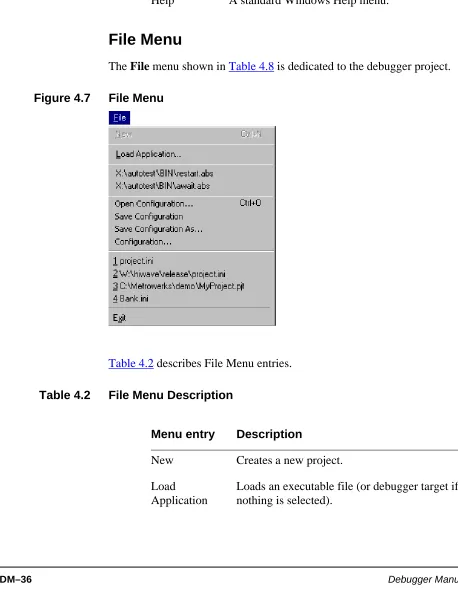
File Menu
[image:36.595.45.503.144.741.2]The File menu shown in Table 4.8 is dedicated to the debugger project.
Figure 4.7 File Menu
Table 4.2 describes File Menu entries.
Table 4.2 File Menu Description
Help A standard Windows Help menu.
Menu entry Description
Menu entry Description
New Creates a new project.
Load Application
[image:36.595.150.321.234.476.2]You can shortcut some of these functions by clicking toolbar icons (refer to the Simulator/DebuggerSimulator/Debugger Toolbar section).
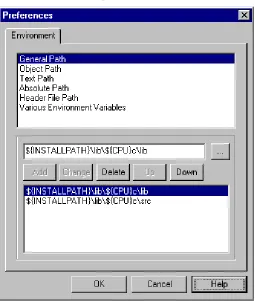
Preferences dialog
With this dialog (Figure 4.8) it is possible to set up environment variables for the current project. New variables will be saved in the current project
...\restart.abs ...\await.abs ...
Recent applications list
Open
Configuration
Opens the debugger project window. You can load a project file .PJT or .INI. Additionally you can load an existing .HWC file
corresponding to a debugger configuration file. You can load a project .INI file containing component names, associated window
positions and parameters, window parameters (fonts, background colors, etc.), target name e.g., Simulator and the .ABS application file to load.
Save
Configuration
Saves the project file
Save Project As Opens the debugger project window to save the project file under a different path and name, and format (PJT; INI...).
Configuration Opens the Preferences dialog to set environment variables for current project.
1.Project.ini 2.Test.ini 3...
Recent project file list
Exit Quits the Simulator/Debugger.
NOTE The corresponding menu entry (File>Configuration) is only enabled if a project file is loaded.
Figure 4.8 Preferences Dialog
The preference panel contains the following controls:
• A list box containing all environment variables, you can select a variable with the mouse or Up/Down buttons.
• Command Line Arguments: Command line options are displayed. You can add, delete, or modify options, and specify a directory with the browse button (...).
• A second list box containing all variables defined in the corresponding Environment section. Select a variable with the mouse or Up/Down buttons.
• OK: Changes are confirmed and saved in current project file. • Cancel: Closes dialog box without saving changes.
View Menu
In this menu (Figure 4.9) you can choose to show or hide the toolbar, status bar, window component titles and headlines (headlines are also called Object Info Bar of the Simulator/Debugger Components in this document). You can select smaller window borders and customize the toolbar. Table 4.3 describes the View Menu entries.
Figure 4.9 View Menu
Table 4.3 View Menu Description
Menu entry Description
Toolbar Check / uncheck Toolbar if you want to display or hide it.
Status Bar Check / uncheck Status Bar if you want to display or hide it.
Hide Tile Check / uncheck Hide Title if you want to hide or display the window title.
Hide Headline Check / uncheck Hide Headline if you want to hide or display the headline.
Small Borders. Check / uncheck Small Border if you want to display or hide small window borders.
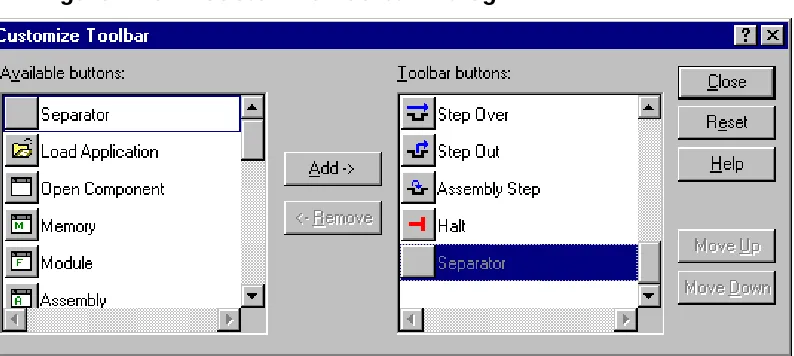
Customizing the Toolbar
[image:40.595.53.450.216.394.2]You can customize the toolbar of the Simulator/Debugger, adding and removing component shortcuts and action shortcuts. You can also insert separators to separate icons. Almost all functions in View, Run and Window menus are available as shortcut buttons, as shown in Figure 4.10.
Figure 4.10 Customize Toolbar Dialog
Select the desired shortcut button in the Available buttons list box and click Add to install it in the toolbar.
Select a button in the Toolbar buttons list box and click Remove to remove it from the toolbar.
Demo Version Limitations
The default toolbar cannot be configured.
Examples of view menu options
Figure 4.11 Typical component window display
Figure 4.12 shows a component window without a title and headline.
Figure 4.12 Component window without title and headline
Figure 4.13 Component window without title and headline, and with small border
Figure 4.14 shows a component window without headline and small border
Figure 4.14 Component window without headline and small border
Run Menu
Figure 4.15 Run Menu
Table 4.4 Run Menu Description .
Menu entry Description
Start/Continue Starts or continues execution of the loaded application from the current program counter (PC) until a breakpoint or watchpoint is reached, runtime error is detected, or user stops the
application by selecting Run -> Halt.
Shortcut:
Restart Starts execution of the loaded application from its entry point.
Shortcut: + +
Halt Interrupts and halts a running application. You can examine the state of each variable in the application, set breakpoints,
watchpoints, and inspect source code.
Single Step If the application is halted, this command performs a single step at the source level. Execution continues until the next source reference is reached. If the current statement is a procedure call, the debugger “steps into” that procedure. The Single Step command does not treat a function call as one statement, therefore it steps into the function.
Shortcut:
Step Over Similar to the Single Step command, but does not step into called functions. A function call is treated as one statement.
Shortcut:
Step Out If the application is halted inside of a function, this command continues execution and then stops at the instruction following the current function invocation. If no function calls are present, then the Step Out command is not performed.
Shortcut:
+
Assembly Step If the application is halted, this command performs a single step at the assembly level. Execution continues for one CPU
instruction from the point it was halted. This command is similar to the Single Step command, but executes one machine instruction rather than a high level language statement.
Shortcut:
+
Assembly Step Over Similar to the Step Over command, but steps over subroutine call instructions.
Shortcut:
+
You can provide shortcuts for some of these functions using the toolbar (refer to Simulator/DebuggerSimulator/Debugger Toolbar section and Customizing the Toolbar section).
You can set breakpoints and watchpoints in Source and Assembly component windows.
NOTE For more information about breakpoints and watchpoints, refer to the Control Points chapter.
Target Menu
This menu entry (Figure 4.16) appears between the Run and Component menus when no target is specified in the PROJECT.INI file and no target has been set. The Target name is replaced by an actual target name when the target is set. To set the target, select Component>Set Target... Refer to the Component Menu section.
Assembly Step Out If the application is halted inside a function, this command continues execution and stops on the CPU instruction following the current function invocation. This command is similar to the Step Out command, but stops before the assignment of the result from the function call.
Shortcut:
+
:+
Breakpoints... Opens the Breakpoints Setting dialog and displays the list of breakpoints defined in the application (refer to Control Points chapter).
Watchpoints... Opens the Watchpoints Setting dialog box and displays the list of watchpoints defined in the application (refer to Control Points chapter).
Figure 4.16 Target Menu
Table 4.5 describes the Target Menu entries.
Table 4.5 Target Menu Description
Loading a Target
Use the Target menu to load a debugger target.
1. Choose Target>Load...
The message shown in Figure 4.17 is displayed:
Figure 4.17 Load Target Dialog
At this point, the target is not set and you cannot load any application (.ABS) file.
2. Click Yes to install a target in the debugger.
The debugger searches for all targets installed. The dialog shown in Figure 4.18 is opened. Click Cancel to stop the process and skip target detection. Menu entry Description
Load Loads a Simulator/Debugger target.
Figure 4.18 Scan Target Dialog
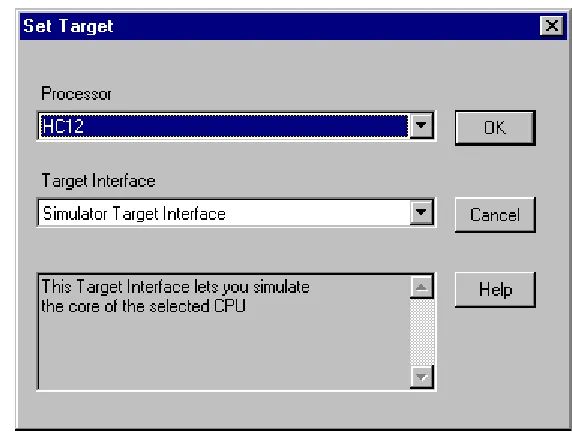
The Set Target dialog shown in Figure 4.19 is opened.
Figure 4.19 Set Target Dialog
3. Use the Processor list popup to select the desired processor.
4. Use the Target Interface list popup to select the desired target.
A text panel displays information about the selected Target.
WARNING! When a target can not be loaded, the combo box displays the path where you should install missing dll.
NOTE For more information about which target to load and how to set/reset a target, refer to the Simulator/Debugger target manuals e.g., “SIMULATOR Target, CPU Awareness & True-Time Simulation”.
Targets file
All targets are associated with a window file with .tgt extension.
Example: The Simulator Target
The default target of the Simulator/Debugger is the Simulator (in Configuration of the Default Layout for the Simulator/Debugger: the PROJECT.INI File: TARGET=SIM). However, choose Component>Set Target... if you want to open the dialog to set a different target.
Simulator Menu
This menu, shown in Figure 4.20 is associated with the simulator target, and allows you to load an application in the Simulator/Debugger. Table 4.6 describes the Simulator menu entries.
Figure 4.20 Simulator Menu
Table 4.6 Simulator Menu Description
Menu entry Description
Simulators File
The simulator is associated with a window with a .sim extension.
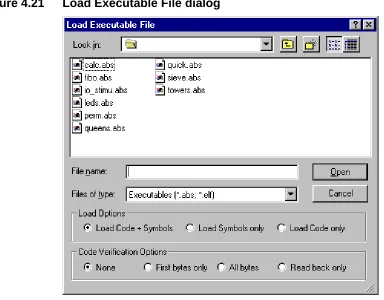
Load Executable File dialog
Choose Simulator>Load... to open the Load Executable File window, shown in Figure 4.21, then set the load options and choose a Simulation Execution Framework (a .ABS application file).
Reset Resets the simulator target.
Configure Opens the Memory Configuration Window.
Reset Ram Resets the RAM to `undefined'
Reset Mem Resets all configured memory to `undefined'
Reset Statistic Resets the statistical data
Load I/Os Opens I/O components
Close I/Os Closes I/O components
Command Files Opens the Command File Dialog
Figure 4.21 Load Executable File dialog
Description of the Load Options.
These three Radio buttons allow you to select which part of the executable file will be loaded:
• Load Code + Symbols. This will load the application code followed by the debug information (symbols) to allow debugging of the application. • Load Symbols only. If this option is selected, only debugging
information is loaded. This can be used if the code is already loaded into the target system or programmed into a non-volatile memory device (ROM/FLASH).
• Load Code only. Only the application code will be loaded into the target system. This option can be used if no debugging is needed.
Description of the Code Verifications Options.
These four Radio buttons allow you to choose between four levels of code verification.
• First bytes. The loader reads back a maximum of the first four bytes of a block that have been written to memory. This option is not as secure as the next option but is faster.
• All bytes. The loader reads back all bytes of a block that have just been written to memory. File loading is almost twice as long. However, verification is done on the whole file.
• Read back only. With this option the loader does not load data to memory. However, it reads back the current data matching the same areas from the target memory and compares all data with the data from the selected file.
NOTE If "Load Symbols only" is selected, verification radio buttons are grayed and NO verification is performed.
TIP If verification fails, a message is displayed, giving the address where a difference occurred.
For more details on the Simulator functions, consult the True Time Simulator Manual.
Dialog Load I/Os
This dialog box, shown in Figure 4.22 allows you to open an I/O device (peripheral) simulation. The Browse button allows you to specify a location for the I/O.
NOTE I/O simulation components are either designed by Metrowerks and delivered with the tool-kit installation or designed by the user with the Peripheral Builder.
Target Interface Command File Dialog
Each page of this property sheet dialog, shown in Figure 4.23 corresponds to an event on which a command file (refer toAbout startup.cmd,
reset.cmd, preload.cmd, postload.cmd)can be automatically run from the Simulator/Debugger: Startup Command File,Reset Command File, Preload Command File, Postload Command File, Setcpu Command File, Vppon Command File and Vppoff Command File.
Figure 4.23 Target Interface Command File Dialog
The command file in the edit box is executed when the corresponding event occurs.
Click the Browse button to set the path and name of the command file.
The Enable Command File check box allows you to enable/disable a command file on an event. By default, all command files are enabled:
• the default Setcpu command file is SETCPU.CMD. • the default Vppon command file is VPPON.CMD. • the default Vppoff command file is VPPOFF.CMD.
NOTE Startup settings performed in this dialog are stored for subsequent
debugging sessions in the [Simulator] section of the PROJECT file using the variable CMDFILE0.
TIP When a CPU is set, the settings performed in this dialog are stored for subsequent debugging sessions in the [Simulator XXX] (where XXX is the processor) section of the PROJECT file using variables CMDFILE0, CMDFILE1,... CMDFILEn.
Startup Command File
The Startup command file is executed by the Simulator/Debugger after the Target Interface has been loaded.
The Startup command file full name and status (enable/disable) can be specified either with the CMDFILE STARTUP Command Line command or using the Startup property page of the Target Interface Command File Dialog dialog.
By default the STARTUP.CMD file located in the current project directory is enabled as the current Startup command file.
Reset Command File
The Reset command file is executed by the Simulator/Debugger after the reset button, menu entry or Command Line command has been selected.
The Reset command file full name and status (enable/disable) can be specified either with the CMDFILE RESET Command Line command or using the Reset property page of the Target Interface Command File Dialog dialog.
Preload Command File
The Preload command file is executed by the Simulator/Debugger before an application is loaded to the target system through the Target Interface.
The Preload command file full name and status (enable/disable) can be specified either with the CMDFILE PRELOAD Command Line command or using the Preload property page of the Target Interface Command File Dialog dialog.
By default the PRELOAD.CMD file located in the current project directory is enabled as the current Preload command file.
Postload Command File
The Postload command file is executed by the Simulator/Debugger after an application has been loaded to the target system through the Target Interface.
The Postload command file full name and status (enable/disable) can be specified either with the CMDFILE POSTLOAD Command Line command or using the Postload property page of the Target Interface Command File Dialog dialog.
By default the POSTLOAD.CMD file located in the current project directory is enabled as the current Postload command file.
Setcpu Command File
The Setcpu command file is executed by the Simulator/Debugger after a CPU has been set or modified in the simulator (this occurs when the setcpu command is used or when a file is loaded in the simulator and the
corresponding cpu is not set).
The Setcpu command file full name and status (enable/disable) can be specified either with the CMDFILE SETCPU Command Line command or using the Setcpu property page of the Target Interface Command File Dialog.
Vppon Command File
The Vppon command file is executed by the Simulator/Debugger before "Non Volatile Memory" is erased or before a file is programmed in "Non Volatile Memory" to the target system through the target interface Non Volatile Memory Control dialog (Flash... menu entry) or FLASH PROGRAM/ERASE commands from Flash Programming utilities.
The Vppon command file full name and status (enable/disable) can be specified either with the CMDFILE VPPON Command Line command or using the Vppon property page of the Target Interface Command File Dialog dialog.
By default the VPPON.CMD file located in the current project directory is enabled as the current Vppon command file.
This command file can be used, for example, to enable a programming voltage by software.
NOTE This command file is not available for all target interfaces.
Vppoff Command File
The Vppoff command file is executed by Simulator/Debugger after a "Non Volatile Memory" has been erased or after a file has been programmed in "Non Volatile Memory" to the target system through the target interface Non Volatile Memory Control dialog (Flash... menu entry) or FLASH PROGRAM/ERASE commands from Flash Programming utilities.
The Vppoff command file full name and status (enable/disable) can be specified either with the CMDFILE VPPOFF Command Line command or using the Vppoff property page of the Target Interface Command File Dialog dialog.
By default the VPPOFF.CMD file located in the current project directory is enabled as the current Vppoff command file.
Component Menu
Select Component>Open... to load an extra component window, shown in Figure 4.24, that has not been loaded by the Simulator/Debugger at startup. The popup dialog presents a set of different components that are introduced in Framework Components.
Figure 4.24 Component Menu
Table 4.7 describes the Component Menu entries.
Table 4.7 Component Menu Description
Menu entry Description
Open Loads an extra component window that has not been loaded by the Simulator/Debugger at startup. The popup dialog presents a set of different components that are introduced in Components Window.
Set Target Sets the Simulator/Debugger target e.g., Simulator.
Fonts Opens a standard Font Selection dialog, where you can set the font used by Simulator/
Debugger components.
Background Color
TIP For a readable display, we recommend using a proportional font (e.g., Courier, Terminal, etc.).
Demo Version Limitations
Only 2 I/O components can be loaded at a time.
Window Menu
In this menu, shown in Figure 4.25, you can set the component windows general arrangement. The Submenu Window>Options is shown in Figure 4.26 and the Submenu Window>Layout in Figure 4.27.
Figure 4.25 Window Menu
Figure 4.26 Window>Options SubMenu
Figure 4.27 Window>Layout SubMenu
Table 4.8 Window Menu Description
NOTE Autosize and Component Menu are checked by default.
Help Menu
This is the debugger help menu (Figure 4.28). Table 4.9 shows menu entries.
Figure 4.28 Help Menu
Menu entry Description
Cascade Option to arrange all open windows in cascade (so they overlap).
Tile Option to display all open windows in tile format (non overlapping).
Arrange Icons Arranges icons at the bottom of windows.
Options - Autosize
Component windows always fit into the debugger window whenever you modify the debugger window size.
Options - Component Menu
When a component window is selected, the associated menu is displayed in the main menu. For example if you select the Source window, the Source menu is displayed in the main menu.
Layout - Load/ Store
Table 4.9 Help Menu Description
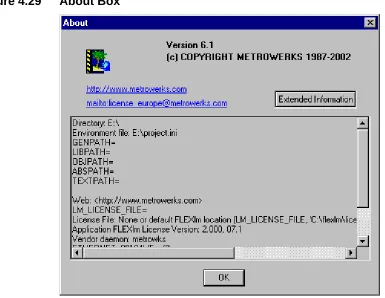
About Box
Select Help>about to display the about box, shown in Figure 4.29. The about box lists directories for the current project, system information, program information, version number and copyright. It contains
information to send for Registration: you can copy this information and send to [email protected].
Menu entry Description
Help Topics Choose Help Topics in the menu for online help or if you need specific information about a Simulator/Debugger topic.
About HI-WAVE
Figure 4.29 About Box
For more information on all components, click on the Extended Information button.
Two hypertext links allow you to send an E-mail for a license request or information, and open the Metrowerks internet home page.
Component Associated Menus
Each component loaded by default or that you have loaded has two menus. One menu is in the Simulator/Debugger main menu and the other one is a popup menu (also called “Associated Popup Menu”) that you can open by right-clicking in a window component. Note that before right-clicking, the component window has to be active.
Component Main Menu
This menu, shown in Figure 4.30 is always between the Component entry and the Window entry of the Simulator/Debugger main menu. It contains general entries of the current active component. You can hide this menu by unchecking Window>Options>Component Menu.
Figure 4.30 Example of Component Main Menu
Components File
Each component is a windows file with a .wnd extension
the position of the mouse in the window and what is being pointed to, popup menu entries will differ.
Figure 4.31 Example of Component Popup Menu
For example, if you point the mouse to a breakpoint, menu options allow you to delete, enable, or disable the breakpoint.
However some entries are identical with entries in the main menu.
Highlights of the User Interface
This section describes the main features of the Debugger user interface.
Smart User Interface: Activating Services with
Drag and Drop
Figure 4.32 Drag and Drop Example
When the destination of a dragged item is not possible, the following cursor symbol is displayed:
Example:
You can activate the display of coverage information on assembler and C statements by dragging the chosen procedure name from the Coverage Component to the Source and Assembly components (Figure 4.33).
Figure 4.33 Dragging the chosen procedure name from the “Coverage Component,” to the Source.
To Drag and Drop an Object
1. Select the component containing the object you want to drag.
2. Make sure the destination component where you want to drag the object is visible.
3. Select the object you want.
Drag and Drop Combinations
Dragging and dropping objects is possible between different component windows and are introduced in each component description section.
See below, the possible combinations of drag and drop between components and associated actions. When additional components are available, new combinations might be possible and described in the component’s information manual.
Dragging from the Assembly Component
Table 4.10 summarizes dragging from the Assembly Component.
Table 4.10 Dragging from the Assembly Component
Dragging from the Data Component
Table 4.11 summarizes dragging from the Data Component.
Table 4.11 Dragging from the Data Component Destination
compo.
Action
Command Line The Command Line component appends the address of the pointed to instruction to the current command.
Memory Dumps memory starting at the selected instruction PC. The PC location is selected in the memory component.
Register Loads the destination register with the PC of the selected instruction.
NOTE It is not possible to drag an expression defined with the Expression Editor. The “forbidden” cursor is displayed.
Destination compo.
Action
Command Line Dragging the name appends the address range of the variable to the current command in the Command Line Window. Dragging the value appends the variable value to the current command in the Command Line Window.
Memory Dumps memory starting at the address where the selected variable is located. The memory area where the variable is located is selected in the memory component.
Register Dragging the name loads the destination register with the address of the selected variable. Dragging the value loads the destination register with the value of the variable.
Dragging from the Source component
Table 4.12 summarizes dragging from the Source Component.
Table 4.12 Dragging from the Source component
Dragging from the Memory component
Table 4.13 summarizes dragging from the Memory Component.
Table 4.13 Dragging from the Memory component Destination
compo.
Action
Assembly Displays disassembled instructions starting at the first high level language instruction selected. The assembler instructions corresponding to the selected high level language instructions are highlighted in the Assembly component
Register Loads the destination register with the PC of the first instruction selected.
Memory Displays the memory area corresponding with the high level language source code selected. The memory area
corresponding to the selected instructions are greyed in the memory component.
Data A selection in the Source window is considered an expression in the Data window, as if it was entered through the Expression Editor of the Data component. (please see Data Component and Expression Editor)
Destination component.
Action
Dragging from the Procedure component
Table 4.14 summarizes dragging from the Procedure Component.
Table 4.14 Dragging from the Procedure component
Dragging from the Register component
Table 4.15 summarizes dragging from the Register Component. Command Line Appends the selected memory range to the Command Line
window
Register Loads the destination register with the start address of the selected memory block.
Source Displays high level language source code starting at the first address selected. Instructions corresponding to the selected memory area are greyed in the source component.
Destination component.
Action
Destination compo.
Action
Data > Local Displays local variables from the selected procedure in the data component
Source Displays source code of the selected procedure. Current instruction inside the procedure is highlighted in the Source component.
Table 4.15 Dragging from the Register component
Dragging from the Module component
Table 4.16 summarizes dragging from the Register Component.
Table 4.16 Dragging from the Module component
Selection Dialog Box
This dialog box is used in the Simulator/Debugger for opening general components or source files. You can select the desired item with the arrow keys or mouse and then the OK button to accept or CANCEL to ignore your choice. The HELP button opens this section in the Help File.
Destination compo.
Action
Assembly Assembly component receives an address range, scrolls to the corresponding instruction and highlights it.
Memory Dumps memory starting at the address stored in the selected register. The corresponding address is selected in the memory component.
Destination compo.
Action
Data > Global Displays global variables from the selected module in the data component
Memory Dumps memory starting at the address of the first global variable in the module. The memory area where this variable is located is selected in the memory component.
Set Target
Open IO component
Open Source File
Open Module
5
Framework Components
This Chapter introduces the concepts of the Debugger Components.
Click any of the following links to jump to the corresponding section of this chapter:
• Component Introduction • Components Window • General Component • Visualization Utilities
Component Introduction
The Simulator/Debugger kernel includes various components.
CPU component
CPU components handle processor specific properties such as register naming, instruction decoding (disassembling), stack tracing, etc. A specific implementation of the CPU module has to be provided for each processor type that is supported in the simulator/debugger. The CPU related
component is not introduced in this section. However, this system component is reflected in the Register component, Memory component, and all other Target dependent components. The appropriate CPU
component is automatically loaded when loading a framework (.ABS file). Therefore it is possible to mix frameworks for different MCUs. The Simulator/Debugger automatically detects the MCU type and loads the appropriate CPU component, if available on your environment.
access all global facilities of the debugger engine, such as the target interface (to communicate with different targets), and the symbol table. The Simulator/Debugger window components are implemented as dynamic link libraries (DLLs) with extension.WND. These components are introduced in this section.
Target components
Different debugger targets are available. For example, you can set a CPU Simulator to simulate your .ABS application files, and also set a
background debugger.
One target shall be loaded at any time. Either a simulator or a driver implements the link to the target system. The simulator implements the CPU and memory simulation and may be extended by I/O simulation. Different targets are available to connect the target system (hardware) to the Simulator/Debugger on the Host computer. For example, the target may be connected using an Emulator, a ROM monitor or any other supported device.
NOTE Target components are introduced in their respective manual.
Components Window
Use the Component menu to load all framework components.
1. Choose Component>Open...
Figure 5.1 Open Window Component Dialog
TIP To open more than one component, select multiple components.
3. Click OK to open the selected component.
The Icon panel shows you components with large icons.
The List panel shows you components with small icons.
The Details panel shows you components with their description.
Demo Version Limitations
Maximum number of components o