Detectors: Selective
E. R. Adlard, Burton, South Wirral, UK
Copyright^ 2000 Academic Press
Introduction
The packed columns used in the early days of GC were inefRcient by modern standards and so selective detectors that only gave a response to particular ele-ments or compounds had obvious advantages when analysing complex mixtures. There was also a big incentive to develop more sensitive detectors and the detection of an organic vapour in an inert gas lent itself to the development of a host of devices, the majority of which have failed to make any lasting impact. Even today when the mass spectrometer is the selective detectorpar excellencethere are still a num-ber of other, more limited, detectors commercially available and this situation seems likely to continue. This paper describes some of these detectors; it should be noted that they are described as ‘selective’ rather than ‘speciRc’ since although they may give a large signal for one type of analyte they will also invariably give a small signal for others.
In general, selective detectors usually have more operating parameters than the two common universal detectors, the thermal conductivity detector (TCD) and theSame ionization detector (FID), and are more sensitive to small changes in these parameters. Some selective detectors are so temperamental that, having needed several days to set them up, they are then best left in continuous standby even when not in use.
Element-Selective Detectors
Although there are selective detectors for most ele-ments, the common ones are those for sulfur, nitro-gen, phosphorus and the halogens. These elements account for the great majority of published work because they are the ones most likely to be encoun-tered in most real life applications.
Sulfur-Selective Detectors
Sulfur is an important element which turns up in manyRelds usually with deleterious effects; 0.1 ppm of a mercaptan in isopropyl alcohol would, for example, render it totally unRt for perfumery applications.
TheSame photometric detector (FPD) monitors the light emitted by a hydrogen-rich ‘cold’Same. Under these conditions sulfur (the S2 species) has a band
spectrum with a maximum at 394 nm and phos-phorus (HPO) has a band spectrum with a maximum at about 526 nm. Since these are band spectra they do not exhibit the very sharp emission lines of atomic spectra and are, therefore, only moderately selective. There are carbon band spectra, for example at 388 nm, that tend to interfere with the sulfur spec-trum. The response is approximately equimolar for different sulfur compounds unless oxygen is also present in the molecule. Since it is an S2 species being monitored in theSame the response is approx-imately proportional to the square root of the concen-tration. This disadvantage can be catered for by suit-able electronics but there is always some doubt about whether the response follows the square root rela-tionship accurately and calibration is essential for reliable quantitative results. Another severe disadvan-tage of the simple FPD is that co-eluted organic com-pounds not containing sulfur will ‘quench’ the sulfur emission and cause a drastic diminution of signal.
In spite of these disadvantages the FPD has proved a popular and important detector especially in the food and petroleum industries. For example, in the former it has been used for the detection of mercap-tans in lager. In the latter it has been shown that a crude oil, so biodegraded that it can no longer be identiRed by its hydrocarbonRngerprint, can still be recognized by its sulfur Rngerprint since the sulfur compounds are much more slowly degraded.
There have been a number of attempts over the years to improve the performance of the FPD. A
dual-Same version oxidizes the sulfur compounds to SOx
in an ordinary oxidizing Same and the products of combustion are then taken to the hydrogen-rich cold
Same. This gives a considerable reduction in the quenching effect of co-eluting compounds but at the cost of at least 10-fold loss in sensitivity from about 10\9g s\1for the singleSame version. Another ver-sion, the pulsed FPD, developed by Amiravet al. in 1991, reduced the hydrogen Sow rate so that the
Most versions of the FPD can be used for phos-phorus detection by changing theRlter from 394 nm for S to 526 nm for P and a number of other elements such as Se, Sn, As and Ge have also been determined at various wavelengths and with varying degrees of selectivity and sensitivity. Simultaneous detection of two elements is also possible.
A different type of sulfur/nitrogen selective de-tector has been successfully developed in the last few years. In the sulfur chemiluminescence detector (SCD), the sulfur-containing compounds are combus-ted in an oxidizingSame or in later versions in a minia-ture ceramic furnace to SOx which is then reacted
with ozone in a low pressure chamber at about 10}15 Torr. Reaction with ozone raises the sulfur oxides to an excited state and as the molecules drop back to the ground state they emit light in the far blue end of the spectrum which is monitored by a photo-multiplier tube after passing through an opticalRlter. Sub-picogram per second sensitivity is claimed for this detector with a linear response overRve orders of magnitude, equimolar response for different sulfur compounds and no quenching effects. By replacing the opticalRlter for sulfur with one in the red region (610 nm) the detector can be used selectively for ni-trogen. This is, in effect, similar to the so-called Thermal Energy AnalyserTMwhich was produced in the 1970s speciRcally for the analysis of nitrosamines in food but which never achieved wide popularity.
Figures 1A}D show chromatograms of a gas oil
before and after a hydrotreater unit designed to re-duce the total sulfur content of the fuel from about 220 ppm to 2 ppm. Figures 1A and B show the before and after FID traces where it is difRcult to see any difference and Figures 1C and D show the before and after SCD chromatograms where the difference is clearly apparent.
Nitrogen-Selective Detectors
To a certain extent these have been covered in the section above but the commonest nitrogen-selective detector is theSame thermionic detector. This is ab-breviated to FTD or NPD, since by operating under different conditions the detector can be made selec-tive for nitrogen or phosphorus (but not both simulta-neously). Like the FPD this detector has a long history of development originating in the observation that alkali metal compounds introduced into aSame gave a high response for halogens. Indeed, early detectors were made by modifying leak detectors used to moni-tor the escape of halogenated gases from refrigeration units. By operating under different conditions, selec-tivity for nitrogen and phosphorus could also be ob-tained. The next development was to use a small
Same as in an FID to impinge upon a pellet of an alkali metal salt; later versions had an alkali metal saltSame tip. All these versions suffered from the fact that, as the salt was gradually vaporized in theSame, the response of the detector altered and consequently required frequent calibration. The current version looks very similar to a conventional FID in construc-tion but has a bead of rubidium glass that can be electrically heated to 600}8003C between theSame jet and the main collector electrode. This acts in a somewhat analogous manner to the grid in an electronic triode valve. Since the bead does not de-pend on a combustionSame for heating it is more stable and less susceptible to variations in response. For nitrogen the hydrogen gas supply to the detector is very small (about 4 mL min\1) and the area of reaction is described as a hydrogen plasma rather than aSame. Increasing the hydrogenSow rate to the
Same to about 30 mL min\1increases the sensitivity for phosphorus and reduces the nitrogen response. Typical performance characteristics for the NPD are shown inTable 1.
There is still considerable controversy about the mechanism of response of the NPD and for an in-depth discussion of this the reader should consult Patterson (see Further Reading).
The NPD is capable of giving excellent results if used by a skilled operator and it has been used in the nitrogen mode for a wide variety of samples. How-ever, the difRculties in its use for routine analysis and the alternative detectors now available seem to indi-cate a decline in its use in the future.
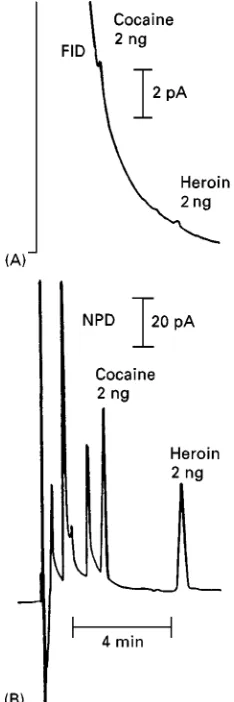
Figure 2A shows an FID chromatogram of a
sample containing 2 ng amounts of cocaine and heroin and Figure 2B shows the equivalent chro-matogram obtained with an NPD. The improved sensitivity and selectivity of the NPD are clearly demonstrated.
Multi-Element Selective Detectors
There are at least two detectors commercially avail-able that are capavail-able of multi-element detection. TheRrst of these is the electrolytic conductivity detector (ELCD), sometimes known as the Hall detector after its main developer and the second is the microwave plasma detector.
The Electrolytic Conductivity Detector (ELCD)
Figure 1 FID chromatograms of gas oil before (A) and after (B) hydrotreating. SCD chromatograms of gas oil before (C) and after (D) hydrotreating. (From Hutte RS. InChromatography in the Petroleum Industry (1995) Adlard ER (ed.). Reproduced with permission of Elsevier Science.)
about 850}10003C. Under these conditions halogen compounds are reduced to HX, nitrogen compounds to NH3 and sulfur compounds to H2S. These gases are all very soluble in water and if they are passed into a circulating water stream the electrical conductivity
Table 1 Typical performance characteristics for the NPD
Characteristic Typical values
Sensitivity SN"0.1}1.0 A)s/g N
SP"1.0}10.0 A)s/g P
Detectivity DN"5;10\14I2;10\13g N s\1
DP"1;10\14I2;10\13g P s\1
Specificity SN/SC"103}105gC/gN
SP/SC"104}5;105gC/gP
SN/SP"0.1I0.5 gP/gN
Linear range 103}105
[image:4.568.108.225.300.651.2]Source: From PL Patterson in Detectors for Capillary Chromato-graphy (eds. HH Hill and DG McMinn). Reproduced courtesy of John Wiley and Sons Inc.
Figure 2 Comparison of FID and NPD chromatograms for
a sample containing trace amounts of cocaine and heroin. (From Patterson PL. InDetectors for Capillary Chromatography (1992) Hill HH and McMinn DG (eds). Reproduced with permission of John Wiley & Sons, Inc.)
Figure 3 Chromatogram obtained by purge and trap sampling of water with the ELCD in the halogen mode. (From Hall RC. In Detectors for Capillary Chromatography (1992) Hill HH and McMinn DG (eds.). Reproduced with permission of John Wiley & Sons, Inc.) Column: Restek 502.2 FS 0.53 mm;105 M. Pro-gram: 353C for 11 min, 53C min\1 to 1603C, 4-min final hold.
Carrier: helium at 8 mL min\1. ELCD conditions: reactor
temper-ature, 9603C; electrolyte, 35L min\1n-propyl alchohol; reaction
gas, 100 mL min\1H 2. chromatogram rather than the more familiar
differen-tial chromatogram and this is overcome by circula-ting the electrolyte through ion exchange resins to constantly regenerate pure electrolyte. Selectivity for
halogens co-emerging with nitrogen or sulfur com-pounds can be obtained by using other electrolytes rather than water (n-propanol is recommended since other reaction gases are not soluble in it). Another way to obtain selectivity is to use small scrubbers containing chemicals that will remove speciRc gases. For example an acidic scrubber removes ammonia but allow halogen acids to pass through.
Clearly there are number of opportunities for vari-ation in the chemistries involved (material of reaction tube construction, reaction tube temperature, oxida-tion or reducoxida-tion, electrolyte and scrubber) in order to obtain optimum sensitivity and selectivity. For halogens the sensitivity is in the low picogram range with a linearity of Rve orders of magnitude and a halogen/hydrocarbon selectivity of better than 106. In spite of these impressive performanceRgures the main use of the ELCD has been in the determination of halogenated compounds in water where its use is speciRed in US Environmental Protection Agency Method 502.2.Figure 3shows a chromatogram ob-tained by purge and trap sampling of water with the ELCD in the halogen mode.
[image:4.568.294.515.417.614.2]The Atomic Emission Detector (AED)
Most of the detectors described above can be used selectively for several elements but this is normally carried out one element at a time, although the FPD, for example, can determine at least two elements (S and P) simultaneously if desired. One of the advant-ages of the AED is that theoretically it can detect a large number of elements simultaneously with high sensitivity and selectivity. In practice the number de-termined simultaneously is usually limited to four and, since one of these is normally a carbon channel, only three other elements can be determined.
In the AED, or microwave plasma detector, the compounds are subjected to a high energy microwave plasma so that the emitted spectra are line spectra which are of an extremely narrow wavelength, often only 0.1 A> wide. This results in (potentially) a much higher selectivity and sensitivity.
The AED had a long history of development. ItRrst appeared commercially in the early 1970s. This de-tector was operated with a microwave plasma in pure helium at low pressure (10}100 mm) and made use of a nitrogen purge to remove carbon deposits from the wall of the silica discharge tube at the outlet of the column. The emission spectra were resolved with a conventional3
4m optical spectrometer which result-ed in a rather large and unwieldy apparatus which was also sensitive to movement, requiring fairly fre-quent realignment of the optics. One of the claimed advantages of this detector was that is was possible to obtain the carbon, hydrogen and other element con-tents of an unknown molecule and so calculate an empirical formula. In practice it was found to give an empirical formula for low molecular weight com-pounds that was accurate to about$10% and the equipment was never really seriously used for this purpose. Sensitivity and selectivity varied consider-ably from one element to another. In favourable cases such as the halogens, picogram per second levels could be detected with a selectivity over carbon of about 103but nitrogen and oxygen gave much poorer performance mainly due to the large background signal.
A new version was made commercially available in the 1980s. This version differs from the original in two main respects}Rrstly the microwave discharge takes place in a cavity at atmospheric pressure and secondly the optical spectrometer is replaced by a photodiode array. The result of these modiRcations is a detector that is much smaller and easier to operate although the actual performance in terms of sensitiv-ity and selectivsensitiv-ity is not greatly different from the original designs. The relative compactness and ease of operation have led to a resurgence of interest in this
detector but it is not cheap and as GC-MS systems come down in price they represent strong competi-tion. The deRnitive account of the various forms of microwave plasma detector is given by de Wit and Beens (see Further Reading).
The Oxygen Selective Detector (O-FID)
The phasing out of lead antiknock compounds in gasoline and their replacement by ‘oxygenates’ }mainly alcohols and ethers such as methyl tertiary butyl ether (MTBE)}created a need for an oxygen-selective detector, easy to use with capillary columns. The O-FID wasRrst proposed by Schneider in 1982 and is now commercially available. The principle of the detector is that the efSuent from the GC column is
Rrst passed through a microfurnace made of plati-num/rhodium alloy heated to about 12003C where hydrocarbons are cracked to carbon (which is depos-ited on the Pt/Rh tubing) and hydrogen. Oxygenated compounds on the other hand form CO which is then passed to a second microreactor with a stream of hydrogen. The microreactor containing nickel depos-ited on alumina is heated to about 3503C and is small enough toRt into the body of a standard FID. Under these conditions each CO molecule is reduced to a methane molecule so that every oxygen atom in the original efSuent peak produces one methane molec-ule. The whole arrangement sounds complex but it works remarkably well for samples up to 20g which is of course satisfactory for capillary columns. The detector is ideally suited for the purpose for which it was designed. Figure 4 shows an O-FID chromato-gram of a gasoline sample containing alcohols, water, ethers and acetone. It should be noted that the de-tector gives a quite respectable peak from the oxygen in the water.
The disadvantages of the detector are its relatively low concentration sensitivity and linearity compared to other selective detectors and the ordinary FID. The limit of concentration sensitivity is about 0.01%.
Figure 4 Detection of oxygenates in gasoline at 200 ppm level. (From Sironi, A and Verga, GR. InChromatography in the Petro-leum Industry (1995) Adlard, ER (ed.). Reproduced with per-mission of Elsevier Science Publishers.)
to an AAS it is a little surprising that the technique has not been used more frequently. It has the virtues of high sensitivity for many metals and high selectiv-ity. It also gives information about the speciation of the organometallics which is very difRcult to obtain in other ways.
In spite of these advantages relatively little has been published on the use of such detection systems, prob-ably reSecting the relatively minor importance of the analysis of organometallics compared to ordinary or-ganic compounds. Organometallics are, however, im-portant in a number ofRelds, e.g. the determination of butyltin antifouling paint residues in the environ-ment, and it seems likely that this niche area will remain but not expand signiRcantly in the future.
Compound-Selective Detectors
This category refers to detectors that respond speciR -cally to whole molecules or, more commonly, to various functional groups in a molecule.
An example of a detector responding to functional groups is the automatic titrimeter described by James and Martin in their earliest publications on the separ-ation of the lower fatty acids. Although slow and
lacking in sensitivity by modern standards, this de-tector represented a major advance at the time. At-tempts over the years to use microcoulometers as detectors for compounds capable of oxidation or re-duction at suitable electrodes have virtually disap-peared since, in general, they have slow response and the electrodes are subject of contamination.
Compared to element-selective detectors, there are very few compound-selective detectors and indeed in terms or modern commercially available equipment they can be limited to four } the electron-capture detector (ECD), the photoionization detector (PID) and two spectroscopic detectors, Fourier transform infrared (FTIR) and ultraviolet (UV) detectors. Trap-ping out polynuclear aromatic hydrocarbon fractions for further analysis by UV spectroscopy was reported many years ago but although there is now an online GC-UV instrument on the market, it is of limited application and will not be discussed further.
The Electron-Capture Detector (ECD)
The development of the ECD by Lovelock in the late 1950s led to its application in environmental studies and the discovery of the wide distribution of chlorin-ated pesticide residues such as DDT. This was fol-lowed by the discovery of the emission of methyl iodide from open ocean waters which again had great signiRcance in the study of the Earth’s ecosystem.
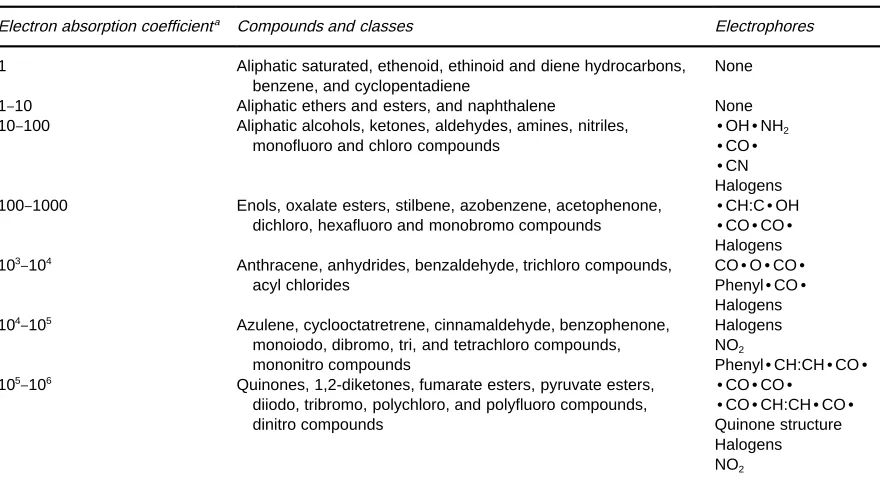
Table 2 The electron absorption coefficients of various compounds and of classes of compound for thermal electrons
Electron absorption coefficienta Compounds and classes Electrophores
1 Aliphatic saturated, ethenoid, ethinoid and diene hydrocarbons, benzene, and cyclopentadiene
None
1}10 Aliphatic ethers and esters, and naphthalene None
10}100 Aliphatic alcohols, ketones, aldehydes, amines, nitriles, monofluoro and chloro compounds
zOHzNH2 zCOz
zCN Halogens 100}1000 Enols, oxalate esters, stilbene, azobenzene, acetophenone,
dichloro, hexafluoro and monobromo compounds
zCH:CzOH
zCOzCOz Halogens 103}104 Anthracene, anhydrides, benzaldehyde, trichloro compounds,
acyl chlorides
COzOzCOz PhenylzCOz Halogens 104}105 Azulene, cyclooctatretrene, cinnamaldehyde, benzophenone,
monoiodo, dibromo, tri, and tetrachloro compounds, mononitro compounds
Halogens NO2
PhenylzCH:CHzCOz 105}106 Quinones, 1,2-diketones, fumarate esters, pyruvate esters,
diiodo, tribromo, polychloro, and polyfluoro compounds, dinitro compounds
zCOzCOz
zCOzCH:CHzCOz Quinone structure Halogens NO2
Source: After Lovelock.aValues are relative to the absorption coefficient of chlorobenzene. from the detector. He, therefore, maximized the
elec-tron capturing effect by using argon with 5}10% methane as carrier gas and about 50 V across the electrodes. Such a cell has a phenomenally high sensi-tivity for compounds such as CCl4 and is capable of detecting femtogram quantities (10\15g). Indeed the ECD has a higher sensitivity under favourable condi-tions than any other detector with the possible excep-tion of radioactivity detectors.
Molecules that capture electrons form charged en-tities with a much lower mobility than the free elec-trons responsible for the standing current in the cell. Because of their lower mobility they lose their charge readily and hence cause a reduction in the standing current. The ECD is the only detector that measures a decrease in a large standing current; all other de-tectors measure an increase in a small standing cur-rent. Since the standing current can only be reduced to zero, the ECD can be easily overloaded and has, even in its modern versions, a relatively limited linear range of about 104. Modern versions of the ECD pulse the voltage on the electrodes rather than using a steady DC potential. This allows equilibrium to be achieved between the electronSux and the gas mix-ture in the cell and is somewhat analogous to a distil-lation column under total reSux from which a small grab sample is removed from time to time. By chang-ing the frequency of the pulses the current in the cell can be kept constant and the variation in frequency required to maintain a constant current is monitored rather than changes in the current itself. This is a very
simple arrangement electronically that is readily com-patible with integrating circuits. The most recent modiRcation to the ECD dispenses with the radioac-tive source and uses electrons produced by a helium discharge in an extension to the cell proper.
As indicated in the introduction to this section, the very high sensitivity of the ECD to polyhalogenated compounds made it extremely important for the anal-ysis of trace pesticides in crops since many pesticides were compounds of this type. In addition to a very high sensitivity for some classes of compounds it has a negligible response for others such as parafRn hy-drocarbons.Table 2shows that the response to dif-ferent classes of compounds varies over a range of at least 106.
This response is not amenable to accurate predic-tion from the chemical structure of the compounds and even apparently small differences in structure can result in large differences in electron afRnity. The ECD is not suitable for detection of an unknown mixture since large peaks may be from small amounts of compounds with high electron afRnity or large amounts of compounds with a low electron afRnity. In spite of its rather anomalous response and limited linear range, the ECD is an extremely important de-tector under favourable circumstances.
The Photoionization Detector (PID)
supplied by a small, cheap UV lamp which can be changed over a range of wavelengths to give a certain amount of selectivity. The Rrst commercial detector was designed to operate with packed columns but the large amount of stationary phase bleed from these columns caused rapid fouling of the quartz window of the cell facing the UV lamp and consequent de-terioration of performance. Relatively simple design modiRcations reduced the dead volume to about 40L which is adequate for capillary columns of about 0.25 mm i.d. or greater. Use of capillary col-umns minimizes the fouling from stationary phase and also results in much sharper peaks; since the PID is a concentration-dependent detector this gives a considerable improvement in sensitivity. The main drawback of the commercial PID lies in the UV lamp sources available. Only one gives a single pure wavelength and this is of such low intensity that it offers poor sensitivity. The 10.2 eV lamp emits two wavelengths with an average energy of 10.2 eV. The inhomogeneity of the source blurs the selectivity of the detector although there is no doubt that it gives up to two orders of magnitude greater sensitivity for aromatics over aliphatic compounds with oleRns somewhere in between. The lamp of higher wavelength (11.7 eV) is sufRciently energetic to ion-ize most compounds indiscriminately so the detector
Rtted with this lamp becomes more or less universal in response. The ideal version of this detector would be one with a tunable laser source and such a detector might rival the mass spectrometer in qualitative in-formation. Unfortunately, the current cost of a tun-able laser would render the detector prohibitively expensive and development on these lines is unlikely in the near future.
The FTIR Detector
The main disadvantage of simple mass spectrometry detection is its inability to distinguish between many positional isomers. The technique ideally suited to give such information and the presence of functional groups such as CO and OH is IR spectroscopy. Con-ventional IR spectroscopy with a grating is too slow for GC purposes but FTIR has the required speed provided that sufRcient computing power is available (the computing power required is considerably greater than that required for other techniques). An-other disadvantage is that the spectra obtained are gas phase spectra whereas IR spectral libraries have been traditionally liquid phase spectra. The main disadvantages, however, are the wide variation in extinction coefRcients, the rather poor sensitivity for many compounds (the upper nanogram range) and light pipe cells with a relatively large dead volume.
Since capillary GC seems to be moving in the direction of faster separations via short, very narrow bore capillaries it seems doubtful if GC-FTIR will ever Rnd any great application except perhaps in niche application areas such as essential oil and perfumery analysis.
Conclusion
There still appears to be a place for selective detectors provided that they can offer speciRc advantages. Early versions of most of the detectors described appeared 30 or more years ago and have survived by constant modiRcations and improvement in design and performance. In the light of this and the fact that just about every conceivable property of gas mixtures has been exploited over the years it is difRcult to envisage any great new advance.
Many detectors have speciRc advantages for par-ticular applications. The PID only requires one gas supply which makes it suitable for portable equip-ment. A laboratory monitoring the amount of stench-ing agents in natural gas is hardly likely to abandon the simplest form of FPD for anything more sophisti-cated. The ECD reigns supreme in theReld of poly-halogenated compounds and the O-FID is ideally suited for the purpose that it was designed for. As speed of analysis increases, detectors are required with very fast response time and low dead volume leading to devices such as time-of-Sight mass spec-trometers. It would appear that in spite of nearly 50 years of continuous development there is still room for further advances in detectors.
See also: II/Chromatography: Gas: Column Techno-logy; Detectors: General (Flame Ionization Detectors and Thermal Conductivity Detectors); Detectors: Mass Spectrometry. III/Environmental Applications: Gas Chromatography } Mass Spectrometry. Fungicides: Gas Chromatography; Herbicides: Gas Chromato-graphy; Pesticides: Gas ChromatoChromato-graphy; Petroleum Products: Gas Chromatography. Appendix 2: Essential Guides to Method Development in Gas Chromatography.
Further Reading
Adlard ER (1975)Critical Reviews in Analytical Chemistry
5(1): 13}36. (A review of selective detectors up to that date.)
Brown RA and Searl TD (1979) In: Altgelt KH and Gouw TH (eds)Chromatography in Petroleum Analysis. Ch. 13. New York: Marcel Dekker. (An account of early work on ofSine GC-UV.)
Dressler M (1986) Selective Gas Chromatography De-tectors. Amsterdam: Elsevier. (A literature survey of most of the selective detectors described up to about 1984. Mainly of historic interest.)
Eicman GA (1990) In: Clement RE (ed.)Gas Chromatogra-phy, Biochemical, Biomedical and Clinical Applica-tions, Ch. 14. New York: Wiley Interscience. (An ac-count of the GC of organometallic compounds.) Hill HH and McMinn DG (eds) (1992)Detectors for Capillary
Chromatography. New York: Wiley Interscience. (An ex-cellent book with chapters on the ELCD (by Hall), the NPD (by Patterson) and GC-FTIR (by Gurka) in particular.)
Gas Chromatography
^
Infrared Spectrometry
P. R. Griffiths, University of Idaho, Moscow, ID, USA
This article is reproduced fromEncyclopedia of Analytical Science, Copyright Academic Press 1995.
Knowing the identity of each component in a mixture is necessary for many analytical-scale separations, and simply measuring retention data for this purpose is often too ambiguous for the identiRcation of mol-ecules eluting from a capillary gas chromatography (GC) column, which has the capability of resolving several hundred components. Prior knowledge about the chemical structure of the components and spiking of the mixture with one or more reference standards may aid the identiRcation process; however, a less ambiguous identiRcation can be accomplished by in-terfacing the chromatograph to a sensitive, rapid-scanning spectrometer to obtain unique signatures of each component. This instrument should allow each component to be detected in real time without any loss in chromatographic resolution. Mass spectro-metry (MS) is the most commonly applied technique for this purpose, but it has certain limitations, in particular for distinguishing between structural isomers, such as ortho-, meta- and para-xylene, whose electron-impact and chemical-ionization mass spectra are identical. For such molecules a tech-nique complementary to MS is desired. Fourier trans-form infrared (FT-IR) spectrometry, which yields unique spectra for most structural isomers, has fre-quently been used as an alternative technique for this purpose.
Light-Pipe-Based GC-IR Instruments
Measurement of the SpectrumThe coupling of gas chromatographs and FT-IR spec-trometers (GC-IR) has been accomplished by three approaches. In theRrst, and by far the simplest, the
GC column is connected directly to a heated S ow-through cell. For capillary GC, this cell is usually fabricated from a 10-cm length of heated glass tubing with an internal diameter of&1 mm. The inside bore of this tube is coated with a thick enoughRlm of gold to be highly reSective to infrared (IR) radiation. IR-transparent windows (for example made of potassi-um bromide) are attached to both ends of the tube. IR radiation entering one window is multiply reSected down the gold-coated interior bore before emerging from the other window, giving rise to the name light}pipefor this device. The efSuent from the GC column is passed into one end of the tube and out of the other via heated fused-silica transfer lines. The entire unit is held at a temperature between 250 and 3003C to preclude the condensation of semi-volatile materials.