Considerations on the UK Re-Arrest Hazard Data Analysis
BRETT HOULDING
†
AND SIMON P.WILSONDiscipline of Statistics, Trinity College Dublin, Ireland
The offence risk posed by individuals who are arrested, but where subsequently no charge or
caution is administered, has been used as an argument for justifying the retention of such
individuals’ DNA and identification profiles. Here we consider the UK Home Office
arrest-to-arrest data analysis, and find it to have limited use in indicating risk of future offence. In doing
so, we consider the appropriateness of the statistical methodology employed and the implicit
assumptions necessary for making such inference concerning the re-arrest risk of a further
individual. Additionally, we offer an alternative model that would provide an equally accurate fit
to the data, but which would appear to have sounder theoretical justification. Finally, we consider
the implications of using such statistical inference in formulating national policy, and highlight a
number of sociological factors that could be taken into account so as to enhance the validity of
any future analysis.
Keywords: probabilistic causality; statistical inference; reliability modelling; DNA profiling.
1. Introduction
The issue of profiling a person’s Deoxyribonucleic Acid (DNA) following arrest, but where subsequently No Further Action (NFA) is taken, divides the opinions of society. Those who are against such a practice argue that it discriminates members of society from others who are similarly entitled to a presumption of innocence, leading to a risk of stigmatisation, and that all non-convicted
or non-cautioned individuals should share the same right to a private life. On the other hand, those in favour of DNA profiling claim that, other than if a suspect were to commit an offence in the future, the profiling of their DNA would have no direct consequence for them. Furthermore, they cite studies such as the UK arrest-to-arrest data analysis1, which are argued as indicating that those persons who are subject to a NFA order are statistically more likely to be re-arrested than the population of
individuals never previously arrested, and that as they are more likely to be re-arrested, they constitute a greater risk of committing, or at least being connected with, a future indictable offence.
Here we do not explore the ethics of DNA profiling per se, but instead focus on the statistical evidence used in supporting such a practice. In doing so, we offer our own considerations concerning the conclusions that can be formulated following the UK Home Office’s arrest-to-arrest data analysis, and review the underlying implicit assumptions that are required for making inference regarding risk of re-arrest of a newly arrested individual. In particular, we note that only in limited and unreasonable circumstances will the statistical analysis provided constitute sufficient statistical evidence of a greater risk of future offence for individuals subject to a NFA decision.
The remainder of this paper is as follows. In Section 2 we detail the background to current UK policy on DNA profiling within England and Wales, and discuss how statistical arguments have contributed to the formulation of this policy and how they have been previously presented. In Section 3 we detail the statistical analysis performed by the UK Home Office Economics and Resource Analysis Group regarding the re-arrest hazard rate for individuals who were subject to a NFA order in April 2006. In particular, we review the implicit assumptions that are required in making such inference and offer an alternative analysis that would similarly fit the data but which would result in different conclusions concerning re-arrest risk. Finally, in Section 4 we offer a critique concerning the use of statistical modelling assumptions when contributing to policy formation, and suggest that
1 Home Office Economics and Resource Analysis Group (2009) “DNA Retention Policy: Re-Arrest Hazard
Rate Analysis”. Available at:
any attempt to determine actual re-arrest risk would require a more appropriate analysis that explicitly takes into account a number of important sociological factors.
2. UK Policy of DNA Profile Retention
At time of writing, the policy for the processing of DNA and identification details for Constabularies within England and Wales is determined by Section 14 of the Crime and Securities Act 2010, which was passed in Parliament as the appropriate Government response to the ruling in the European Court of Human Rights (ECtHR) in the case of S and Marper v. UK (2008) ECHR 1581. Prior to this, the Retention Guidelines for Nominal Records on the Police National Computer2 formed UK Policing policy.
The most recent version of the Retention Guidelines came into force in 2006, and were developed following the passing of the Criminal and Police Act 2001 and the Criminal Justice Act 2003. The former of these legislations ended the requirement for Constabularies to destroy DNA and fingerprint records relating to persons acquitted at court or who otherwise had their case discontinued, whilst the latter further extended Policing powers so as to permit the taking of DNA and fingerprint records without consent from any individual arrested for a recordable offence. As such, by 2010 there were over 5 million persons with profiles on the UK National DNA database, with approximately 1 million of these having no record of conviction, caution, reprimand or final warning3.
The Retention Guidelines suggested a governing principle that all records held on the Police National Computer should be maintained until the person in question reached 100 years of age, regardless of status of conviction, caution, acquittal, or NFA. There is, however, an ‘exceptional case procedure’, but as the guidelines recognise, such cases will be by definition rare. Effectively this
2 ACPO (2006) “Retention Guidelines for Nominal Records on the Police National Computer”. Available at
http://www.acpo.police.uk/asp/policies/Data/Retention%20of%20Records06.pdf
3 House of Commons Home Affairs Committee, Eighth Report of Session 2009-2010 “The National DNA
procedure requires the data subject to either prove that their arrest had been unlawful, or to establish beyond doubt that no offence existed.
This changes the burden of proof concerning the existence of an offence from that of it being the State’s responsibility, to that of it being the suspects, for in criminal justice the presumption of innocence, or ei incumbit probatio qui dicit, non qui negat (the burden of proof rests on who asserts, not on who denies), requires that the State prove both that a crime had been committed, and that it was the suspect who had committed that crime. Hence the exceptional case procedure requires the
arrestee to disprove the commission of any offence, when any conviction would have required the State to prove beyond reasonable doubt that an offence had indeed been committed.
This previous policy was challenged, first unsuccessfully through the UK judicial system4, before successfully being appealed in the ECtHR, where it was found to violate the data subject’s rights under Article 8 of the European Convention of Human Rights (the right to a private life):
ARTICLE 8
1) Everyone has the right to respect for his private and family life, his home and his correspondence.
2) There shall be no interference by a public authority with the exercise of this right except such as is in accordance with the law and is necessary in a democratic society in the interests of national security, public safety or the economic well-being of the country, for the prevention of disorder or crime, for the protection of health or morals, or for the protection of the rights and
freedoms of others.
4 The citations are S,R (on the application of) v. Chief Constable of South Yorkshire & Anor (2002) EWHC
478 (Admin), Marper and Anor, R (on the application of) v. Chief Constable of South Yorkshire & Anor (2002)
EWCA Civ 1275, and LS, R (on the application of) v. South Yorkshire Police (Consolidated Appeals) (2004)
The ECtHR ruled that the UK’s DNA retention policy violated this fundamental right, and criticised the blanket nature of the guidelines whereby, irrespective of the offences involved or a person’s circumstances, DNA profiles were being maintained for what was effectively an indefinite period, a procedure which was considered by the Strasbourg court as being unnecessary in a democratic society.
As part of the proceedings in the ECtHR, representatives of the UK referred to what was described as impressive statistical reports. In particular, by 30th September 2005 the National DNA database held profiles of approximately 181,000 individuals who had been subject to either a NFA order or acquittal, out of which 8,251 were subsequently linked with crime scene stains involving 13,079 claimed offences. These offences included 109 murders, 55 attempted murders, 116 rapes, 67 sexual offences, 105 aggravated burglaries and 126 offences of the supply of controlled drugs.
In response, the applicants’ representatives argued that such statistics were misleading, which was a view that was also advocated in the conclusions of the Nuffield Report5. The Nuffield Report in particular referred to a lack of empirical evidence justifying the indefinite retention of DNA profiles from those neither charged nor convicted. It also argued that such statistics did not reveal the extent of any link between being associated with a crime scene sample and any resulting conviction, and no research or figures are available for the number of crimes that are solved where DNA matches included those profiles of individuals never previously convicted. Moreover, such statistics did not reveal the use of the crime scene sample in obtaining any conviction that might otherwise not have occurred, and for the majority of the cases mentioned, the DNA records were only matched with earlier crime scene stains retained on the database, meaning that such matches could have been made without the continued processing of DNA profiles following either acquittal or a NFA order.
It would appear then, that whilst such historical statistics do not establish that the course of justice could not have been achieved without the retention of DNA profiles, it is often of benefit to
5 Nuffield Council on Bioethics (2007) “The Forensic Use of Bioinformation: Ethical Issues”. Available at
obtain a DNA profile at point of arrest and to review that sample against historic crime scene stains. Indeed, there does not appear to be any non-governmental organisation that does not accept this procedure as being supportive in the detection of criminal behaviour. What is less clear, however, is whether it is necessary to continue retention beyond such an initial check against the crime scene database.
Despite the arguments previously put forward by the UK authorities for indefinite retention of DNA profiles, following the Strasbourg decision the UK Government sought to bring in new legislation so as to recognise, and bring policy into line with, its understanding of the requirements made by the European ruling. As a result, the Crime and Securities Act 2010 included a section stating that the maximum duration DNA profiles could be maintained for persons acquitted or subject to a NFA order would be between three and six years; depending on the seriousness of the offence and the age of the person arrested. In the case of an adult who was subject to a NFA order following arrest for any indictable offence, the retention duration is at the upper limit of six years (though the Police can still appeal for further extensions on a case by case basis). This upper limit of six years is in line with initial conclusions that may be drawn from the UK Home Office’s arrest-to-arrest data analysis, where it is claimed that there is an increased risk of re-arrest of a previously arrested person against an all-person comparator for up to approximately 6 years after the initial date of arrest.
Nevertheless, the appropriateness of the response of the Crime and Securities Act 2010 is still under dispute, and a recent application for judicial review6 resulted in a ruling that the Administrative Court was bound by the decision of the UK Supreme Court (which had subsequently assumed the judicial functions of the House of Lords), rather than the ECtHR, meaning that it is now likely that a further appeal will be brought directly to the Supreme Court. Furthermore, following the UK general election of 2010 a new Government was formed and, at the time of writing, has specified intentions to further alter UK legislation under a proposed Freedom (Great Repeal) Bill. The proposed alteration involves adopting the Scottish system of DNA retention whereby, following acquittal or other discontinuance of a case, DNA profiles are only retained in cases of sexual or violent offences, and
even then only for a maximum of three years (though this is also subject to appeal by the Police on a case by case basis).
Yet, whether or not legislation is indeed further altered, interest remains in the actual risk that is posed by an individual arrested, but where there is neither a caution nor a conviction, and the
statistical basis for this. Certainly the question of necessity in the retention of DNA records remains, and until legislation is altered it is likely that the Crime and Securities Act 2010, and the resulting policy of retention for 6 years, will continue to be tested in both the UK and European courts.
3. UK Arrest-to-Arrest Data Analysis
Home Office re-arrest hazard rate analysis
To determine the statistical basis for retention of DNA profiles beyond an initial check against historical crime scene samples, an investigation was conducted by the UK Home Office Economics and Resource Analysis Group. The aim of the investigation was to establish the likelihood or
probability of future arrest as a function of time elapsed since initial arrest. This could then be argued as constituting statistical evidence for retaining DNA records of individuals subject to a NFA order, but who also had not been subject to any prior conviction (for in such instances the DNA records would be maintained indefinitely).
The data concerned all suitable individuals who were arrested in April 2006, hereafter the ‘NFA group’, and whilst the analysis accepts that an individual’s arrest does not equate to their committing
an indictable offence (which as discussed above, also does not prove that an indictable offence has even been committed), acknowledges that a conviction for a recordable offence will necessarily be preceded by an arrest. As such, and despite whether or not it is ethical or even appropriate to do so, the analysis argues that arrest can be considered an indicator or proxy for offending risk.
number of events that could be observed by the end of the data monitoring, i.e., where a first arrest was followed by a subsequent second arrest and successful conviction. This would have significantly reduced the amount of available information concerning the NFA group of April 2006, and would have increased the reliance on extrapolating results.
In the case of a conviction-to-conviction rate, such an analysis would not have supported any Government response to the ruling in the ECtHR, as that decision related to the retention of DNA records for individuals who do not hold a caution or conviction. Hence, with such an understanding concerning the definition of offending risk, i.e., based on arrest-to-arrest rate, the analysis sought to determine when the risk of offence by the NFA group would equal the estimated risk in the general population, as it could be claimed that at such a point the case for DNA record retention for the NFA group was no stronger than the case for DNA retention of the general population.
The NFA group consisted of 17,239 eligible individuals arrested in April 2006, of which 6,748 were subsequently re-arrested between 1st May 2006 and 1st August 2009 (the latter being the end point before the Home Office Economics and Resource Analysis Group reported their analysis). The data analysed concerned the date of first re-arrest, but as mentioned above, did not take into account whether or not any of these re-arrests resulted in any further action. Hence there are no numbers available detailing how many of the NFA group who were re-arrested would have constituted a counterfactual claim from any suggestion they had committed an offence.
The analysis focuses on relative offending risk, which was defined to be the additional
probability that an individual in the NFA group is subsequently re-arrested for the first time since the original arrest, compared to the probability that an individual in the general public is arrested. To do this attention is drawn to the re-arrest hazard rate, here denoted by , which is the probability that,
conditional on re-arrest not having occurred by time , it will occur in the next unit of time, where time is measured in units of years. In formal notation, denoting the number of years from
initialisation of the study as , and the number of years until the next arrest as , the hazard rate is a
function of 0 and defines the conditional probability .
To estimate the hazard rate the proportion of the NFA group re-arrested who had not previously been re-arrested was calculated for each year or part year. This was done on a monthly basis for the first year and then on a quarterly basis for a further two and a quarter years. Once an individual in the NFA group was re-arrested they were removed from the analysis, leading to the sample size of the NFA group being reduced accordingly. This empirical proportion was then used to represent the probability of re-arrest as a function of time lapse from initial arrest. Table 1 provides the raw data obtained by the Home Office concerning the quarterly numbers of re-arrests for the NFA group.
TABLE 1 Home Office data detailing the number of re-arrests per quarter for the NFA group following an initial arrest in April 2006. The columns refer to the time in years following initialization (Years), the number of the NFA Group re-arrested within that quarter (Arrested), the size of the NFA group without re-arrest at the beginning of the quarter (Sample), the resulting observed hazard rate on a quarterly scale (Q. Obs. Hzd), and the annualised value of the hazard rate (Ann. Hzd).
Years Arrested Sample Q. Obs. Hzd Ann. Hzd
0.25 1,500 17,239 8.7% 30.5%
0.50 990 15,739 6.3% 22.9%
0.75 772 14,749 5.2% 19.3%
1.00 618 13,977 4.4% 16.5%
1.25 523 13,359 3.9% 14.8%
1.50 441 12,836 3.4% 13.1%
1.75 364 12,395 2.9% 11.2%
2.00 334 12,031 2.8% 10.7%
2.25 313 11,697 2.7% 10.3%
2.50 237 11,384 2.1% 8.1%
2.75 234 11,147 2.1% 8.1%
3.00 218 10,913 2.0% 7.8%
The observed hazard rate is only indicative for the quarter under consideration and is easily calculated as the number of re-arrests observed within a quarter divided by the sample size of the NFA group at the beginning of that quarter. However, to determine a hazard rate for when time is measured in units of whole years, rather than on a quarterly basis, the observed hazard rate must be ‘annualised’. This is achieved by assuming the observed hazard rate for the quarter under
consideration remains constant over the next successive three quarters, allowing the annualised hazard rate to be found by subtracting the fourth power7 of the observed success rate from 1 (where the success rate is 1 minus the hazard rate). For example, at the beginning of the fourth quarter from initialization of the study there were 13,977 members of the NFA group who had not been re-arrested, whilst it was also observed that within the fourth quarter 618 members of the NFA group were
re-arrested. This results in an observed hazard rate of 6 0.0 , or approximately 4.4%, and
hence the annualised hazard rate is found to be - -6 0. 6 , or approximately 16.5%. For the first year after arrest, the estimated hazard rate of the NFA group was taken to be the annualized version of the proportion of the NFA group who were found to have been re-arrested within a given quarter, as explained above. However, beyond this initial year the estimated hazard rate was calculated by fitting a power-curve regression to the data. This required assuming that as a function of time elapse from initialization of the study, the hazard rate was of the parametric
form , where 0 and 0 are unknown parameters estimated from the data. In the case of the re-arrest analysis, and were found to be approximately 0.166 and -0.686, respectively.
This means that, for example, an individual in the NFA group who had not been re-arrested for a
period of two years, would be considered as having probability 0. 66 -0.6 6 0. 0 of being arrested in the upcoming year, or 10.3% (note that in this instance Table 1 provides the same result),
7
This formula results because the probability of arrest not occurring in a given year is equivalent to the
product of the probabilities of arrest not occurring in each of the four quarters of that year, each of which is
calculated as the observed hazard rate on the quarterly scale, hence requiring the calculation of the fourth power
whilst an individual who had not been re-arrested within a six year period, would have probability 0.049 or 4.9% of arrest in the seventh year from initial arrest.
To compare this hazard rate with that of the general population an all-person comparator was estimated using data on national arrest rates. However, to take into account differences between the demographic profiles of the NFA group and the general population (where on average the NFA group is younger and more likely to be male), the arrest risk of the general population was weighted so as to give the same age and sex characteristics. Additional approximations also had to be taken into
account as the available data only listed number of arrests, not numbers of unique individuals arrested, but once such issues were taken into consideration, an estimated constant hazard rate of 4.8% was suggested as the Home Office’s all-person comparator value8.
The model for the hazard rate of the NFA group was then fitted using data up to 3.25 years beyond April 2006, and in particular, using the 11 quarterly annualized estimated hazard rates concerning the proportion of re-arrests in the NFA group between 0.75 years and 3.25 years after arrest (the quarterly re-arrest proportions for three months and six months after initial arrest were found to be incompatible with the smooth power-curve assumption for the hazard rate). The fitted curve was then used to estimate the re-arrest hazard for the NFA group for a further 4.75 years, resulting in an estimated hazard rate for a total of 8 years following initial arrest.
The results of the analysis are shown in Fig. 1, where it can be observed that there was a high risk of initial re-arrest of the NFA group that dropped sharply in the first year (dropping from approximately 33% to 17%). There was then found to be a diminishing reduction in re-arrest hazard over the subsequent 5 years until equality with the all-person comparator is found approximately 6 years after initial arrest (though as the Home Office report accepts, the intersection in the hazard rate between the NFA group and the all-person comparator occurs at a part of the fitted hazard curve that is relatively flat, making the precise intersection point a sensitive conclusion). Beyond 6 years after
8 Note that for the conclusions and arguments presented here it is not necessary to provide further
information concerning how the particular figure of 4.8% was obtained, though the interested reader is directed
initial arrest, the NFA group were found to be of reduced risk in comparison to the general population. No data was available to indicate what proportion of those re-arrested within the first year had been re-arrested because of a match of their DNA profile with historic crime scene stains, or because of administrative offences such as the violation of bail conditions.
FIG. 1. The Home Office estimated hazard rate of future arrest of members of the NFA group (solid) and the All Person comparator (dashed). The circle points indicate the observed annualised re-arrest rate, whilst the vertical lines mark the beginning of inferring the hazard rate through a parametric model and the end time of observing the NFA group, respectively.
The assumptions of a parametric hazard rate
Recall that in the case of the NFA group a parametric form was assumed for the hazard rate, whilst in the all-person comparator this was assumed to be a constant and independent of
. The former is a generalisation of the latter and would also reduce to a constant form if it was
estimated that the parameter was 0. However, under the hypothesis that the parametric model is
indeed correct, the estimated probability that is 0 is approximately nil, meaning that there is little if no evidence that the hazard rate in the case of the NFA group should be constant. Nevertheless, whilst the data supports this conclusion for the NFA group, there is no empirical justification for the assumption that the alternative situation occurs in the case of the all-person comparator.
Either of the assumptions of a constant hazard rate or of a parametric power-curve is common within reliability, survival, failure, or extreme event analysis, but they arise in differing situations9. The study of reliability or survival analysis is a branch of statistics that is regularly used to predict time to failure in mechanical systems, or the future lifetime of a biological specimen etc. (an alternative name sometimes used in the social sciences is duration analysis). In general, this topic seeks to determine the time to a future ‘event’, where here the event of interest is arrest, and the
fundamental object that enables such a prediction is known as a survival function.
A survival function details the probability that the event of interest will occur beyond some specified time for all . Alternatively, and equivalently, interest may lie in the lifetime function, which specifies the probability that the event of interest will occur prior to the specified time
, and as such, is 1 minus the survival function. The associated hazard, which as described above is the probability of the event occurring in the next unit of time given that it has not already occurred, can then be derived mathematically from either the survival function or the lifetime function10.
In the case of a constant hazard rate, as was used for the all-person comparator, this arises from the assumption that the time to event (arrest) follows an Exponential distribution, which is an appropriate assumption for systems or objects which do not degrade or wear over time, and arises
9 S
INGPURWALLA,N.D.,RELIABILITY AND RISK:ABAYESIAN PERSPECTIVE (Wiley) (2006).
10 The precise formula states that the hazard rate is minus the ratio of the derivative of the survival function
naturally when the times between events occur continuously and independently at a constant average rate. The parametric hazard rate assumed for the NFA group, however, results from the assumption that time to arrest follows a Weibull distribution11, which under Extreme Value Theory, is an appropriate assumption when a failure occurs as a result of the first of a number of competing and comparable independent processes failing.
In an engineering context, the Weibull assumption would be appropriate for predicting the future lifetime of a machine that consists of a series of independently functioning components, and where the machine would only continue to operate whilst all of its components continued to be in working order. If the lifetime of any particular component was independent of the lifetime of any other component, and if the lifetimes of those components were not too dissimilar, then the Weibull modelling assumption would be an appropriate representation of uncertainty in the future lifetime of the machine. In the context of failure being equated with arrest, an analogy might be suggested whereby arrest will occur following suspicion of the commission of any number of crimes that might be committed, and so long as the collection of expected times to arrest for the range of possible suspected offences are not too dissimilar, and that suspicion of offence is independent of suspicion of any other offence, then the use of the Weibull distribution might hold justification. It should be noted, however, that the assumption of independent suspicions concerning the commission of a crime, and that there is similarity in the expected times until being suspected of any of a collection of possible offences, are both questionable and without empirical support.
Nevertheless, the use of two different modelling assumptions would imply that the underlying process leading to arrest differs between the NFA group and the general population, and would appear to suggest that the act of being arrested without subsequent caution or conviction fundamentally alters the assumed behaviour of that person (we return to this consideration later when discussing
probabilistic causality). This is despite such individuals as represented by the NFA group being entitled to the description of holding ‘good character’ within court scenarios.
11 W
EIBULL,W., "A Statistical Distribution Function of Wide Applicability", Transactions of the American
Formally, setting the present as time 0 and letting denote the unknown future arrest time of an
individual, the assumption that follows an Exponential distribution, as is the case in the all-person
comparator, is equal to stating that the probability density function12 for is , with 0 a rate parameter to be specified13, or analogously, that the probability of future arrest occurring prior to time (the lifetime function) is . In the case of the Home
Office analysis, the value of is 0.049, meaning that the expected value of , or in other words the
expected time to arrest, would be 20.4 years, and that 0. , i.e., it is more likely than not that an individual would be arrested within a fifteen year period.
In the case of the NFA group, the power-curve assumption for the hazard rate is equivalent to
stating that follows a Weibull distribution, which in turn implies that the probability of arrest
occurring before time is , with and parameters to be specified. Whilst this equation may appear complicated, it allows calculation of the expected time to
arrest. In the case of the Home Office analysis the parameters and are found to be 0.314 and 7.614, respectively, leading to an expected future arrest time of 57.9 years. This is the case despite the model suggesting 2 0. , i.e., at point of NFA decision, it is more likely than not that an
individual in the NFA group would be re-arrested within two years, whilst the probability for re-arrest within the next six years is approximately 0.66. Fig. 2 plots the assumed Weibull and Exponential
12 Without referring to a technical mathematical definition, a ‘probability density function’ describes the
relative likelihood or probability that a continuous random variable will take a specific value. Whilst the actual
probability of any given possibility will be 0 (as there are an uncountable infinity of such possibilities for a
continuous variable), it does allow calculation of the actual probability that the variable falls in a specified
region or space. It is the analogous counterpart to standard probability values which arise in the case of a
random variable taking only discrete possible values.
13 The term refers to a well known mathematical constant, namely Napier’s constant, and its value is 2.
to three decimal places (though as an irrational number its precise value can not be expressed in the decimal
survival functions which result in the fitted hazard rates for the NFA group and the all-person comparator, respectively.
FIG. 2. The survival functions arising out of the estimated parameters in the case of the Weibull distribution as used for the NFA Group (solid) and the Exponential distribution as used for the all-person comparator (dashed).
This would at first appear a rather remarkable result. In effect, the fitted hazard rates for the NFA group and the all-person comparator, as seen from the initialization of the experiment in April 2006, indicate that the expected (average) future arrest date of a member of the NFA group is over twice that for an individual represented by the all-person comparator. Hence, if offending risk was not defined by the probability of arrest in only the next year, but instead took into account the probability of arrest in all future years, it could be argued that the NFA group constituted a reduced risk of offending. Furthermore, it indicates that, from the time point of initial arrest, more than half of the NFA group would be re-arrested within two years of initial arrest14, in which case their DNA
14 Only approximately a third were actually observed to be re-arrested during this period, and this
profile would again be obtained, a consideration that appears not to have been taken into account when suggesting a blanket retention period of 6 years.
This result is obtained because beyond 6 years the hazard rate of the NFA group continues to decline, whilst for the all-person comparator it remains constant and higher than that of the NFA group. This of course requires use of the fitted model for all future times, when the data analysed only corresponds to re-arrest proportions in a 3.25 year interval. Yet, they are the conclusions that can be drawn from the assumed form for the fitted hazard rates, and it is noted that, when formulating conclusions concerning equality of hazard at approximately 6 years into the future, the Home Office analysis does extrapolate the fitted hazard rate for a further period greater than that for which there are data available. Indeed, in discussing any hazard rate beyond 2.25 years following initial arrest, it must be highlighted that we are discussing the conditional probability of an individual who had not been re-arrested for 2.25 years being subsequently arrested in the following year, yet no person in the NFA group was monitored for more than 3.25 years.
Modelling time to arrest
To determine an appropriate distribution model for future lifetime (here time until arrest), various considerations should be taken into account. For example, are there physical or theoretical reasons why future lifetimes should follow a given distributional form, or does a particular model offer a reasonable fit to the data? In the case of the Home Office analysis, a parametric assumption is required for two particular reasons. Firstly, the analysis only monitored the NFA group, and did not track a selection of individuals similar to that group who had no prior arrest record. This is likely to have been the case due to logistical, privacy, and expense concerns, but it means that any elicited hazard rate for the all-person comparator would have to be independent of the time since initialization of the study, and hence a constant.
the hazard rate beyond the first year of arrest, whilst the conclusion reported here is based on using the fitted
Secondly, the monitoring of the NFA group was only over a 3.25 year period, and so any discussion of changes in this rate beyond that time requires extrapolation of a defined curve. Common alternative approaches in reliability analysis which do not assume that either the survival function or the hazard rate follows a defined family of mathematical forms are known as
nonparametric analyses. The most common of these is the Kaplan-Meier estimator15, where only the observed data are taken into account, and the lifetime variable is not assumed to follow any particular mathematical form. Another notable example is that of Nonparametric Predictive Inference (NPI)16.
Generally, such nonparametric approaches result in a series of horizontal and vertical steps of declining survival probability over time that would repeatedly intersect any smooth curve resulting from a parametric assumption for survival probability. Unfortunately, however, whilst such
nonparametric analyses allow the ‘data points to speak for themselves’, their use in predicting future survival probability would be of limited use for determining a re-arrest hazard rate. In the case of the Kaplan-Meier estimator, beyond the end of the observation period the survival function would be estimated to remain as a constant, meaning that the derived hazard rate for any time beyond the monitoring period would be 0.
In the case of NPI, this is a generalisation of the Kaplan-Meier estimator that only provides bounds on what the true survival probability would be by explicitly taking into account any absence of additional information. Whilst the lower bound for survival probability beyond the monitoring period would be 0 (meaning that all individuals have been arrested), the upper bound would again be a positive constant. Hence NPI would suggest that the derived hazard rate could be any value between 0 and 1, and as such, is simply stating that in the absence of any data concerning the hazard rate beyond 3.25 years following initialization of the study, all that can be said is that it can take any valid value, and that nothing else should be stated concerning the likelihood of any particular value.
15 K
APLAN,E.L. AND MEIER,P., “Nonparametric Estimation from Incomplete Observations”, Journal of the
American Statistical Association 53 (1958).
16 C
OOLEN,F.P.A AND YAN,K.J., “Nonparametric Predictive Inference with Right-Censored Data”, Journal
The actual Weibull distribution that was used for the NFA group is a distributional form that is so flexible it is likely to provide a reasonable fit to many small sample failure data sets (note here that although the NFA group consisted of 17,239 individuals, it was actually fitted using 11 quarterly failure proportions, and as such, should be considered as a data set consisting of only 11 data points). However, the conclusions that can be drawn over the monitoring period would not be very different if alternative parametric forms were considered, e.g., a log-normal distribution, but these would lead to substantially different conclusions when extrapolating into the future or when considering the underlying assumptions concerning the offending behaviour of the NFA group. Indeed, ignoring the first year of re-arrests (which may be due in part to matches of DNA profiles with the crime scene database or because of administrative offences such as violations of bail conditions), even the assumption that the hazard rate declines in a linear fashion would not provide a very unreasonable fit to the data, and would indicate that equality between the NFA group and the all-person comparator would occur much sooner than the estimated 6 years following initial arrest.
Hence, because many different models may well provide a reasonable fit to the observed data, but would result in very different conclusions when extrapolating beyond the monitored period, it becomes very important to focus on the theoretical justification for any proposed parametric form. For the all-person comparator a constant hazard rate was considered, and as discussed previously, this is the appropriate model if the likelihood of arrest was not affected by the passage of time. For the Weibull distribution this is not the case, and the likelihood of arrest will be affected by the passage of time. However, one possibility that does not appear to have been explored, but which might hold greater theoretical justification, is the existence of different groups in society that are subject to differing hazard rates for arrest.
For the all-person comparator there was an implicit assumption that the hazard rate was
independent of the passage of time, and this was generated by assuming that the unknown future time of arrest followed an Exponential distribution with a parameter 0.0 . Hence one possibility
is to model the future arrest time of a member of the NFA group as being Exponential with
parameter with probability , or otherwise as being Exponential with parameter 2 . In
risk than the members of the non-arrested population (the law-abiding ‘good’ people in the NFA group), or would otherwise constitute a greater offending risk, but one that is also independent of time say the ‘not-so-good’ people or those more inclined to criminal behaviour). For reference we will
label these sub-groups as NFA-G1 and NFA-G2, respectively.
Such a ‘mixture model’ does not generate a constant hazard rate, and so could provide a
reasonable fit to the re-arrest data that was provided by the Home Office. For example, the shape of the curve would be expected to follow that of the observed data in that there would be an expected sharp initial drop in the re-arrest hazard of the total NFA group due to the re-arrests within the sub-group that constituted a greater offending risk (NFA-G2), followed by a diminishing reduction in the re-arrest hazard as the number of individuals within NFA-G2 dwindled, leaving only individuals who are no different to the general un-arrested population (NFA-G1) remaining in the NFA group.
Moreover, regardless of how far into the future the ‘mixture model’ is extrapolated, the hazard rate for the NFA group would converge asymptotically to the hazard rate for the all-person comparator. This is in contrast to that found under the assumption of a Weibull distribution, where a reduction in risk of the NFA group compared to the all-person comparator occurred beyond 6 years after initial arrest. Furthermore, the immediate re-arrest hazard, i.e., the hazard at time 0, or time 0 plus some small amount, would be finite under the ‘mixture model’ and would be the weighted average of the parameters of the two Exponential distributions, i.e., 2. Again, this is in contrast to
the assumption of a Weibull distribution, where the immediate hazard is undefined at time equal to 0 and is exceptionally large for small time points, hence explaining why the Weibull model was only fitted using data at least 0.75 years from initial arrest.
A fit of such a ‘mixture model’ that was also based on using only the 11 quarterly re-arrest proportions between 0.75 years and 3.25 years following initial arrest is shown in Fig. 3. The fitted ‘mixture model’ was found to have parameters 0. 2 and 2 0. , resulting in a conclusion
Whilst we are not seeking to advocate the use of this or any other particular model (in fact a mixture model with more than two sub-groups would provide an even greater fit to the data), we do wish to highlight how the parametric form can be altered so as to still fit the model, but such that very different conclusions would result. Unfortunately, applying such a mixture model in practice would require additional information in order to classify a member of the NFA group as belonging to one sub-group or another, for all that is recorded in the Home Office data is the fact of their historic arrest in April 2006. Nevertheless, we are able to track the probability of group membership over time following initial arrest, and the 72% chance of belonging to type NFA-G1 is only true at the point of NFA decision. Once additional information is available concerning re-arrest not having occurred by a certain time, the probability of being of either type NFA-G1 or NFA-G2 will change.
FIG. 3. The Home Office estimated hazard rate of future arrest of members of the NFA group (solid), an alternative model based on a ‘mixture’ of Exponential distributions dotted and the All Person
Noting that the mixture model assigns one of two possible parameters for the Exponential distribution (depending on which sub-group of the NFA group the individual belongs to) the
probability of re-arrest not occurring by time is determined once sub-group membership is known. However, this relationship can be reversed through Bayes’ Theorem17
so as to allow calculation of the probability of sub-group membership given that re-arrest has not occurred by time , and Fig. 5 plots
the probability of belonging to sub-group NFA-G1 (the sub-group that has the same arrest risk as that estimated for the un-arrested population).
FIG. 4. The survival functions arising out of the estimated parameters in the case of the Weibull assumption for the NFA Group (solid), the Mixture Exponential alternative (dotted), and the all-person comparator Exponential distribution (dashed).
17 Bayes’ Theorem concerns the relationship between conditional probabilities; in particular, for two events
and where the conditional probability of occurring given that has occurred is denoted as , the
conditional probability of occurring given that has occurred is . In the
context of sub-group membership, given that arrest has not occurred by time , the above formula can be used
by equating event as membership of sub-group NFA-G1, and as the event that re-arrest has not occurred by
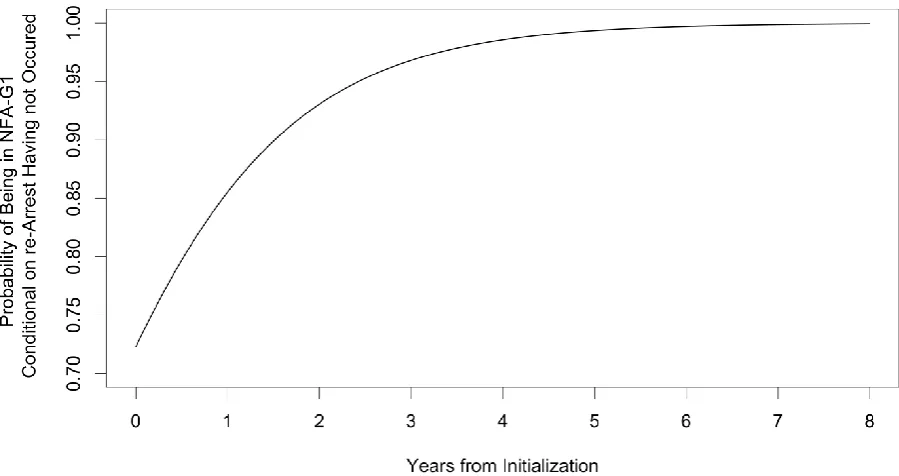
Fig. 5 demonstrates that the longer the time delay until re-arrest, the more likely the individual is to be of the same arrest risk as the general population, with the curve asymptotically approaching a probability of 1. In the context of deciding a retention period of DNA profiles, of particular interest may be the time taken before an individual has a 95% chance of being a member of NFA-G1 (as this is often considered a statistically significant probability) and this is found to be 2.42 years. After 6 years without re-arrest the individual has a 99.7% chance of being of sub-group NFA-G1, whilst if we wished to know when, on the balance of probability, an individual is more likely to be of sub-group NFA-G1 then of NFA-G2, it should be noted that even at time of NFA decision, the probabilities are 72% and 28%, respectively.
FIG. 5. The probability arising from the mixture Exponential model of a member of the NFA group belonging to sub-group NFA-G1 (the sub-group that behaves like the un-arrested population) as a function of time elapsed since NFA decision without subsequent re-arrest.
Finally, we wish to highlight that the fitting of any parametric curve requires making the
assumption that the future times to arrest for all individuals within the NFA group are exchangeable. Note that two random variables and are exchangeable if and only if, for all values and , the
[image:23.595.74.524.322.560.2]more than two random variables). As such, exchangeability is an assumption of symmetry that is often suitable in situations where draws are randomly taken from a population (which can be finite or infinite), hence making it an appropriate assumption in many situations. Indeed, the common
statistical assumption of sampling independent and identically distributed random variables would clearly result in exchangeability, but so would sampling without replacement, which is not
independent.
However, to assume exchangeability of the future arrest times of the NFA group, or of any further individual that the model is used to predict future arrest time of, requires ignoring any additional information relating to that person. Whilst exchangeability is common within reliability analysis, there is often good cause for this. For example, exchangeability would be reasonable when considering the future lifetime of a collection of light bulbs all manufactured in the same process by the same machine. However, in the context of arrest, it is unlikely that additional information can not be obtained which would be informative of when a future arrest is likely to occur, and so when predicting the future arrest of a new individual who is subject to a NFA order, the use of the Home Office model would require ignoring all aspects of that person other than the fact they had been previously arrested and NFA was taken.
Probabilistic causality
Combining the Home Office models for the NFA group and the all-person comparator leads to a generic model for the hazard rate of the entire population of non-convicted individuals. Such a generic model can be generated by including an indicator event that takes value 1 if a person has been previously arrested without caution or conviction, and takes value 0 otherwise. The hazard rate
can then be considered a function of not only time from initialization of the study, but also a function of the value of the indicator that is relevant for the person under consideration.
Remembering that a hazard rate fundamentally represents a conditional probability, i.e., the
the binary event . Hence in the generalized version, the hazard rate will be greater for all between
0 and 6 if , whilst it would be reduced for all 6 if .
The status of a probability being greater depending on whether or not a conditional event has occurred is the subject of the theory of probabilistic causality18. Traditional causality can be generally thought of as constituting one of four general notions19, i.e.¸ materialist (based on the laws of
physics), spiritualist (the act of a supernatural being), rationalist (the relation between reason and consequence), and phenomenalist (empirical observation or association between successive events). This latter phenomenalist approach to causality underlies the support the Home Office Analysis provides in any formulation of policy, but it is also the approach that supports a probabilistic quantification of causality.
An event is said to be a prima facie (at first sight) probabilistic cause of another event if
event occurs prior to event , if the probability of event ’s occurrence is not zero, and if the probability of event occuring is greater if event did occur. Hence, under this definition, we see
that using the model employed in the Home Office analysis a historic arrest resulting in NFA (event ) would constitute a prima facie probabilistic cause of future arrest (event ) for up to 6 years after the occurrence of the initial arrest.
Nevertheless, a prima facie probabilistic cause may be due to a confounding factor, and may not be a genuine probabilistic cause. Confounding occurs when correlation is mistaken for causation, and such occurrences lead to spurious causal relationships. A typical example would be the relationship between alcohol consumption and lung cancer, where it can be observed that lung cancer rates increase as alcohol consumption increases. Yet the consumption of alcohol is not a causal effect but is instead a confounding factor. Actually the relationship is explained by the act of smoking, where an increase in alcohol consumption is correlated with whether or not an individual smokes, whilst it is the act of smoking that is a causal effect of contracting lung cancer.
18 S
UPPES,P.,APROBABILISTIC THEORY OF CAUSALITY (North-Holland) (1970).
19 L
INDLEY,D.V. AND SINGPURWALLA,N.D.,"On Exchangeable, Causal and Cascading Failures", Statistical
To account for this a definition of a spurious prima facie probabilistic cause is as follows. Let events and be as before. The event is said to be a spurious cause of if there exists an
additional event that occurs prior to , is such that and can both occur, and that the probability of ’s occurrence is independent of the occurrence of if does occur. Hence in the case of the
Home Office analysis, prior arrest with NFA (event ) would be a spurious cause of future arrest
(event ) if taking into consideration an alternative factor (event ) would account for the re-arrest rate just as effectively. For example, it was highlighted in the Home Office analysis that arrest rate was higher for men than for women, and so a model that takes into account gender, and possibly also age and socio-economic factors, might show a prior NFA decision as a confounding variable for a generalised hazard rate. Furthermore, as there are a vast number of such latent factors that could render a prior NFA decision as spurious, it is unlikely to be a genuine probabilistic cause of future arrest. Unfortunately, however, such data is not yet publicly available.
Summary
To summarise we return to the focus of the analysis, i.e., does the Home Office Re-Arrest analysis actually provide statistical evidence that there is increased offending risk of individuals holding a historic arrest status where no further action was taken, even if this is for only six years after the occurrence of that arrest? It is our view that the Home Office analysis falls short of achieving this goal, and that any conclusions drawn should be considered in relation to the reasonableness of the underlying assumptions that are either explicitly or implicitly required.
whilst it is not our intention to specifically advocate the use of any particular model, it should be noted that if the mixture-Exponential model is true, the vast majority of the NFA group are being inappropriately labelled as constituting an enhanced risk of committing a future offence.
4. Possibilities for the Future
The collection and appropriate analysis of data in formulating national policy or guidelines is
undoubtedly important, however, the use of such a statistical analysis as provided by the Home Office in suggesting heightened offending risk of an individual who holds no caution or conviction is
controversial, especially as the retention of DNA is a contentious issue. In the case of the retention of DNA profiles for individuals who have not been cautioned or convicted, current legislation only specifies that Constabularies may retain DNA profiles for at most 6 years following arrest, yet other than guideline policy, there is no legal obligation for such data processing.
Nevertheless, and as has occurred previously, any judicial review against a decision to enforce this policy in a particular setting is likely to focus on the statistical arguments justifying the evidence base for retention, for Article 8 of the European Convention of Human Rights specifies that there shall be no interference by a public authority with the exercise of the right to respect for the private life of an individual except such as is “necessary” in a democratic society in the interests of (in this instance) the prevention of crime. So the question remains whether such retention is necessary, and whether it strikes a fair balance between the competing public and private interests?
There has recently been a steady rise in academic interest concerning the use and interpretation of probabilistic and statistical arguments by objective organisations such as Government departments, criminal justice agencies, law courts etc. Notable examples for court scenarios include the
interpretation of statistical evidence20, the misuse of assumptions in expert analysis21, the evidence of
20 A
ITKEN,C.G.G., “Interpretation of Evidence, and Sample Size Determination”. In GASTWIRTH,J.L. (Ed.),
STATISTICAL SCIENCE IN THE COURTROOM (Springer) (2000).
21 K
guilt following a positive DNA match22, the meaning of ‘reasonable doubt’ and whether this can be quantified23, and the appropriateness of jury size and conviction rule considering the probability of the same jury result if another jury were selected from the overall population24.
Such issues regarding the application of statistical arguments by objective review panels arise because of their unique context whereby statistical evidence should be both empirical and logical. The authors agree with the following definition25 for these norms:
Empirical: Objective inferences should not disagree with empirical evidence.
Logical: If there is no information suggesting that one possible outcome is more likely than another, then this should be reflected by identical uncertainty quantifications for these outcomes.
As such, the use of popular statistical techniques such as the inclusion of a subjective prior in the case of Bayesian inference26, or the use of common distributional forms because of ease of simplicity or a subsequent reduction in computational burden, would be inappropriate, despite being either grounded
22
SJERPS,M. AND KLOOSTERNAM,A.D., “Statistical Aspects of Interpreting DNA Profiling in Legal Cases”
Statistica Neerlandica 57 (2003).
23 T
ILLERS,P. AND GOTTFRIED,J., “Case Comment – United States v. Copeland, 369 F. Supp. 2d 275
(E.D.N.Y. 2005): A Collateral Attack on the Legal Maxim that Proof Beyond a Reasonable Doubt is
Unquantifiable?” Law, Probability and Risk 5 (2006).
24 C
OOLEN,F.P.A.,HOULDING B. AND PARKINSON S.G., “Considerations on Jury Size and Composition
using Lower Probabilities” Journal of Statistical Planning and Inference 141 (2011)
(doi:10.1016/j.jspi.2010.06.014).
25 C
OOLEN,F.P.A., “On Nonparametric Predictive Inference and Objective Bayesianism” Journal of Logic,
Language and Information 15 (2006).
26 B
with a solid axiomatic foundations or having an applicability in approximating a wide variety of situations.
Unfortunately there is as yet no universally agreed mathematical method of expressing
uncertainty that is objective, and despite numerous attempts throughout the history of statistical study, this remains the fundamental goal of research in statistics. Various solutions have been proposed, e.g., frequentist analysis27, objective Bayesian analysis28, or imprecise probabilistic analysis29, yet all fall short of achieving the goal of providing a statistical framework that is objective, can be readily applied, does not suffer from paradoxes following irrelevant transformations of the data, or guarantees in providing a precise answer (though the aforementioned NPI might be one approach that can be successfully applied so long as it is accepted that only vague, or even vacuous, inferential statements might result because that is all that can be derived from the actual data). In the case of policy development or legal interpretation, the problem is further expanded in that the details of such statistical arguments should be of a nature that they can be readily understood by ministers, civil servants, judges, legal teams and jurors etc.
In the present case it is observed that an exchangeability assumption was implicitly used to fit a parametric model. This required acceptance that the parametric model is an adequate description of the uncertainty in the future arrest time of a further individual, and that the parameters of this model could be estimated from the re-arrest times of alternative individuals. Yet, neither of these
assumptions would appear either empirical or logical, and certainly it is known that additional factors such as gender and age effect arrest rates. As such, there are a number of ways in which a further study could be specifically designed so as to remove doubt in its conclusions, and we now list some of these.
27 N
EYMAN,J., “Outline of a Theory of Statistical Estimation Based on the Classical Theory of Probability”,
Philisophical Transactions of the Royal Society of London A 236 (1937).
28 J
EFFREYS,H.,THEORY OF PROBABILITY (Oxford University Press) (1939).
29 W
An initial re-arrest ‘spike’ was problematic for the assumed Weibull distribution, yet this appears to be a common finding in studies concerning re-arrest hazard30. However, we have mentioned in passing that such a spike may be caused due to initial matches on the crime scene database, or possibly because of the commission of administrative offences such as violations of bail conditions. Such occurrences will disturb any fitted parametric model, and it would be very useful to know the proportion of early re-arrests that are due to such effects so as to diminish any resulting bias. Moreover, a recent study31 has provided evidence that Police Forces target certain individuals or groups who are known to them so as to enforce measures of social control, even if such individuals hold no historic record of caution or conviction. Whilst in our discussion of probabilistic causality we mentioned that the act of being arrested is likely to be a spurious probabilistic cause of future arrest, it does appear to be prima facie probabilistic cause. Yet, rather than relying on a supposed connection that is explained because of an increase in offending risk following arrest, the relationship might be because once an individual has been arrested, the Police will target, monitor, and seek to control the future social behaviour of that individual.
A key issue with the current analysis is that two different populations have been modelled using two different probabilistic rationales. Though we have highlighted that the observed data for the NFA group could be explained by assuming sub-populations that share the same probabilistic rationales as the all-person comparator, but with differing hazard rates, it would be appropriate to monitor a
‘control’ population of un-arrested individuals that shared common socio-demographic profiles as that
of the NFA group. Moreover, detailed knowledge of the socio-economic profiles of those subject to a NFA order would allow investigation into whether there do exist sub-populations with an offence rate being a function of covariates drawn from those profiles, e.g., age, class, ethnic profile, educational attainment etc., rather than assuming all members of the NFA group behaved in a similar way.
30
KURLYCHEK,M.C.,BRAME,R. AND BUSHWAY,S.D., “Scarlet letters and recidivism: Does an old criminal
record predict future offending?”, Criminology & Public Policy, 5 (2006).
31 M
CARA,L. AND MCVIE,S., “The usual suspects?: Street-life, young people and the police”, Criminal
Indeed, knowledge of the suspicion of the original offence leading to arrest would be of benefit so as to determine if certain types of suspected offences lead to increased re-arrest risk, and certainly the previous ruling in the ECtHR criticised the blanket nature of the application of the guidelines to DNA retention irrespective of the offences involved or a person’s circumstances.
Finally, it is well reported that there exists a distinctive relationship between the age of an offender and the commission of a crime known as the ‘age-crime’ curve , with a peak age of
conviction at approximately 18 years of age. Whilst it was accepted that the all-person comparator in the Home Office analysis sought to take into account this consideration by estimating an arrest rate for a group of individuals without historic arrest but which had the same age and sex profiles of the NFA group, the re-arrest times of the NFA group did not report or indicate the age of the member of the NFA group who was re-arrested. In particular, it was noted that:
“Separate arrest-to-arrest hazard rates for juveniles and those aged 18 and over were not
estimated from PNC data, because it was judged that this would result in error margins to our simulations which would be too wide to be useful for analytical purposes”
As such, it would be of benefit to observe the effect of constructing a hazard rate for each of a number of age-related individuals, e.g., for a pre-teen group, for a teenage group, for a young adult group, and for a senior adult group etc., though it is noted that this is likely to result in a suggestion that policy not only distinguish between adults and children, but also sub-categories of these classes.
Disclaimer
The views and opinions expressed in this paper are the authors’ own. They are not intended to represent any position or policy of the UK Home Office or any other Public Body or Non-Government Organisation.
Acknowledgements
The authors wish to express their gratitude to the UK Home Office for making available the original data used in its analysis. We are also grateful for the supportive comments and suggestions in the completion of this work that were provided by Frank Coolen of Durham University and by two anonymous referees.
Funding