Abstract— This paper focused on numerical modelling of metal rings subjected to fixed-end constant loading impacts. The mechanical parameters of loading reaction force and strain were analysed and visual data recorded. Different rate of loadings and ring thicknesses were studied to examine their impact on these factors. Hollow spheres were also similarly analysed. The deformation processes of both rings and spheres were analysed and discussed, particularly the mechanism of deformation and load and strain histories, and those of rings and spheres compared to one another.
Index Terms—Ring, impact loading, FEA, stain history, crush loading
I. INTRODUCTION
HIS paper analyses single metal rings under end-impact (rather than axial-impact) crush loading, particularly looking at deformation characteristics. Due to metal rings’ and tubes’ high energy absorption capabilities as they undergo plastic deformation, they have a practical application in crash protection structures. Furthermore, as evidenced by Shim et al [1], rings can be used as a simplified model for cellular material, allowing a range of biological and medical applications.
The main aim and intention of the research is to gain an understanding of the deformation process and mechanism that a single ring undergoes when subjected to end loading. It is also intended to look at hollow spheres with similar cross-sections and modelling conditions and compare their deformation to that of a ring. The research will use Finite Element Analysis (FEA) software to examine this hypothesis. To simulate, a simple 3-body model will be used, whereby a large mass (modelled as a rigid wire) will be given an initial velocity to act as the impact load, and this will crush a metal ring, in turn supported by another wire at the distal end. These results will then be analysed and the model altered accordingly to test different variables, these being different impact velocities, as well as different radius-thickness ratios for the ring.
Manuscript received Feb 15, 2019; revised March 31, 2019. The content of the paper has been modified on 18 July 2019.
Matthew Farr is with Mechanical and Aerospace Engineering Department, College of Engineering, Design and Physical Sciences, Brunel University London, UK
Bridget E. Kogo (corresponding author) is with Mechanical and Aerospace Engineering Department, College of Engineering, Design and Physical Sciences, Brunel University London, UK (e-mail: [email protected])
Bin Wang is with Mechanical and Aerospace Engineering Department, Design and Physical Sciences, Brunel University London, UK
Mahmoud Chizari is with School of Engineering and Computer Sciences, University of Hertfordshire, College Ln, Hatfield AL10 9AB, UK. He is also with the School of Mechanical Engineering, Sharif University of Technology in Tehran.
The actual deformation of a single metal ring under end impact has not been properly examined, although a mixture of experimental and theoretical analysis of deformation and stress wave propagation under impact loading exists for metal bars, rods and cylinders subjected to axial impact [2-4] and ring systems subjected to end impact [5-7]. Among the more significant studies are the latter, whereby a row of rings- in the same direction as the impact velocity- is either placed end-to-end or spot welded in place, in some cases with plates in between each ring to see how that effects the deformation of the system. The initial study in this field is Reid and Yella Reddy’s [5]. Although an examination of the effect of inertia is the main aim of this study and [7], stress waves and their propagation formed a distinct part of both studies, as do the features of the modes of deformation. Beyond studying the collapse of more complex cylinder systems, the ring systems studied in the article were simple, each being a single row of rings placed end to end on a horizontal plate, with the impact coming from a sledge. Reid and Bell [8] improved on a previous model (Reid, Bell and Barr [6], developed from [5]) by incorporating elastic waves, among other modifications. It’s upon this basis that Reddy, Reid, and Barr’s [7] attempted to build. The article introduced and adapted the previously developed methodology to be applied to free-ended systems in a manner similar to [5], also further refining the model developed through [6] and [8].
From [6], the use of high-speed cameras to record the deformation in visual detail was optimized so that the film could be analysed to more accurately calculate the varying velocity of the sledge. The rate of these cameras was also improved, producing 5000 frames per second. Further tests using strain-gauges on select rings on a different apparatus were performed, helping determine the speed that elastic waves propagate through ring systems.
Figure 1 shows examples of deformation in some of the ring systems. Unlike [5], this study focused on mild steel as the primary material, using brass for comparison in only 5/29 total tests ([5] used brass in 27/31 tests, in both annealed and ‘as received’ condition, with annealed mild steel for the remaining tests). The article also considered deformation in a single ring, attempting to model it from the pre-established theory.
One article examining the static effects on single rings being impacted is Reddy, Reid, Carney and Veillette’s [9], whose background relied heavily on the research published by Merchant [10], which defined and developed the concept of Equivalent Structures (Equivalent Structure Technique, EST, in [9]) to analyses plastic collapse problems.
Authors at [9] looked at rigid-perfectly-plastic materials and ones that underwent strain-hardening, a result of the initial plastic deformation. By considering the likely effects of
Matthew Farr, Bridget Kogo, Bin Wang, Mahmoud Chizari, Member, IAENG
Experimental and Numerical Modelling of
Metal Rings Subjected to Fixed-End Crush
Loading, and Comparisons with Hollow Spheres
strain-hardening, Reddy et al built a more realistic model, particularly at the plastic hinges. This was evidenced by results found agreeing reasonably well with those gathered experimentally, although it was noted that EST wasn’t perfect for replicating the collapse at the hinges, and a different or developed method would be necessary to provide an optimised model.
Figure 1- Deformation in various ring systems from [6], with impact end to the left and free end to the right. 1-5 maintain similar impact velocity, varying the number of rings. 6-9 have increasing velocities. 22 is brass rather than mild steel and features similar impact velocity to 7.
One example of a study examining loaded rings using numerical analysis is Liu et al [11]. This explores the stress wave propagation through ring systems, using both experimental and numerical methods. Using a split Hopkinson pressure bar test, the experimental section looked at single ring systems subjected to pulse loading, with a transmitter bar also acting as a fixed end for the systems. As in [7], the primary material was mild steel, although the rings were much thicker. Furthermore, the velocity was far lower, limited to 7 m/s to prevent any plastic deformation in the experimental set-up.
The numerical simulation also performed, here using LS-DYNA (LSTC) software, applied a 3-dimensional analysis for better accuracy. A quarter-model was used in these simulations, as symmetry allowed the authors to justify a simplified model. One finding was that the position and order of maximum deformation in a ring system was affected by the elastic stress waves’ reflection and superposition. Furthermore, this study helps to establish a basic methodology to be developed in a further study [12] while standing in its own right as an example of how rings subjected to loading can be analysed through numerical analysis.
II. FEANALYSIS
A. Numerical Analysis
A two-dimensional analysis approach was chosen, the advantage being that a much less complex mesh was required, thus greatly reducing computing effort. As the load was applied without any component in the z-axis (representing depth) and due to the ring’s geometry being constant through this axis, no variation in stress or strain would be expected in a 3rd dimension in a model anyway, unless it was introduced by an uneven mesh. Therefore, it was decided that the lack of 3rd dimensional analysis wouldn’t affect the accuracy of the results obtained.
A half-model was used, as under ideal circumstances a ring with perfect material properties and setup would
deform symmetrically if impacted by a flat, rigid object confined to moving along a single axis. Using a full model would have introduced the possibility of a non-symmetric mesh affecting the mode of deformation across the symmetric axis. In the x-y plane this half-model appears similar to the model used in [11] and [12].
A dynamic analysis was necessary for the impact loading. For this, Abaqus (Simulia, US) was used, as it allows explicit, dynamic solutions and is ideal for contact. The model consisted of three parts, making it relatively simple. The ring was sandwiched between two rigid walls; one an impact body, one a base anvil. The ring used shell elements with a thickness assigned. The base anvil had no material properties, merely acting as the fixed, distal end. The rigid wall could easily be defined, and it was deemed that the material properties needn’t be kept the same as the ring, so any inertial properties could be applied.
Mild steel was chosen to model the ring, and appropriate properties assigned. These initially included the most important properties of density and the elastic data, including the Young’s Modulus and Poisson’s ratio. From this, the plastic properties were added to improve the model’s accuracy, with the yield stresses and corresponding plastic strains used. The plastic region was defined as a simple linear relation. This wasn’t modelled on a specific grade of steel- it was an approximation of the material. Considering this, the model could be argued to lack accuracy, but the intention is simply to give a general look at mild steel, so the approximate values used were considered adequate. Furthermore, the material properties could easily be adjusted for a specific grade or different material if desired, so doesn’t affect the model’s basic quality. The properties were improved with rate-dependency, using the values in the Cowper Symonds model. To simulate the problem a model was created. No gravitational settings were applied, so this can be viewed as comparable to the sledge experiments in [5,7], especially as being two dimensional restricts z-axis deformation.
As the velocity would be constant and the simulation would therefore not come to an end with the complete deceleration of the impact mass (as per [5,7]), an appropriate time step would be applied to each model. The period that needed examining was the entirety of the possible crushing, until each ring was flattened but before direct compression of the material through the wall thickness. Therefore, the step was dependent on the specific ring dimensions and impact velocity, to allow full crushing.
[image:2.595.61.286.141.262.2]could be later tested was used. The ring dimensions were the same as those used predominantly in [5,7], largely to allow some initial comparison.
A quadrilateral mesh was used, as it was deemed to be best. To find the ideal number of elements, convergence was studied. Starting with an arbitrary number of elements around the circumference, an ideal number of elements through the wall thickness could be found. With this number of elements chosen, the number of circumference elements was optimized. The final mesh had 6 elements through the wall thickness and 540 around the inner and outer circumferences each.
B. Numerical Procedure for Ring Simulation
Initially, a range of different thickness-radius ratios and impact velocities was tested on single rings. The ranges of these parameters were 5 to 50 m/s impact velocity and a thickness-radius ratio of 1 to 10% (calculated as wall thickness T divided by outer radius r). Both looked at 10 even increments through their respective ranges.
The results required included a test condition to examine the full range of velocities on a fixed thickness. The thickness ratio (T/r) for this was set in the middle of the range at 5%, with the outer diameter measuring 50 mm. This diameter was similar, and so also comparable, to the size of rings used by Reid et al. It was also kept constant for all other tests, with different inner dimensions used to vary the thickness ratio when required. The results obtained from all experiments were the principal strains at each time step, as well as the reaction forces (RF).
The second series of tests involved varying the thickness-radius ratios on fixed velocities. The ratio was set for every value between 1 and 10%, and the three different velocities applied to each were 5, 25 and 50 m/s. This allowed comparison at certain velocities across the full range of thicknesses.
Once a simulation was run, the results were exported. The strain values were obtained using the integration points. Similarly, the reaction forces were obtained through the same method, but used the unique nodal positions rather than integration, as this was the only way to obtain RF. The maximum values of strain were recorded, and the element numbers of these maximum value locations were also recorded, so that the co-ordinates could be found, and the angular position of these maximum values tracked. For RF, the important value was that at the impact wire for each time step. Also, only the y-direction load was recorded, as the x-axis component would be cancelled out were the other half of the model taken into account.
C. Numerical Procedure for Hollow Sphere Simulation
Despite the significant change to the geometry of the shape being modelled, the basic model set-up appeared much the same. This is due to an axisymmetric approach adopted, meaning that a 2D analysis in the same manner as the rings could be performed on a cross section of the sphere. Importantly, this meant re-constructing each part as axisymmetric rather than two-dimensional shell elements. The same mass and inertia settings were applied as for the rings. The same material was used, with the same properties, as this had the obvious benefit of allowing direct comparison.
Compared to the procedure used for the rings, a reduced sample size was used. This involved a slightly reduced
range of thicknesses, ranging from 3 to 9%, and only at 2% increments. Also, although same range of velocities was used, only 5, 15, 25, 35 and 50 m/s impact velocities were used on the 5% thickness ring, with only 25 and 50 m/s were applied to all others. Otherwise, the general procedure was kept much the same for the spheres to how it had been for rings, with the same results taken in the same manner.
III. RESULTS
A. Rings model
This section shows select comparisons of rings simulated under different conditions in the parametric tests. Here, comparisons are made of a ring at a constant thickness being crushed at different velocities. A visual analysis is presented in Table 1, which shows select velocities applied to the 5% thickness ring.
Table 1- A visual comparison, showing rings of the same thickness (5%) being crushed at different velocities. The displacements shown are also equivalent to crush percentages of 20, 40, 60 and 80%
Figures 2 to 4 show specifically the 5% thickness ring, as this was tested with the complete range of velocities. All these velocities are displayed in the graphs, which show various features, these respectively being the maximum strain value, the maximum strain location, and two graphs showing the loading, all plotted against displacement. Further results were collated and compared for rings of different thicknesses being crushed at a constant velocity, namely 25 m/s.
Figure 2- Graph showing maximum strain values in a ring of 5% thickness being deformed at different rates, plotted against displacement
Cru
sh
(
%) Velocity (load rate)
5(m/s) 25(m/s) 50(m/s)
20
40
60
Figure 3- Graph showing angular possion of the ring (with 5% thickness) being deformed at different rates, plotted against displacement
Figure 4- Load displacement graph for a ring of 5% thickness being deformed at different rates
B. Hollow spheres model
This section shows select comparisons of spheres simulated under different conditions in the parametric tests. As with the rings before, comparisons were made of a sphere at a constant wall thickness being crushed at different velocities. Here however, spheres of different wall thicknesses being crushed at a constant velocity (25 m/s) are compared. Table 2 shows a selection of these from the range of thicknesses, while Figures 5 to 7 show the graphical data from the full range of thicknesses.
[image:4.595.307.538.50.171.2]Table 2- Visual comparison, showing spheres of different thicknesses being crushed at the same velocity (25 m/s)
Figure 5- Graph showing maximum strain values in spheres of various wall thicknesses being deformed at a rate of 25
m/s, plotted against crush percentage
[image:4.595.49.280.54.160.2] [image:4.595.46.281.201.321.2]Figure 6- Graph showing angular possion in spheres of various thicknesses being deformed at a rate of 25 m/s, plotted against crush percentage
Figure 7- Load crush percentage graph for spheres of various wall thicknesses being deformed at a rate of 25 m/s
C. Rings vs. Spheres Comparisons
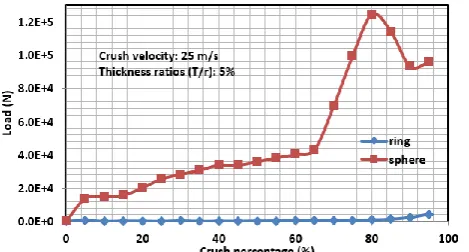
This section shows results comparing the deformation process of rings and hollow spheres. Figures 8 and 9 show graphical data of a ring and a sphere of equal wall thickness ratios and with the same loadings (5% and 25 m/s), for strain and load respectively.
Figure 8- Graph comparing the maximum strain values for a ring and hollow sphere
Cru
sh
(%
) Thickness ratio (T/r)
3(%) 5(%) 9(%)
20
40
60
[image:4.595.305.535.222.336.2] [image:4.595.308.537.376.495.2] [image:4.595.54.285.518.767.2] [image:4.595.310.538.619.732.2]Figure 9- Graph comparing the load crush displacement curves for a ring and hollow sphere
IV. DISCUSSION
A. Rings Mode of Deformation and Comparisons
One of the clearest observations that can be made from the visual data of the rings is that many experience a ‘bounce’, whereby the lower region lifts away from the base wire for a period of time. This leaves none of the ring in contact with the fixed end, meaning that the ring is being freely pushed by the impact wire with no resistance other than the ring’s own inertia. It appears that the bounce is a function of the impact velocity and ring thickness, as its onset and duration seems dependent on both. For most ring thicknesses there is little or no bounce at the 5 m/s impact velocity, whereas 25 m/s results in a moderate bounce and 50 m/s a large one. This is large in that the bottom of the ring travels a further from the fixed end and the bounce lasts longer. The wall thickness seems to impact the bounce, reducing its severity as the thickness is increased. The thinnest rings are particularly reactive, as even at 5 m/s the 1% thickness ring clearly bounces at 20% crushing.
Figure 2 shows that the strain values for all crush velocities follow a similar trend. As velocity is increased, strain reaches a slightly higher initial value. This strain immediately stabilises, with the higher velocity cases remaining most stable while others gradually increase. This stable region lasts the majority of the deformation, with the final period beginning an exponential strain rise. Here, higher velocity cases have a deeper curve. The exceptions to all this are the two lowest velocities, which have considerably different strain processes.
The same trend is familiar to other ring thickness ratios too, although the thicker rings record a higher strain value for the stable region and have shallower curves than those of thinner rings. Both the very thinnest and very slowest cases show noticeably higher strain values at the final time step (complete crush), whereas all other cases are relatively similar in this respect.
The angular positions of these maximum strain values are more complicated, with little in the way of a clear trend. What is clear is that approximately the final third of the deformation process results in maximum strain occurring at 0°, this being the hinge located at the side and level with the ring’s centre. The majority of other locations are at or close to the very top and bottom of the ring. This relates to the initial compression of the top-most section and the subsequent dip that occurs both at the impact and distal ends, resulting in the hinges at each location.
The loading on the wire shows a similarly complicated picture. There appears to be a relationship between the
bouncing and an immediate period of no loading. Otherwise, a basic pattern of an initial higher load followed by a large period of reduced loading with much oscillation seems to be typical. This is then followed by a period of increased loading towards the end of the process. It appears that the higher the velocity, the higher the initial peak and final loads. However, this is skewed by several velocities showing low or zero values at their first time step. This could be an indication that the 20 time steps created by the software are not sufficient for a clear image, as the initial peaks of these might be missing due to their appearance between the initial and first step. Generally, the period of loading with oscillations seems to be of a higher value on average when the velocity is higher. This higher loading period is certainly the case when the thickness is increased, when the oscillations also seem to be reduced in severity and the final load values are increased greatly.
B. Hollow Spheres Mode of Deformation
The typical process of deformation for a sphere features the upper-most central section immediately dipping, creating a clear hinge which is in contact with the impact wire. This dip continues throughout, meaning the downwards pointing section grows in length as the hinge moves further from the centre of the model. The distal section acts in the same way, slightly after the upper section, so that, similar to rings, a bow shape is formed. But unlike the rings, the spheres have the two distinct hinges in contact with either wire, rather than one centrally at the side like for rings. This causes the side portion of the sphere- almost becoming tangential to the two wires- to stay relatively smooth (almost un-deformed), and as the hinges move away from the centre in the x-direction, this side section straightens (Table 1 at 40-60% crush).
This means that once the hinges have finished travelling outwards along the wire, there is a considerable amount of material (the hinge) directly above and below the now fairly straight side section. Here, the spheres behave differently depending on their wall thickness. With the larger wall thicknesses, the hinges aren’t as tight (have a larger radius), meaning that the bulk of the hinges are, for the most part, still inside the side-section. Therefore, this section hinges in the middle in an outwards direction. As all three hinges are now in the same direction, the upper and lower ones open and merge into the new side one, so the sphere begins to fold in two. However, with thinner walls there are tighter radius hinges, meaning there’s more material outside of the side-section. This causes the collapse of the side to hinge inwards, meaning the sphere folds in four instead, as in Table 2. Between 5% and 7% wall thickness ratio is the critical value which determines the deformation process a sphere will take. All this is illustrated in Table 2.
[image:5.595.51.286.51.177.2]data, this occurs soon after the central hinge (pointing inwards for this wall thickness, leading to folding in 4) has started to develop. This is confirmed by Figures 2-4 showing that at the same displacement the maximum strain is found to move closer to the 0° value. Here, the maximum strain position tends to oscillate around positive and negative 20°, trending closer to 0° before settling there. As appears to be typical for rings and hollow spheres, the 5 m/s velocity does not follow this trend. This could be related to findings in [12-13] which identified the point when maximum deformation would occur at the impact end, rather than the distal end as being 8.8 m/s for rings of a 50 mm
diameter in that given system.
When the velocity is unchanged and the wall thickness varied (as shown in Figure 2), the general strain pattern remains the same. However, the stable period is reached at a larger displacement, and settles at a higher strain value as wall thickness is increased. The period with the sharp strain increase also changes. The thinner the wall of the sphere, the earlier the strain increase occurs, and the shallower the gradient is too.
In terms of loading, the spheres appear to show significantly less oscillating than the rings. At 5% wall thickness they similarly reach an initial peak and do not then experience a low loading period. Instead, there’s a brief period where strain levels out slightly. The extent to which this happens seems to be a function of velocity, as the lower velocities maintain a steeper gradient, and faster impacts actually create a slight negative gradient. The load then increases linearly through the middle of the displacement range, with higher velocities returning slightly steeper gradients. At around 0.027 m, (shortly before strain indicates the side hinge forming) the gradients sharply increase, likely corresponding with the side section becoming tangential to the wires and therefore more strongly resisting the crushing. Towards the end of deformation the load drops again, likely a result of the hinge being fully developed, making the side less resistive. This also seems to happen for 3% wall thickness ratio spheres, although due to being thinner the load increase (as the side becomes tangential) is much less severe, and the load drop occurs earlier. Thicker spheres which only fold in two have a load increase at a similar time as for 5%, but the load continues to rise until the end, likely due to the upper and lower hinges merging to form the central one, meaning there’s only one hinge, which seems to increase the resistance of the system.
C. Rings vs. Spheres Comparisons
The distinct difference in deformation processes is further corroborated by the much sharper transition that a sphere has from a period of stable strain to one of rapidly increasing strain, as can be seen in Figure 8. Finally, Figure 9 shows how much stronger the sphere is despite sharing a cross-section, as it requires significantly larger loading to deform at all, let alone be completely crushed. However, it is noteworthy that this is only a comparison between wall thicknesses of 5%, and that the very different process of spheres thicker than this makes conclusive comparisons difficult.
Refrences [14-19] investigat a numerical modeling of piples or plates under heat conditions such as welding process. The current study did not consider the effect of heat during the deformation and at the time of self contact of the either ring or spher materials and left it for future study.
V. CONCLUSION
The general process of deformation of rings has been analysed, showing that a bow shape is typically formed by the dipping of the central impact end of the ring and eventual rising of the central distal end. It has also been found that a bounce causes the distal end to lift earlier. Although the reason for this is not certain, it seems to be a result of shock and a function of the ring’s velocity and thickness. These factors are also responsible for the loading and strain characteristics that a particular ring will exhibit. The great oscillation in loading of rings at high velocity is also apparent, and this in turn could be related to the mechanism causing the ring to bounce. Spheres have also been analysed and their main deformation patterns recorded, again including strain and loading characteristics. This has also allowed comparisons to rings that highlight the hollow sphere’s much improved resistive qualities, as well as the very different ways that spheres deform dependent on their wall thickness.
REFERENCES
[1] Shim, V.P.W., Lan, R., Guo, Y.B., Yang, L.M. (2007) Elastic wave propagation in cellular systems-Experiments on single rings and ring systems. International Journal of Impact Engineering, 34 (10), 1565-1584
[2] Karman, T.V. and Duwez, P. (1950) The Propagation of Plastic Deformation in Solids. J. Appl. Phys., 21, 987-994.
[3] Jones, S.E., Maudlin, P.J. and Foster Jr. J.C. (1997) An engineering analysis of plastic wave propagation in the Taylor test. International Journal of Impact Engineering, 19 (2), 95-106. [4] Johnson, G.R. and Holmquist, T.J. (1988) Evaluation of cylinder-impact test data for constitutive model constants. Journal of Applied Physics, 64 (8), 3901-3910.
[5] Reid, S.R. and Yella Reddy, T. (1983) Experimental investigation of inertia effects in one-dimensional metal ring systems subjected to end impact — I. Fixed-ended systems. International Journal of Impact Engineering, 1 (1), 85-106 [6] Reid, S.R. , Bell, W.W. and Barr, R.A. (1983) Structural plastic
shock model for one-dimensional ring systems. International Journal of Impact Engineering, 1 (2), 175-191
[7] Reddy, T.Y., Reid, S.R. and Barr, R. (1991) Experimental investigation of inertia effects in one-dimensional metal ring systems subjected to end impact—II. Free-ended systems. International Journal of Impact Engineering, 11 (4), 463-480 [8] Reid, S.R. and Bell, W.W. (1984) Response of 1-D metal ring
systems to end impact. Institute of Physics Conference Series, 70, 471-478
[9] Reddy, T.Y., Reid, S.R., Carney III, J.F. and Veillette, J.R. (1987) Crushing analysis of braced metal rings using the equivalent structure technique. International Journal of Mechanical Sciences, 29 (9), 655-668
[10] Merchant, W. (1965) On equivalent structures. International Journal of Mechanical Sciences, 7 (9), 613-619
[11] Liu, K., Zhao, K., Gao, Z. and Yu, T.X. (2005) Dynamic behaviour of ring systems subjected to pulse loading. International Journal of Impact Engineering, 31 (10), 1209– 1222
[12] Shen, J., Liu, K. and Lu, G. (2008) Impact behaviour of a multi-body system with energy dissipation. International Journal of Crashworthiness, 13 (5), 499-510
[13] Chizari, M., Barrett, M.L., (2009). Single and double plate impact welding: Experimental and numerical simulation, Computational Materials Science 46: 828–833
[15] Kogo, B., Wang, B., Wrobel, L., Chizari, M., (2019). Authentication in Welded Clad Plate with Similar Material and Thickness, Conference: Proc. of the Eighth Intl. Conf. on Advances in Civil, Structural and Mechanical Engineering - CSM 2019, April 2019, Birmingham, UK, DOI: 10.15224/978-1-63248-170-2-01
[16] Guo, W., Zhang, L., Xu, C., Chai, R., Gao, Z., Kogo, B., Chizari, M., Zhang, C., and Wang B., (2019). Study on the wear resistance of laser cladding iron-base alloy by heat treatment, Materials Research Express, Volume 6, Issue 2, February 2019, Article number 026572, Doi: 10.1088/2053-1591/aaf251
[17] Kogo, B., Wang, B., Wrobel, L., Chizari, M., (2018). Experimental and Numerical Simulation of Girth Welded Joints of Dissimilar Metals in Clad Pipes, International Journal of Offshore and Polar Engineering (ISSN 1053-5381), Vol. 28, No. 4, pp. 380-386, Dec 2018, DOI: 10.17736/ijope.2018.oa22 [18] Kogo, B., Wang, B., Wrobel, L., Chizari, M., (2018).
Microstructural Analysis of a Girth Welded Subsea Pipe, Engineering Letters, 26:1, EL_26_1_23, February 2018, http://www.engineeringletters.com/issues_v26/issue_1/EL_26_1 _23.pdf, ISSN: 1816-0948 (online version); 1816-093X (print version)
[19] Kogo, B., Wang, B., Wrobel, L., Chizari, M., (2017). Residual Stress Simulations of Girth Welding in Subsea Pipelines, Transactions on Engineering Technologies: 25th World Congress on Engineering (WCE 2017) Sio-Iong Ao, Len Gelman, Haeng Kon Kim, Springer, 17 Aug 2018, Doi: 10.1007/978-981-13-0746-1_30
Date of modification: 18 July 2019
![Figure 1- Deformation in various ring systems from [6], with impact end to the left and free end to the right](https://thumb-us.123doks.com/thumbv2/123dok_us/395381.537076/2.595.61.286.141.262/figure-deformation-various-ring-systems-impact-left-right.webp)