Received: 12 Aug 2016 ISSN 2056-757X Revised: 19 Aug 2016
Accepted: 29 Aug 2016 https://doi.org/10.18646/2056.33.16-008
Modelling the Bullwhip Effect under
the Implementation of Supply Chain
Management Software
Spring C. Hsu
China University of Science and Technology, Taiwan
Abstract:
Reducing the bullwhip effect is of the main challenges in the field of supply chain management (SCM). One of the solutions is to implement SCM software for collaborating within every upstream and downstream supply chain members effectively. However, there is a lack of measurement models to show the relationship between changes of the bullwhip effect and the implementation of SCM software. Therefore, this study proposed an innovative model for measuring the bullwhip effect under the implementation of supply chain management software. Moreover, an empirical four-stage supply chain case in Taiwan is taken for numerical analysis. The results show that a higher implementation rate of supply chain management software in the supply chain, the more improvements of the bullwhip effect will make. Furthermore, it also found that under the same software implementation rate in better performed and worse performed supply chains, the worse one can make more notable improvements for the bullwhip effect.
Paper type: Research paper
1. Introduction
From material requirements planning (MRP), manufacturing resource planning (MRP II) to enterprise resource planning (ERP), the manufacturing industry has developed sound operations management techniques for lateral business functions management within entire enterprise. However, it is equally important to manage the vertical relationships with outside supply chain members, and this is part of the reasons why supply chain management (SCM) software is developed: to collaborating with other supply chain members effectively.
One of the greatest challenge for the supply chain management is to overcome the bullwhip effect (Mackelprang and Malhotra, 2015; Nooraie and Parast, 2015; Reyes et al., 2002). The bullwhip effect, also known as whiplash or Forrester effect, refers to “the process of amplification of order in upward direction of a supply chain” (Jaipuria and Mahapatra, 2014: 2396). It means that in a supply chain system, the upstream members tend to have larger and larger variations of inventory level in response to uncertainty of real demand. Consequently, the high inventory level not only increases total costs of supply chain, but also makes the members of supply chain unable to meet customer demand in a timely manner (Agrawal et al., 2009; Bayraktar et al., 2008; Jaipuria and Mahapatra, 2014). For these reasons, accessing to accurate and reliable information as well as minimising bullwhip effect becomes critical for the members of supply chain management (Dai et al., 2016; Krol et al., 2005; Lee and Whang, 2004;). Therefore, the implementation of SCM software for all members of the supply chain is becoming necessary.
The use of SCM software has attracted a growing interest in the academic field (Mittermayer and Rodríguez-Monroy, 2013; Reyes et al., 2002; Trapero et al., 2012). However, there is a lack of numerically analysed with regard to the effect of implementing SCM software in the exiting literatures. This study thus aims to formulate the relationship between SCM software implementation and changes of the bullwhip effect. In the following sections, the status quo of supply chain management and the bullwhip effect are discussed, followed by a discussion of research methodology, and finally a numerically simulated study based on the empirical data in Taiwan is presented. Furthermore, the conclusion and the findings of this study are also given.
2. Literatures review
The importance of information quality and the practice of information sharing are well cited and supported by the SCM scholars (e.g. Li et al., 2006; Li and Lin, 2006; Mittermayer and Rodríguez-Monroy, 2013; Trapero et al., 2012). Trapero et al. (2012) collected weekly data from a manufacturer and a major UK grocery retailer to show the circumstances where information sharing leads to improved forecasting accuracy. Without resorting to unrealistic assumptions, they found significant evidence of benefits through information sharing with substantial improvements in forecast accuracy.
supply chain management practice (as shown as Table 1), and the authors tested the relationships between supply chain management practices, competitive advantages, and organisational performances. The study of Li et al. (2006) indicates that SCM practices can have a direct impact on competitive advantage and organisation.
Table 1: List of sub-constructs for supply chain management practice
Sub-constructs Importance in literature (0-10)*
Strategic supplier partnership 7
Customer relationship 6
Level of information sharing 9
Quality of information sharing 10
Postponement 10
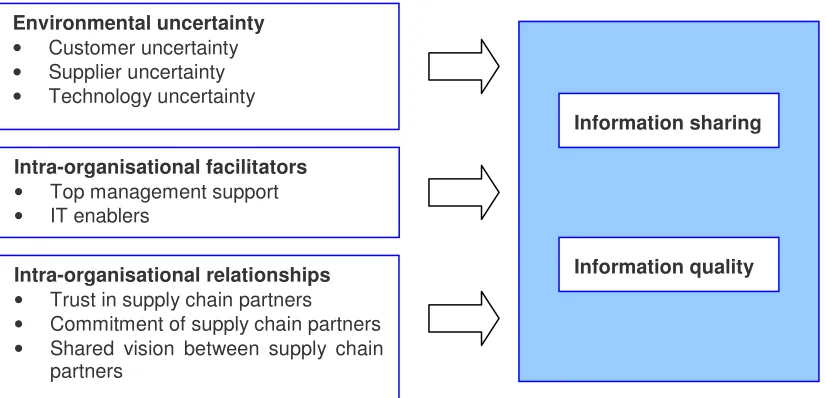
[image:3.595.92.505.488.687.2]* Low to high Source: Li et al., 2006 In a similar vein, Li and Lin (2006) found that both information sharing and information quality are influenced positively by trust in supply chain partners and shared vision between supply chain partners. Based on the data collected from 196 organisations, Li and Lin (2006) empirically examined the impact of environmental uncertainty, intra-organisational facilitators, and inter-organisational relationships on information sharing and information quality in supply chain management, as shown as Figure 1. Their study also indicates that top management has a positive impact on information sharing but has no impact on information quality. Additionally, their results also show that information sharing and information quality are not impacted by customer uncertainty, technology uncertainty, commitment of supply chain partners, and IT enablers. Li and Lin (2006) concluded that supplier uncertainty, shared vision between supply chain partners, and commitment of supply chain partners are the three most important factors between the organisations of supply chains.
Figure 1: Factors that Impact Supply Chain Information Sharing and Quality
Source: modified from Li and Lin (2006)
Reyes et al. (2002) applied a case study to illustrate a broad view of an entire supply chain to reveal full product and component life cycle that not only reveals
Environmental uncertainty
• Customer uncertainty
• Supplier uncertainty
• Technology uncertainty
Intra-organisational facilitators
• Top management support
• IT enablers
Intra-organisational relationships • Trust in supply chain partners
• Commitment of supply chain partners
• Shared vision between supply chain partners
Information sharing
opportunities for cost reduction but also stimulates revenue growth. They concluded that organisations must get more involved in the management of supply chain network of all upstream and downstream firms for reducing the bullwhip effect. Lee and Whang (2004) examined the impact of e-business on supply chain integration on four critical dimensions: information integration, synchronised planning, coordinated workflow, and new business models. They found that by adopting e-business approaches businesses can reduce the bullwhip effect and get more effective and flexible. Krol et al. (2005) use a qualitative approach to point up the impacts of e-logistics. They also found that the profitability of business will be increased by reducing the bullwhip effect in supply chains.
Based on a survey conducted on the European automotive industry, Díaz and Buxmann (2003) remarked that there is a need for transparency in quantifying the added-value of SCM software. In particular, Díaz and Buxmann (2003) found that unable to quantify the benefits of SCM software as major concern for the car manufacturers at the time. A decade later, Mittermayer and Rodríguez-Monroy (2013) pointed out the difficulty to measure the benefits of SCM software remain as a challenge for organisations to adopt SCM software.
The literature review reveals that matching demand and supply is critical to supply chain and yet the implementation of SCM software is not an easy task. The bullwhip effects in manufacturing sector are well documented (Krol et al., 2005; Lee and Whang, 2004; Reyes et al., 2002), but there is limited evidence suggesting the relationship between the bullwhip effect and SCM software. Therefore, this study aims to fill the gap.
3. Methodology
To distinguish the information sharing level of implementing SCM software or not, the “decentralised supply chain model” and “centralised supply chain model” (Simchi-Levi et al., 2007) should be firstly proposed for analysis. In the decentralised supply chain model, information of “average demand” and “variance of demand” of end customers are not shared for other supply chain members.
The studies on the bullwhip effect typically adopt the ratio of variances as the general measures for the bullwhip effect (e.g. Agrawal et al., 2009; Bayraktar et al., 2008; Kainuma and Tawara, 2006). Fransoo and Wouters (2000) tried to use the ratio of the coefficients of variation (CV) between the output supplier sales and the input retailer sales. The bullwhip ratio (BWR) is denoted by Equation (1). However, this formula is more suitable for two-stage supply chain and it is argued here that it is not suitable for calculation of multi-stages supply chain.
retailer retailer
plier plier
BWR
µ
σ
µ
σ
sup sup
=
In order to make sure that customer demand will be satisfied under the uncertainty, upstream suppliers will always tend to prepare higher inventory levels than really consumed. Therefore, for the upstream stages of the supply chain, the higher variance in order is faced than that in the downstream ones. The relation of faced variance in the
kth stage and real demand variance can be shown as Equation (2) , where the Q stands for the placed order, D stands for average customer demand, Li stands for the lead time
between stage i and i+1, and p is the number of demand observations. In contrast to decentralised supply chain model, i.e., the centralised supply chain model, the relationship of faced variance in the kth stage and real demand variance can be shown as Equation (3). It is easy to find that the variance ratio of the placed order and customer demand is lower than that in decentralised supply chain model.
( )
( )
∏
= + + ≥ k i i i K p L p L D Var Q Var 1 2 2 2 2 1 (2)( )
( )
22 1 1 2 2 1 p L p L D Var Q Var k i i k i i K + + ≥
∑
∑
= = (3)Meanwhile, to demonstrate the effects of implementing SCM software, the rate “R” of implementing supply chain software in the total supply chain can be shown as Equation (4), where j stands for the number of stages that has implemented the same SCM software system in entire k stages of the supply chain. Furthermore, the finally developed model that links the bullwhip effect and the implementation of SCM software in this study is modelled as Equation (5).
k j
k j
R= =0~ (4)
( )
( )
(
)
+ + ⋅ − + + + ⋅ ≥∏
∑
∑
= = = k i i i k i i k i i K p L p L R p L p L R D Var Q Var 1 2 2 2 2 11 1 1 2 2
2 2
1
(5)
4. Numerical simulation
Figure 2: Supply Chain of the Case
The original condition of information sharing of this supply chain is not transparent, and no SCM software is implemented (i.e., R=0%). Therefore, the original supply chain belongs to the decentralised model, where information of “average demand” and “variance of demand” from the meat retailer are not shared for supply chain members of feed supplier, chicken farm, and slaughterhouse.
[image:6.595.81.512.420.461.2]To calculate the bullwhip effect of this case, Equation (5) can be applied for the supply chain with data sets p=24, supply chain stages k=4, and average lead time L=4 hours (i.e., half of the working day). Moreover, the numerical simulation of the case supply chain under different rates by implementing SCM software is shown in Table 2, and visualised results of the simulation are shown in Figure 3. Note that the original condition is filled gray in Table 2 with R=0%. It is found that an average of the bullwhip effect improvements up to 13.4% in this simulation case. In addition, the results also show that a higher implementation rate of supply chain management software in the supply chain, the more improvements of the bullwhip effect will make.
Table 2: Variance ratios under different rate of implementing SCM software
R 0% 25% 50% 75% 100%
Variance ratios 3.7211 3.4717 3.3683 3.2890 3.2222 Improvement rate 0% 6.70% 9.48% 11.61% 13.41%
Figure 3: Improvements under Different Rates of SCM Software Implementation
Feed Supplier
Chicken
Farm Slaughterhouse
[image:6.595.106.505.472.759.2]Furthermore, to discuss the effects of implementing SCM software in different performed supply chain, the lead time L is taken for sensitivity analysis. The numerical simulation of the case supply chain is shown in Table 3, where lead time L varied from 1 through 6 hours. Note that the original condition is filled gray in Table 2 with L=4. It is found that the average of improvements for the bullwhip effect ranges from 0.4% to 28.3% in this sensitivity simulation. Meanwhile, the visualised results of the simulation are shown in Figure 4, where the solid line stands for the original condition of the supply chain without implementing any SCM software, and broken line stands for the supply chain after fully implementing SCM software. It can be concluded that under the same software implementation rate in better performed and worse performed supply chains, the worse one can make more notable improvements for the bullwhip effect.
Table 3: Variance ratios under different lead time
L 1 2 3 4 5 6
Without implementing
SCM software (R=0%) 1.3951 1.9424 2.6949 3.7211 5.1095 6.9729 Fully implementing SCM
software (R=100%) 1.3889 1.8889 2.5000 3.2222 4.0556 5.0000 Improvement rate 0.44% 2.75% 7.23% 13.41% 20.63% 28.29%
5. Concluding remarks
The implementation of SCM software is an effective way to collaborate within every upstream and downstream supply chain members and to reduce the bullwhip effect. With the deficiency of numerically analysed the effect of implementing SCM software in literature, this study aims to model the relationship between SCM software implementation and changes of the bullwhip effect in supply chain.
Acceding to the numerical simulation on an empirical four-stage supply chain case in Taiwan, the results show that a higher implementation rate of supply chain management software in the supply chain can be helpful to improve the bullwhip effect. Moreover, it is also found that under the same software implementation rate in better performed and worse performed supply chains, the worse one can make more notable improvements for the bullwhip effect. This means that implementation of SCM software is not only helpful for those well-performed supply chains, but can even make more contributions to the poor-performed ones.
This study has developed the model to demonstrate the “degree of information sharing” by connecting SCM software implementation rates and the bullwhip effect. This model has an advantage of quantifying the benefit of using the SCM software to share the supply chain information. Given the fact that the bullwhip effect has an impact on information quality, the magnitude of a direct relationship between the bullwhip effect and information quality might be an interesting area for future research.
6. References
1. Agrawal, S.; Sengupta, R. N. and Shanker, K. (2009), “Impact of information sharing and lead time on bullwhip effect and on-hand inventory”, European Journal of Operational Research, Vol. 192, No. 2, 16, pp. 576-593.
https://doi.org/10.1016/j.ejor.2007.09.015
2. Bayraktar, E.; Koh, L. Gunasekaran, A.; Sari, K. and Tatoglu, E. (2008), “The role of forecasting on bullwhip effect for E-SCM applications”, International Journal of Production Economics, Vol. 113, No. 1, pp. 193-204.
https://doi.org/10.1016/j.ijpe.2007.03.024.
3. Dai, H., Li, J., Yan, N and Zhou, W. (2016), “Bullwhip effect and supply chain costs with low- and high-quality information on inventory shrinkage”, European Journal of Operational Research, Vol. 250, pp. 457-469.
https://doi.org/10.1016/j.ejor.2015.11.004
4. Díaz, L. M. and Buxmann, P. (2003), “The value of cooperative planning in supply chains: a simulative approach”, in Proceedings of the 11th European Conference on Information Systems, Naples, Italy, pp. 533-544.
5. Fransoo, J. C. and Wouters, M. J. F. (2000), “Measuring the bullwhip effect in the supply chain”, Supply Chain Management: An International Journal, Vol. 5, No. 2, pp. 78-89. https://doi.org/10.1108/13598540010319993
Dynamics, Master thesis, Department of Mechanical Engineering, Cambridge: Massachusetts Institute of Technology.
7. Jaipuria, S. and Mahapatra, S.S. (2014), “An improved demand forecasting method to reduce bullwhip effect in supply chains”, Expert Systems with Applications, Vol. 41, No. 5, pp. 2395-2408, https://doi.org/10.1016/j.eswa.2013.09.038.
8. Kainuma, Y. and Tawara, N. (2006), “A multiple attribute utility theory approach to lean and green supply chain management”, International Journal of Production Economics, Vol. 101, No. 1, pp. 99-108. https://doi.org/10.1016/j.ijpe.2005.05.010. 9. Krajnović, A., Čovo, P. and Jašić, D. (2012), “The value of cooperative planning in
supply chains: a simulative approach”, in Proceedings of the International Conference on Technology and Business Management, Dubai, United Arab Emirates, pp. 418-425.
10.Krol, B., Keller, S. and Zelewski, S. (2005), “E-logistics overcome the bullwhip effect”, International Journal of Operations and Quantitative Management, Vol. 11, No. 4, pp. 281-289.
11.Lee, H. L. and Whang, S. (2004), “E-business and supply chain integration”, in: Harrison, T. P. Lee, H. L. and Neale, J. (Ed), The Practice of Supply Chain Management: Where Theory and Application Converge, Vol. 62, pp. 123-138. 12.Li, S. and Lin, B. (2006), “Accessing information sharing and information quality
in supply chain management”, Decision Support Systems, Vol. 42, pp. 1641-1656. https://doi.org/10.1016/j.dss.2006.02.011
13.Li, S., Ragu-Nathan, B., Ragu-Nathan, T. S. and Rao, S. S. (2006), “The impact of supply chain management practices on competitive advantage and organisational performance”, Omega, Vol. 34, No. 2, pp. 107-124.
https://doi.org/10.1016/j.omega.2004.08.002
14.Mackelprang, A. W. and Malhotra, M. K. (2015), “The impact of bullwhip on supply chains: Performance pathways, control mechanisms, and managerial levers”,
Journal of Operations Management, Vol. 36, pp. 15-32. https://doi.org/10.1016/j.jom.2015.02.003
15.Martin, L. and Buxmann, P. (2003), “The value of cooperative planning in supply chains: a simulative approach”, in Proceedings of the 11th European Conference on Information Systems, Naples, Italy.
16.Mittermayer, H. and Rodríguez-Monroy, C. (2013), “Evaluating alternative
industrial network organisations and information systems”, Industrial Management & Data Systems, Vol. 113, No. 1, pp.77 – 95.
http://dx.doi.org.liverpool.idm.oclc.org/10.1108/02635571311289674
17.Nooraie, S. V. and Parast, M. M. (2015), “A multi-objective approach to supply chain risk management: Integrating visibility with supply and demand risk”,
International Journal of Production Economics, Vol. 161, pp. 192-200. https://doi.org/10.1016/j.ijpe.2014.12.024
18.Reyes, P., Raisinghani, M. S. and Singh, M. (2002), “Global supply chain management in the telecommunications industry: the role of information
Technology Management, Vol. 5, No. 2, pp. 48-67. https://doi.org/10.1080/1097198X.2002.10856325
19.Simchi-Levi, D., Kaminsky, P. and Simchi-Levi, E. (2007), Design and Managing the Supply Chain, 3rd ed., Irwin: McGraw-Hill.
20.Trapero, J. R., Kourentzes, N. and Fildes, R. (2012), “Impact of information exchange on supplier forecasting performance”, Omega, Vol. 40, No. 6, pp. 738-747. https://doi.org/10.1016/j.omega.2011.08.009