warwick.ac.uk/lib-publications
A Thesis Submitted for the Degree of PhD at the University of Warwick
Permanent WRAP URL:
http://wrap.warwick.ac.uk/97357
Copyright and reuse:
This thesis is made available online and is protected by original copyright.
Please scroll down to view the document itself.
Please refer to the repository record for this item for information to help you to cite it.
Our policy information is available from the repository home page.
Attention is drawn to the
copyright o f this thesis rests wit
This, copy o f the^hesis^ias
on condition .that anyone who
understood to recogniscrthat its
.with its author and that no
* ■, " '■ ■ .
the thesis an d
'f a x :
information c
- " W . . •
STUDIES IU EVP-rs TEST PSD AUTCTATIOT?.
by
I .V.Comfort, >’ .S c ., B .S c .
A th esis; submitted to the U n iv ersity o f '.farwick
fo r the depree of Doctor o f Philosophy.
ABSTRACT.
The work described In this then is was in itiated in response
to motivation from the needs of industry, the desire to investigate
the performance of a process control computer in a re la tiv e ly novel
application as well as to provide training :in methods o f research.
Ever-increasing labour costs have caused the automotive and
petroleum industries to seek new means of maintaining the throughout
of engine te stin g work. Their task has been made more d if f ic u lt by
the stringent t e s t regulations that have been introduced with the
very commendable intention of reducing atmospheric pollution. In
consequence, any means by which the efficien cy of testing could be
improved and the throughput of work increased were deemed worthy of
investigation.
Engine testin g involves a d iversity of simple rep etitiv e operations.
These include the collection and processing o f data and the execution
of lo g ical operations. The d ig ita l computer has proved i t s e l f to be
.ideally suited to performing such tasks, but the problem. of integrating
a computer with such an a c tiv ity remains only p artially solved. I t is
hoped that the work described in th is thesis w ill go some way towards
solving this problem.
A description of the instrumentation and interfacing used on
the te s t rig i s included together with a description of the program
structure and functior.3. These are not regarded as examnlory but
i t i s hoped th a t they w ill aid the id en tificatio n of the requirements
for similar systems.
A linearised mathematical model is developed to represent both
the sta tic and dynamic behaviour of the engine and dynamometer. This
aspect of the study has provided useful insight into the problems
associated with the control of engine te s t r ig s . As a re su lt i t has
been shown th at effectiv e control can be made available without
i l i .
ACKVOWLREC:; "TTS.
I should lik e to acknowledge the advice and assistance
given to ne fcy "Shell" Research Ltd., The Ford ’ lotor Co. Ltd.
and Crysler tl.K. (formerly Rootes Ltd.) Their invaluable help
tendered on numerous occasions has enabled me to gain some
useful insight into engine testing nrocedures.
1 am also indebted to Mr.Td'.W.’ieedon of the B.L.K.C.
Group Pollution Research Unit and to my supervisor Dr.M.T.G.Kughos
for th eir advice and recommendations.
F in ally , I should lik e to thank the technicians of the School
of Engineering for th eir assistance and i'rs.C.Allsopp and K rs.P .
iv
CC"T V 73.
Ch-r^ter I .
j> y rr>T> p,Tjr ? H 'J' J Q V
1 . ”}'aminetinn of the engine tenting a ctiv ity with
reference to automation. 2 .
2. Aims of the research w ork . f.
AUTO” A Tier IK TUK At’ TC* TTI7K I T D U S T O .
1. Kngine te s t a c tiv itie s . 7
2. Aims end objectives of te s ts . 7
3 . Some examples of te s ts . R
/,. Projected computer functions. 11
Chant OP ^ i
r-THLrr'T'T c? c c T tr r a c r ’^nouro tkst fa cility.
i. The structure of the te s t f a c ilit y . The te s t co ll,
control room and ccrrutar laboratory. 16
2. A deserintion of the engine, dynamometer and
process control computer. 17
3 . Instrumentation for the mathematical modelling
studies. 1<?
i. Further instrumentation to fa c ilita te on-line
te s tin e . 26
testing
V .
Chanter 4 .
T"E ” :-r'?'A T;c'.i, vcn&i.i j’ic- study.
1 . The neons of the notelling study. 41.
2 . The model and i t s derivation. 41.
3 . Experimental verification of ■the model. 45.
4 . Dynamic equations and the analog computer simulation. 46.
5. A comparison o f id e n tific a tio n methods. 4 7 .
6 . Conclusions of the modelling studies. 48.
Tables. 52.
Figures. 54.
Chanter 8.
CPYTPPL SYSTTS.
1 . 'Inter and o il temperature controls. 73.
2 . The speed control system. 76.
3. Fuel ness flov rate co n trol. 79.
Figures. 80.
Chanter 6 .
P?.PCPA"S FOR SYPLPPATPPY Cr'TTJT-?. CP"IMPLIED mSSTI-'G
1. The evolution of the nrogrrm structure for computer
controlled te stin g . 91.
2. The assembly language S.D .S. Symbol. 91.
3. The overall program structure. 92.
4 . The executive control nrogran. 93«
5. Program subroutine descriptions. 96.
vi
r.b o or 7.
CT'Tr' ISA TJr-’ STT)I33.
1. Optimisation in Ignition distributor and
carburettor design. 111.
2. Consideration of the single parameter optimizer. 112.
3. Further consideration of the single parameter
optimiser under the influence of noise end asymmetric
cost functions. 113.
Fanual ignition tiffing optimisation. 116.
5 . Perturbation ]imitations for ignition timing and
air/fuel ratio optimisation. 117.
6* An experimental sinusoidal ignition timing optimise!-. 121.
Figures. 123.
+■*;
?■
A-'-lOl or 3.
c c r r u r a c i " n o u 3 S t s s t s.
i . Control and measurement techniques for on-line te s ts . 1 2 ? .
2. L ist of interfacing u tilised . 13C.
3. Torque and horsopover plots for a l i s t of throttle
openings. 132.
Ignition timing sen sitiv ity . 1 3 ? .
5. Air/fuel ratio sen sitiv ity . 1 3 3 .
6 . ¡'ixture looos. 1 3 3 .
7 . Ignition timing optimisation. 13A.
8 . Ignition timing and nixture optimisation. 1 3 ? .
1 Examination of the engine te s t! nr activ ity wi th special
reference t,o automation.
Internal combustion engine performance evaluation is not
generally amenable to an alytical treatment and so i t must be achieved
by experimental running on a te s t bed. Im plicit in the te s t function
i s a two-way communication between the engine and the engineer. I t is
an increase in the efficien cy of th is communication that th is th esis
attempts to pranote.
Engine testing forms an important part of design, development
and production. In production testing the objective is to complete
the production operation by making fin a l adjustments and checks to
s a tis fy the product sp ecificatio n . Design and development testin g
involves more diverse t e s t operations which at times involve a
considerably higher degree of te st operator p articipation .
Engine testin g , as well as being »n important function in
msnufacture, is also used to evaluate fuel and lubricant performance.
The t e s t bed provides simulated service conditions where measurements
can be carried out with greater precision.
In the past the communication between the engine and the design,
development or production engineer has been sebieved by the lib eral use
of manpower specially trained for the purpose. A more effective use
of the human operator is essential for the development of engine
te stin g . This can only be achieved by the delegation of the lower
responsibilities of testing to autc*nstic systems and by improving the
quality of the te s t data presented to the engineer.
Employment conditions no longer favour a lite r a l deployment of
manpower for this purpose and the use of automation is therefore
essential i f the throughput of experimental work is to be increased
without the uneconomic duplication of f a c ilitie s . This factor was
The neat) for automation in engine tasting has been keenly fe lt
ky the automotive anti oetroleun industries for 9 considerable time,
and already a number of computer controlled engine test, f a c i l i t i e s
have been commissioned, mostly in the United States ( l ) . I n it ia l
operating experiences with these are favourable, but the lack of
operating experience of process control d ig ital computers in this
field i3 re strictin g the usefulness of such in stallatio n s, which
other’)!se appear to offer considerable scone for development.
The advantages offered by computer controlled te st f a c i l i t i e s
are that they can provide higher cualit.y test data in a form which
is easily assim ilated. Furthermore, the data can he made available
within seconds of the completion of a t e s t. This time reduction can
lend to more effectiv e u tilisatio n of te s t f a c ilit i e s . In return i t
is necessary to standardise engine in stallation procedures, which in
i t s e lf , is desirable, and to implement more careful planning and
specification of te sts than i s at nresent associated with manual
testing procedures.
Some engine te s t a c tiv itie s are briefly examined in th is thesis
in order to indicate the scope for computer control and the problems
that e x ist in i t s application.
As has already been indicated engine testing forms a sign ifican t
function in the process of fuel and lubricant development. This is a
continual process and i t r e lie s on the results of comparative tests
which are usually carried out in an adverse environment. Test
procedures demand an accurate control of environmental conditions,
and often a considerable amount of data aenuisition and processing
is required. The stab ilisatio n of operating conditions is known to
present a real d iffic u lty . A knowledge of typical st«tio and dynamic
system transfer ch aracteristics for an engine te s t bed is therefore
deeireble in ordor to provide an indication of the best attain able
I
-control problems which are know to e x is t. For th is reason a study
was undertaken to develop a mathematical model to represent the most
important system tran sfer functions of a typical engine te s t bed.
"any ongine'test a c tiv itie s may be considered as m ulti-
rarameter optimisation processes. An example exists in the design
o f ignition and carburation systems. In practice the cost functions
and constraints define exceedingly complex nroblems which at present
are not amenable to mathematical formulation end solution. P ractical
solutions necessarily involve a reduction of the problem to a scale
th a t can be tackled by the human operator employing experimental
methods. Often these are very time consuming. There i s scope for
a re-appraisal of these problems to u tilis e advances in electronic
instrumentation end the calculating power of the d ig ita l computer.
The Implementation of even the most simole automatic o p tim isatio n
p ro c ed u re s would save a considerable amount of ODerator time on some
development t e s t procedu res.
A recently occurring aspect of engine testing is the quantitative
measurement of exhaust gas emissions. In order that vehicles shall
be e lig ib le for sale in certain parts of the world exhaust gas emissions
must satisfy certain t e s t s . Processing of th is te st data involves a
considerable amount of calcu lation. An on-line computer controlled
t e s t f a c ilit y can provide the resu lts of a te s t within seconds of
completion, as well as performing routine calibration o f the equipment,
whereas manual scanning of the data coupled with o ff-lin e processing
would take several hours to provide comparable re su lts. (2)
Durability testing i s another area in which computer control can
usefully be applied. Often i t i s only when the failu re of a component
1b in progress or ha3 Ju st occurred that information i s required. The
course of events during a failu re is often extremely rapid and i t is
not always within the capability of the human operator to diagnose
se t i >11. Commuter controlled data logging and s i arm scanning provides
the ideal solution to this rroblem. Test progress can Vo designed so
as to discard irrelevant data and t.o increase the rate o f data collection
in the advent of a suspected imminent fa ilu re.
I t can ho seen that the on-line process control d ig ita l computer
can ju s tifia b ly he spoiled to many facets of engine te s tin g . In
particular the computer can aid the design and development processes
as well ns perform the more mundane testing operations. (3) The
application doer introduce interfacing problems and the need to
re-anpraise te st procedures in order to exploit fully the new means
of solution.
Prior to 1965 automation of engine testing was limited to
automatic data logging of endurance te s ts and simple electromechanical
sequencing of te s t conditions. One of the f i r s t on-line computer
controlled te s t f a c i l i t i e s was commissioned in the United States in
1966. (1)
2 . Aims of the research verb.
The general aims of the research work described in th is thesis
were to examine the problems of communication between the engine and
computer in a practical te s t installation and to demonstrate the
feasib ility of the computer nlaying an important part in the engine
development process. I t was fe lt that a university provided an ideal
environment for a study of this kird compared with an industrial
organisation, the la tte r being restricted by the demands of routine
testin g. A computer controlled test fa cility for a singlo engine was
6
-CHAPTER 2 .
AUTCVATICTT IP T?:E /IITC'PTI V" T”3iI5TRY.
1» Engine t e s t a c tiv itie s .
2 . Aims and objectives of te s ts .
3 . Some examples of t e s ts .
7
-1 • Engine te st a c tiv itie s .
Consideration of engine te s t a c tiv itie s carried out once the
engine is installed on the te s t bed reveals that a ll types of testing
combine the execution of certain basic te st operations. These operations
are listed
1. Setting un operating conditions.
2. ' Making measurements and collecting data.
3. Processing end presentation of collected data.
/*. Execution o f decisions based on measurements end
processed data.
2 . Alms and objectives of te s ts .
The purposes of testing may he broadly classified as either
performance or durability testin g . Performance testing i s concerned
essen tially with an examination of the process whereby the chemical
energy of the fuel is converted into useful work. The efficien cy of
th is conversion is the ch ief concern of the te s t, hut i t i s also
necessary for the engine to demonstrate such properties es adequate
lubricating o il and coolant flows.
Performance testing is thus characterised by the accumulation
o f a large quantity of data. The data must be processed and converted
in to a form which can easily be assimilated by the engineer. This w ill
necessarily involve data reduction, and information of th is type is
usually presented in the form of graphs. Attempts have been made to
automate the processing, conversion and accumulation individually, but
only when a l l three are automated together can any really significant
time saving be achieved in the croduetion of the completed resu lts.
The requirements of durability testing are of a d ifferen t nature
- 3
Data acquisition whilst running is of secondary imnortance unless
relevant to component l i f e end fa ilu re . The majority of data is
collected when the engine is dismantled for inspection on completion
of the te s t schedule. Less f le x ib ilit y is required with durability
testin g . The basic te s t operations however are s t i l l involved.
3. Some cx-noles of t e s ts . (4)
The specification of a typical performance and a typical
durability te s t are examined to establish current practices and to
indicate where automation can increase efficien cy .
Example 1 . To check f u ll th ro ttle power output for an
established type of production engine. The objective is to determine
the maximum power obtainable from the slowest stable running speed
to at lea st 250 R .P .l'. beyond tbe speed where maximum verier is
obtainable. The te s t ted conditions are made to resemble those of
»service ns accurately as possible. The following measurements are
taken over tbe range of speeds at intervals of 500 R .P J'. or le s s .
1 . Air intake temperature.
2. Engine speed with an accuracy of better than .t
3 . Engine torque " " " II II h ♦
A. Fuel flow rate " " " 11 II It 4
5. Air flow ra te .
6 . Sump oil temperature.
7 . Water outlet temperature.
8. Optimum ignition timing.
Barometric readings are required before and after the te s t.
At each point the te s t operator is required to optimise ingition
timing and mixture strength to give maximum torque. In addition
the speeds for maximum torciue and maximum power are determined.
The te s t involves approximately 13 groups of measurements. An
_ 0
nt each speed. On completion of the te s t the following data is
required in graphical form.
1 . Corrected brake horse oowar v .s . speed.
2 . Corrected brake mean effective pressure v .s . speed.
3 . Corrected toroue v .s . speed.
4 . Corrected specific fuel consumption v .s . speed.
The calculations required to present this data require a similar
amount of time to the te s t when executed hy hand.
The manual execution of th is te s t schedule i s compared with a
projected computer controlled execution in order to underline the
shortcomings of the manual approach.
The accuracy of the i n it ia l mechanical setting up of the engine
r e lie s solely on the efficien cy of the f it t e r responsihle. A computer
generated check l i s t would heln to ensure more rigorous observation of
gettin g up procedures and reduce the risk of te s ts being run under
improper operating conditions.
At each speed in the te s t n two-parameter optimisation process is
reauired. This is followed l-y the recording of several variables. The
recording w ill invariably include averaging noisy readings hy eye. I f
the optimisation and measurement were executed by a computer a higher
output data ouality could be achieved hy the systematic filte rin g of
moosurements. Sven the most simple computer controlled optimisation
routines can achieve comparable accuracy to the human operator. By a
slig h t re-arrangenent of the measurement procedure the corrected resu lts
could he made available whilst the to st was in progress. A single
parameter optimisation process could ho used to indicate the speeds
at which maximum brake horse power and maximum brake mean effectiv e
pressure occur. Furthermore, the computer can ho used to chock proper
operation of the engine during the te s t and shut down the engine i f any
10
-Example 2. A 391 hour endurance te s t. Tie objective of this
te s t i s to or owe the durability of origir.es and components. I n itia lly
the engine is run-in and then stripped for inspection. After the to st
the engine i s stripped once a go in for another comparative examination.
External control of o il and water temperatures is reouired to sinulatc
a severe environment. The measurement of o il leaks is also reouired.
The te s t consists of 67 cycles of a 5 hour 6C minute schedule.
This schedule is summerited in the table helow.
R.P.M. LOAD. TITS (minutes)
10C0 t i l 10
900 above max. fu ll 10
power
T'ax. toroue {■ f u ll 10
.90? max. power 4. fu ll 60
/.O^ max. power fu ll 60
/.Of max. power 1 fu ll 10
90? max. power fu ll 60
!'ax. tormue i fu ll 10
'tax. power fu ll 60
I'ax. power { fu ll 60 «
h The pressure drop across the o il f i l t e r is measured during the
la s t item of the schedule to indicate i f a renewal is reouired.
After each cycle the o il lev el is checked and a measured amount
added to bring the level within the prescribed lim its. After ever;/ 3rd
cycle the engine i s allowed to stand for 10 minutes, a measured nuantity
of o il is added to bring the lev el up to the fu ll mark and the tappets
are adjusted. After every Oth cycle a fu ll th ro ttle newer curve is
taken, crankcase blouhy Jo measured and compression pressures are checked.
11
-The condition of sparking plugs and contact breaker coints are
checked snd brought within specification. After every 22 cycles
the engine o il is changed.
The to st schedule requires frequent operator attention to
change load and speed conditions. Computer controlled sequencing
of the te s t conditions is a ll that i s required to relieve the te s t
operator of th is duty. Several servicing and checking operations
are required between the cycles of the schedule. Interfacing these
ooerntings is not considered feasible, but greater consistency would
be ensured i f the servicing were carried out, under the supervision
of the computer.
L. Projected computer f unctions.
In the evolution of the design of an ideal computer controlled
te s t f a c ilit y capable of performing functions such as those described
above i t is necessary to design a computer system structure which w ill
perform the following
functions;-1. Simultaneous control of several te s t c e lls , performing
a l l present and fcrseeable te s t routines with a minimum
of d iroct intervention by the te s t operator.
2. Acquisition and processing of appropriate te s t data.
3. Monitoring data for out-of-lim it conditions, and the
execution of appropriate corrective action.
L. Presentation of te s t data in an e ffic ie n t form with the
minimum of delay.
5. Provision of instrument calibration and functional checking
of te s t fa c ility operation.
6 . Interaction with the te s t engineer a t the highest possible
7 . To act ns a guardian to any te s t function that i t is
not feasible to in terface .and run solely under computer
control,
8. To process o ff-lin e data. For example, the assembly of
now te s t routines and the maintenance of stores inventories.
9« Permit operator intervention and access to control functions
at a l l levels when they ere reouired.
10. Provide a te s t program library .and storage f a c i l i t i e s for
other relevant data.V.
11. Perform, other reasonable administrative duties fo r the
t e s t f a c ilit y .
Two major problems e x is t in satisfying these requirements, namely
the development of a hardware structure and the development of programs
to control testing a c tiv itie s . The hardware structure must f u l f i l the
basic function of physically linking the te s t operator to the engine
via the computer. I t is the link between the computer and the engine
which presents the major problem. In comparison the link between the
computer and trie human operator i s well developed.
In the evolution of a hardware structure i t is necessary to
consider the extent to which automation is feasible and to decide on
the degree of centralisation required. Eoth w ill depend on the nature
of the te st function. At this time when operating experience of
computer controlled te st installations is minimal a small degree of
centralisation is desirable in order to permit operator intervention
between the computer and measurement and control actions. This
requirement defines the need for local control and measurement units
to permit te s ts to be run without reference to the oomputer i f so
desired. The provision of local control loops also relieves the
computer of the computation necessary to service thepe loops, which
in a sizeable installation would severely re s tric t the availab ility '
13
-The two functions of the engine/oomputer in terface are control
nnd measurement. A lin t of the variables moot frequently involved
in spark ignition engine testing is given
Controls
Throttle opening angle
Air/fuel ratio
Ignition timing
Coolant temperature
Lubricant' temperature
Dynamometer load torque
I'easure-iorits
Torque
Speed
Fuel flow rate
Air intake flow rate r
Air intake temperature
Barometric pressure
Crankcase blcwby
Ignition timing
Throttle opening
Coolant temperature
Lubricant tompersture
Dynamometer excitation current
Optimum methods of measurement and control of engine variables when
interfaced to a computer are by no means established. An objective
o f thin th esis is to examine some methods and to suggest practical
- 1L
Relevant experience gained in the chemical process industry
can be applied to the development of programs for engine teetin g .
The requirements of engine testing are in comparison more demanding
in so much that control functions must he executed more ouic>ly end
n highly adaptable rrogrsm structure is necessary. Program functions
f a l l into 3 categories.
1. Real time executive control of program subroutines.
2. Individual te s t control involving data acouisition,
processing and output.
3. O ff-lin e data processing, including the assembly of new
te s t routines.
Executive control programs ore already available for the majority
o f established process control computers: these have been developed
as o resu lt of the needs of the chemical industry. However, few
engine to s t control programs e x is t. To achieve f le x ib ility new
te s t programs should be as easy ns possible to write and co rrect.
This suggests the need for a high-level engine te s te r 's computer
language. Such a language cannot be developed without some f i r s t
band experience of computer controlled testing to indicate t^e
I e;
-ÇPAPTSR 3.
dfvti.c~'.'vtt of tttf T''liQ2-M£W
CCrHlTTl CO"TROLI"D TF3T FACILITY.
1 . The structure of the te s t f a c i l i t y . The te s t c e ll,
control room anti computer laboratory.
2 . A description of the engine, dynamometer and process
control computer.
3 . Instrumentation for the mathematical modelling studies.
4« Further instrumentation to f a c ilit a t e on-line testin g .
The development of the shaft torguemeter and ignition timing
control was undertaken jo in tly with another research student
■hi,
1• The structure of the te s t faci l i t y .
The choice of engine and dynamometer '.»ns made so that tho
resu lts of the study would be relevant to the automobile industry.
For th is reason the engine chosen was representative of the design
used to newer the majority of medium sized B ritish saloon ca rs.
Tiie type of dynamometer chosen for the study is to be found in
large numbers in te s t in stallatio n s throughout the automobile
industry.
A small fa s t process control d ig ita l computer with a general
purpose in terface was available in the school, and instrumentation
was developed to be compatible with th is computer in terface.
The development of the exploratory te s t fa c ility proceeded in
two stages. F ir s tly e le c tr ic a l control of engine operation from an
adjacent control room was established. This enabled mathematical
modelling studies and control system design to be carried out. Secondly
computer programs were developed and the appropriate interfacing
constructed to enable te sts to be run under computer control, the
control signals and measurements passing via the control room to the
ooraputer. Whilst under computer control the te s t operator's
requirements were communicated to the computer via the on-line
typewriter.
The various component parts of the test f a c ility are
described!-The engine te s t c e l l .
The engine te st cell housed the engine and dynamometer together
with their associated transducers and actuators. The test c e ll was
equipped with a cooling water main for the removal of waste heat from
the engine and dynamometer. There was a fan driven air supply and
extraction system and a compressed a ir supply'to power the dynamometer
- 17
The engine control room.
The control rop’n was adjacent to the engine te s t c e ll which
could he viewed through reinforced windows. The rem inder of the
engine control and instrumentation equipment was located in the
control room. Manual control of a l l te s t operations was possible
from the control console. Under computer controlled operation the
console was wired to the computer in terfa ce.
The comput er room.
The d ig ita l computer and i t s in terface were housed some 2*50 f t .
from the engine in another part of the school. This provided on
excellen t opportunity to study communication when the engine is
remotely situated. Connections bstws6n the control console and the
computer interface were made v ia coaxial cables. The on-line
peripheral equipment for the computer, consi sting of a typewriter,
pooer tape punch and paper tape reader were also situated in the
computer room. ’There resu lts were plotted by the computer during a
te s t sn analog X-Y recorder in the computer room was connected to the
in terface for th is purpose.
The engine . (Piñimao Punter).
The engine was a /-cylinder in -lin e engine with a capacity of
1725 c .c . I t has overhead valve gear operated by pushrods. The
particular version used was fitte d with an aluminium cylinder head
and developed a maximum of 80 B.H.P. (gross) at 5000 R .P J!.
The engine mas mounted on the te st stand closely resembled
the type fitted to the corresponding production vehicle. Only
modifications necessary to mount the engine on the stand and f i t
the instrumentation and oontrol systems have been carried out. Tbo
te s t ce ll exhaust system is of coi’reeoonding dimensions to that of
18
-The dmawri»ret"r. (rTeepxn and ?roitoe d:-n^motic .)
The dynamometer was coupled d irectly to the engine flyviheel
hy a short shaft incorporating rubber universal couplings. Fower
dissipation was by eddy currents which heat the inner surface of
the dynamometer sta to r. The heat was removed by a constant stream
of water pumped between the rotor and sta to r. The power dissipation
rate was controlled by adjusting the excitation current in the field
c o il. This changed the to ta l flux passing between the rotor and the
st"tu r, and the magnitude of the eddy currents. An a .c . tachometer
was fitte d a t the front of the dynamometer to measure rotational
speed and a damped spring balance and lever system measured the
dynamometer reaction toroue. The dynamometer has a maximum power
dissipation capability of 200 B.H.P. at 10,000 R.P.M.
The computer. (C-.’S.C. °0/?).
The computer has a 1 2 -b it word-length with 3K of core sto re.
The central processor operated in the p arallel mode and because of
the short word length and elaborate addressing f a c ilit i e s most
machine instructions occupied two words of the store, "umbers
were held in the machine in 2 's complement form. The memory cycle
time was 1.75 Hs .
The in terface provided the following f a c ilit i e s
Analom inputs. (9 b its nlus_ a si<?n b it .)
12 ♦ 100 v o lt/i 10 volt
5 ♦ 1 volt.
6 ♦ 100 volt.
1 ♦ 250 volt.
The settling time taken by the analog input multiplexor lim its the
random access sampling rate to a maximum of 100 samples per second.
Analog outwits. (9 h its olus a sign b it.)
19
-Di,<rit-»1 inputs.
8 1 -b it inputs in the for-’ of voltage level sensors.
These are referred to as 'S .E .S .' inputs.
Dig it« ! cutouts«
12 1 -b it outputs in tho form of relay closures.
P rio rity interrupt, system .
8 .levels. The f i r s t four lev els assigned to
:-1 . The input/output buffer associated with the on-line
typewriter, the paper tape reader and the paper tape punch.
2. The real time clo c k .
3. The analog input multiplexor.
4 . The digital outputs.
Clock pulse frequencies of 1000 Hz., 100 Hz., 50 Hz. and 10 Hz.
were available.
» The machine was programmed in the low-level assembly language
S.D .S, Symbol. The language has been modified to include mnemonics
fo r the particular in terface instructions sp ecific to the machine.
Instrumentation.
An instrumentation voltage range of 0 to +10 volts was chosen
for a ll the analog inputs and outputs from the control console and
transducers. This range was chosen for compatibility and to allow
the use of linear integrated circu its in the instrumentation. A
diagram showing the instrumentation end i t s availability to the
computer and looal ccntrols is given in fig . 3 .1 .
•
3 . Instrumentation for the mathematic«! modelling study.
The in itia l instrumentation and control systems were constructed
to enable a b«sic mathematical model of the engine and dynamometer to be
developed and experimentally verified. The model was developed to
20
-dynamometer field current as inputs end the -dynamometer speed end
equaling shaft toroue ns outputs. For the modelling study the
following instrumentation and control systems were required
1. Throttle angular position control.
2. Dynamometer field excitation current control.
3. Dynamometer speed measurement.
A*. Coupling shaft torque measurement.
These systems axe described in d etail below.
Throttle angular position co n trol.
No suitable angular position control for the th ro ttle was
found to be available and therefore a special purpose control was
designed and constructed. Hydraulic and pneumatic controls ’»ere not
considered since i t was deemed desirable to avoid the need for
hydraulic and pneumatic power supplies •>r.d the associated o lcctre-
hydraulic or electro-pneumatic valves. Three alternative types of
e le c tric drive for the th ro ttle spindle were considered, namely a .c .
and d .c. servomotors and stepping motors. The servomotors are
essen tially high speed low torque devices which reouire a gearbox
in order to supply adequate torque for the th ro ttle spindle accelerations.
A stepping motor can provide adequate torque with d irect coupling.
Also, the fie ld control of a stepping motor at low speeds is essen tially
a switching operation and can be achieved by low power devices. The
chief disadvantage with stepping motor actuation is that the output
angle is ouantised. For the purposes of the investigation i t was
f e lt that the simpler drive requirements of the stepping motor
warranted i t s choice.
A 200 steps per revolution stepping motor was used, A 5 steps
being reouired to traverse the throttle from fully open to fully
dosed. The motor output torque was sufficient to accelerate the
th rottle snindle up to the maximum slewing rate of 200 steps per
20
-dynamometer field current as inputs and the -dynamometer speed and
coupling shaft toroue ns outputs. For the modelling study the
following instrumentation and control systems were required
1 . Throttle angular position control.
2 . Dynamometer fie ld excitation current control.
3 . Dynamometer speed measurement..
Coupling shaft torque measurement.
These systems are described in d etail below.
Throttle angular position control .
Ho suitable angular’ position control for the th ro ttle was
found to be available and therefore a special purpose control was
designed and constructed. Hydraulic and pneumatic controls were not
considered since i t was deemed desirable to avoid tbs need for
hydraulic and pneumatic power supplies ->rd the associated e lc c trc -
hydreulic or electro—pneumatic valves. Three alternative types of
e le c tric drive for the th ro ttle spindle were considered, namely a .e .
and d .c. servomotors and stepping motors. The servomotors are
essen tially high sreed low torque devices which reouire a gearbox
in order to supply adequate torque for the th ro ttle spindle accelerations.
A stepping motor can provide adequate torque with direct coupling.
Also, the field control o f a stepping motor a t low speeds is essen tially
a switching operation and can be achieved by low power devices. The
chief disadvantage with stepping motor actuation is that tho output
angle i s ouantieed. For the purposes of the investigation i t was
f e l t that the simpler drive requirements of the stepping motor
warranted i t s choice.
A 200 steps per revolution stepping motor was used, ¿T steps
being reouired to traverse the th rottle from fully open to fully
closed. The motor output torouo was sufficient to accelerate tho
th rottle swindle up to the maximum sieving rate of 200 steps per
21
-control i s describee! with reference to fig . 3 .2 . The angular position
of the th ro ttle spindle was measured by a potentiometer which was
d irectly connected to the spindle. The th ro ttle position as measured
by th is potentiometer was cm oared with the demanded position, and i f
the error exceeded the width of one sten a gate was opened to connect
the pulse o sc illa to r to the appropriate input of the field drive c ir c u it.
The drive c irc u it commutated the motor field current causing a movement
of one step for each input pulse.
Open-loop operation was also available and the th ro ttle could be
stepped soouentially in response to the movement of a key switch. The
closed loop performance of the control was characterised by velocity
lim iting and output ouantisat.ion. A Kyquist plot showing the closed
loon transfer function for 25/' of fu ll output amplitude is shown in
f i g . 3 .3 .
Dynnnemote r f i e ld exc i t " tlon current, control.
A fie ld excitation current control and a closed loop sneed control
operating on field current were in it ia lly available with the dynamometer.
The innuts of these controls were not. accessible since they were neither
referenced to earth nor flo atin g . This, and the unsatisfactory
performance of the speed control led to the decision to replace both
the field excitation unit and the sneed control with units compatible
with the already established instrumentation standards.
The dynamometer field c o il when driven from a voltage source had
a time constant of approximately 0 .5 seconds. For the optimum operation
of control svstens which operate on engine load torque i t is desirable
to be able to make changes in th is torque as fa s t as possible. This in
turn requires rapid changes in field excitation current which can only
be achieved by driving the field c o il from a current source. A practical
current source must necessarily be limited by am plifier voltage swing and
22
-developed had an output voltage swing of - 60 v o lts and a maximum
output current of 2 amps. The h i-d ircction al output voltage capability
was particularly useful in effectin g fa s t reductions in field current.
Inputs to th is am plifier must be limited so as not to demand a reversal
of the field current which the amplifier is capable of providing.
(Dynamometers of th is type have an inherent rectifying capability in
as much as a current passing through them in el tber direction causes
a torque of the same sign.)
The current control am plifier consisted of three parts namely
1 . An integrated c irc u it operational amplifier to provide a
source of loop gain.
2 . A coupling voltage amplification stage.
3 . A multiple emitter follower with a current source load
to provide the large output current.
A circuit-diagram fo r the am plifier is shown in f i g . 3 .4 .
Speed measurement.
The speed control in it ia lly acquired with the dynamometer utilised
the existing a .c . tachometer to provide a speed measurement. The same
measurement was also used to drive the speed indicator. To make the
tachometer output compatible with the chosen instrumentation standards
i t has been scaled down so that 10 volts corresponds to 5,000 R.P.” .
The rectified a .c . speed signal necessarily contained ripple, and
since the acceptable level of ripple for various applications was not
known the signal was passed through a variable time constant f i l t e r .
The c irc u it diagram fo r speed measurement scaling and the variable time
constant f i l t e r i s shown in f i g . 3 .5 .
Shaft, torou yptpr.
A shaft torquemeter was deemed necessary to investigate the
response of the engine to fa s t changes in th ro ttle angle, mixture
strength end ignition timing. Po existing form of shaft torguemeter
was found suitable to instrument the counli.ng shaft and so a soecinl
torouerneter was developed for the purpose.
Bue to the short length of the shaft the only practicable method
of toroue measurement was by measuring shaft strain with strein gauges.
The toro« erne tor employed these connected in a bridge configuration. The
torque signal in the fora of a voltage analog was transmitted via brass
s lip rings and silv er graphite brushes. The i n i t i a l design of torquer.ste l
ine luded an integrated c irc u it amplifier on the shaft to boost the bridge
out-of-balance voltage. The oouer supply for the amplifier and the bridge
was also transmitted through slip rings.
The i n it ia l design suffered from lack of sen sitiv ity , poor slir>-rinf?
noise rejectio n and amplifier output voltage d r i f t . These shortcomings
were emphasized by the low strain lev els in the shaft which occur during
steady running. The shaft was designed to withstand the high transient
torques which occur dnrirg load changes, and when the engine is stopped.
The transient torques are up to 10 times higher than the maximum torque
delivered under steady running conditions.
An improved design of torquemeter was developed to overcame these
d iffic u ltie s. A .c. excitation was applied to the strain gauge bridge
to nullify the effects of amplifier d rift, and by transmitting the
toroue signal ns a freauency analog superior rejection of slip ring
noise was achieved. The operation of the improved design of transducer
is described with reference to fig . 3 .6 .
The voltage supply to the strain gauge bridge was derived from
the output of the comparator. The two output voltage levels of the
comparator are regulated with sener diodes. ’'.Tien the algebraic sum
of the integrator and comparator voltages reached zero the output of
the comparator changed sign and the direction of integration was
was d irectly proportional to the out of helance of the tria g e. This
c irc u it satisfied the requirement for an a .c . bridge supply as well
as providing a frequency modulated output. (O scillation w ill only he
maintained while the rate of change of integrator outnut voltage is of
opoosite sign to the bridge supply voltage.) Adjustments were made to
the bridge unbalance to bring the o scillatio n frequency into the range
1-1.3 kHz corresponding to the fu ll range of torque applied in a
positive sense. Poise rejectio n on the power supply slip rings was
achieved with a voltage regulator between tho s lip rings and the
measurement c ir c u it. Slip ring noise on the output was further reduced
by passing the frequency signal through a f i r s t order f i l t e r before
demodulation.
The demodulation was performed by s high accuracy monostable. The
action of the monostahle is described with reference to f ig . 3 .7 . At
rest the output voltage remained at the positive voltage 7„^+Vrz^. A
positive input pulse switched the output to the negative voltage 7z^+Vrz ^
Positive feedback v ia C2 ensured a fa s t decisive switch mg action. (The
zener diode defined the minimum n igative voltage excursion of the
non-inverting input of the am p lifier). The capacitor Cg charged through
and approached V^+V^ *Vrzj with a time constant RjCg. ',^10n the
non-inverting am plifier input voltage exceeds Vdl the output moved
positively again to V ~ +Vrzi^
The high accuracy was achieved by defining the voltage levels with
zener diodes and by ensuring decisive in itia tio n and termination of the
monostablo pulse. The pulse train output of the monostable was filtered
with a f i r s t order f i l t e r with a time constant of 10 milliseconds. The
overall accuracy o f th is torque measurement was limited to 2? of fu ll
26
-4 . Fnrtber. Instrum entation to f a c i l i t a te On-line T esting.
Further instrumentation was developed to provide local, controls
and measurements for the purposes of local optimisation and exploratory
computer-controlled testin g . This instrumentation is listed :~
1 . Coolant temperature measurement.
2 . Lubricant temperature measurement.
3 . Fuel flow measurement.
4 . Dynamometer torque measurement.
5. Air/fuel ratio control.
6 . Ig n itio n timing control.
7 . On/off control of sta rte r, ignition, and cold starting
device.
8. Oil pressure measurement.
These systems are described in d etail below.
Coolant temperature measurement.
In a veh icle closed loop control of coolant temperature is
normally provided by a thermostatic valve in the cylinder head outlet
pipe. Tliis method of control was not adopted, on the te s t bed since i t
did not permit adjustment of the setpoint. A negative temperature
co efficien t thermistor was used to measure the water temperature in the
cylinder head o u tle t rip e. This measurement was employed in the closed
loop control o f coolent temperature. The control element was a
motorised mixing valve which directed part of the flew through a heat-
exchanger. Wien the te s t r ig was under computer control water temperature
was monitored fo r out of lim it conditions by sampling the thermistor
measurement. The c ircu it associated with th is thermistor which provided
an e le c tric a l analoe of temperature is 3hown in f ig . 3 .8 . The normal
temperature range of the engine gave an output between 2 and 7 v o lts.
Lubricant temperature measurement.
Under t e s t bed operation there is l i t t l e or no forcod cooling
27
-cooling Mid closed loop control of lubricant temperature. The
measurement end control systems were very similar to those applied
to the coolant temperature control system. The thermistor prohe
was situated at the in le t to the main o il g allery .
Fuel flow measurement.
The purpose of measuring fuel flow was to employ the measurement
in optimisation processes and the automatic plotting of mixture loons.
For th is reason a hot-film mass flow measurement system providing a
continuous e le c tr ic a l analog of fuel flow rate was chosen. A commercial
hot, film transducer was acquired and the transducer was fitted between
the carburettor flo a t chamber and je t .
The fuel flow meter had a response which extended up to several
kKz. In order that pulsations in fuel flow rate should not give rise
to aliasing errors when the measurement was sanded by the computer a
third ordsr f i l t e r was interposed to lim it the bandwidth to 5 Kz.
Dynam o-- e t ,° r t o r r u a ~ an r o d e n t •
To provide a mechanically filtered measurement of tcroue a
potentiometer was coupled to the indicator of the dynamometer weighing
gear. The output, of the potentiometer was scaled to give an e le c tr ic a l
analog of toroue, +10 volts corresponding to ICO lb^. f t .
A ir/fUel ratio con trol.
iir/fu e l ratio control was achieved by adjusting the pressure
applied to the carburettor float chamber. The control was effected
by connecting an angular position control to the adjustment spindle
of a mechanical pressure regulator. A c ir c u it diagram of the control
is given in f ig . 3 .<5. The pressure range corresponding to the 0 to +10
volt input was - 7f inches of water. The pressure regulator was also
used to form part of a constant fuel flow ra te control loop. The
action of the control was to adjust the flo a t chamber pressure in
response to t'-e integral of the orror between measured and demanded
23
-Ignition timing contr o l •
An electron ic means of ignition timing and firin g Mas chosen
in order to eliminate the mechanical imperfections of the contact
breaker system. The electronic system relied on the monitoring of
crankshaft rotation by two photoelectric transducers. The monitoring
was carried out from an annular plate fitted to the flywheel. The
outer rim of the annulus passed through the transducers and was
drilled with circu lar holes on two pitch c ir c le s . The outer pitch
c ir c le had holes spaced at 1° intervals whilst the inner c irc le had
two holes spaced 180° aoart, positioned so that they massed through
the transducer rO ° B.T.D.C. The timing system is described with
reference to f i g . 3«1C.
A square wave, oe.ch cycle of which corresponds to 1° of
crankshaft rotation, was darived from the outer transducer and
passed via the gate to a 6 -h it counter. Pulses from the inner
transducer opened the gate to in itia te counting.
The count in tho reg ister was converted into a voltage in the
analog to d ig ita l converter, which formed part of the timing system,
'/hen th is voltage exceeded that of the analog innut the comparator
changed sign which caused the ignition firin g c ircu it to he triggered.
At th is stage the counter was re s e t. To ensure decisive triggering
the comparator employed positive d .c . feedback.
The ign ition firin g c irc u it operated on the capacitor discharge
princip le. A standard ignition c o il was used as a pulse transformer.
The firin g system could also he triggered from the contact breaker
points when the existing distribu tor advanee ch aracteristic was
required.
The system controlled ignition timing over a 6/,° range,
2 °
-On/off contro l of ij.nitir-n, st a rter and cold sta rtin g device.
C ircuits were constructed to enable the starter and ignition
to be operated from relay closures which form the d ig ita l outputs
of the computer. ' A solenoid operated control which also responds
to a contact closure brings into operation the cold storting device.
O il pressure measûrement•
A pressure operated switch, o f the type normally used to operate
a vehicle warning lig h t, is connected so as to provide a 1 -b it d ig ita l
indication of o il pressure for monitoring purposes when the engine is
P*
IG. 3 1.
ENQlN E / DYN AM O M ETER CONTROL SYSTEMS
3
i
r
n
H
n
Z
0
5
>
2
-(
3 2
O U
I
y
inLi (O
CJ
o
lö
(O co
a
-C
O
M
P
A
R
A
T
O
3.
7
H l< 3 H S T A B lU T V M O N O S T A B L E .36
-Wi
ul
y-D O
\4
- L0
-C'VPTSR / .
;,ATi;Tr:ATio/i. rcDELiirG stjdy. .
1 . The scope of the modelling study.
2 . The model and i t s derivation.
3 . Experimental v erificatio n of the model.
I,. Dynamic equations and the analog computer simulation.
5. A comparison of identification methods.
6 . Conclusions o f the modelling studies.
The derivation of the e le c tric a l c irc u it model and the sta te space
équations was undertaken jo in tly with J.Konk.
The system iden tification using pseudo-randor. binary senuences
(P .R .B .S.) was carried ou*, by J .Monk.
The id en tificatio n using wide-hand Gaussian techniques was carried
Al
-1 • Scopo of tho mathematical modelling study.
A mathematical modelling study of the engine and dynamometer
was deemed to be of value in promoting an understanding of the
in teraction s o f the physical components of the to st r ig . A lumped
e le c tr ic a l c ir c u it form for the model was chosen because of the
ease with which the physical components of the system could he
associated with the elements of the model. The sarapled-data form
of representation (5) was not adopted since th is form of representation
is only valid at a fixed speed. Also most of the variables with which
the model was concerned were continuous. ’'iTiere they were not continuous
sampling rates were comparatively high and so the added complexity of
th is form was not considered ju s tifia b le . Subsequently in chapter 7
some e ffe c ts o f sampling are considered. An appropriate form of control
strategy for the type of te s t rig upon which the study is based has been
developed from the model. The tra n sfer function of the model between
dynamometer fie ld current and speed was u tilised in tho design of an
analog speed control system.
The model represented the small signal transfer functions between
th ro ttle angle and dynamometer field current as inruts and shaft torque
and dynamometer speed as outouts at an operating point in the middle
of the torque speed range.
The theoretical transfer functions of the model at this ooerating
point are compared with those obtained from the rig it s e lf by sinewave
testin g . The dynamics of the te s t rig were also identified by two
other research students using correlation techniques with F.H.G.S. (6)
and wide-band Gaussian inputs. Their results are includod for comparison.
2 . The Kodel.
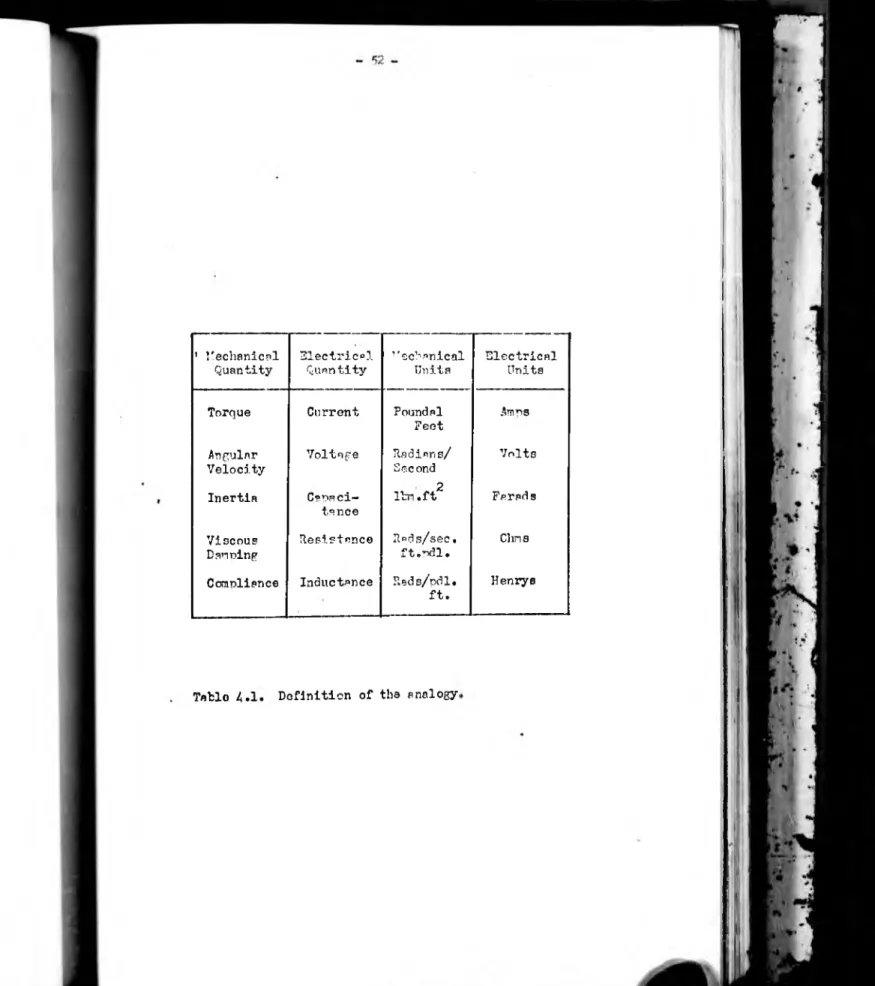
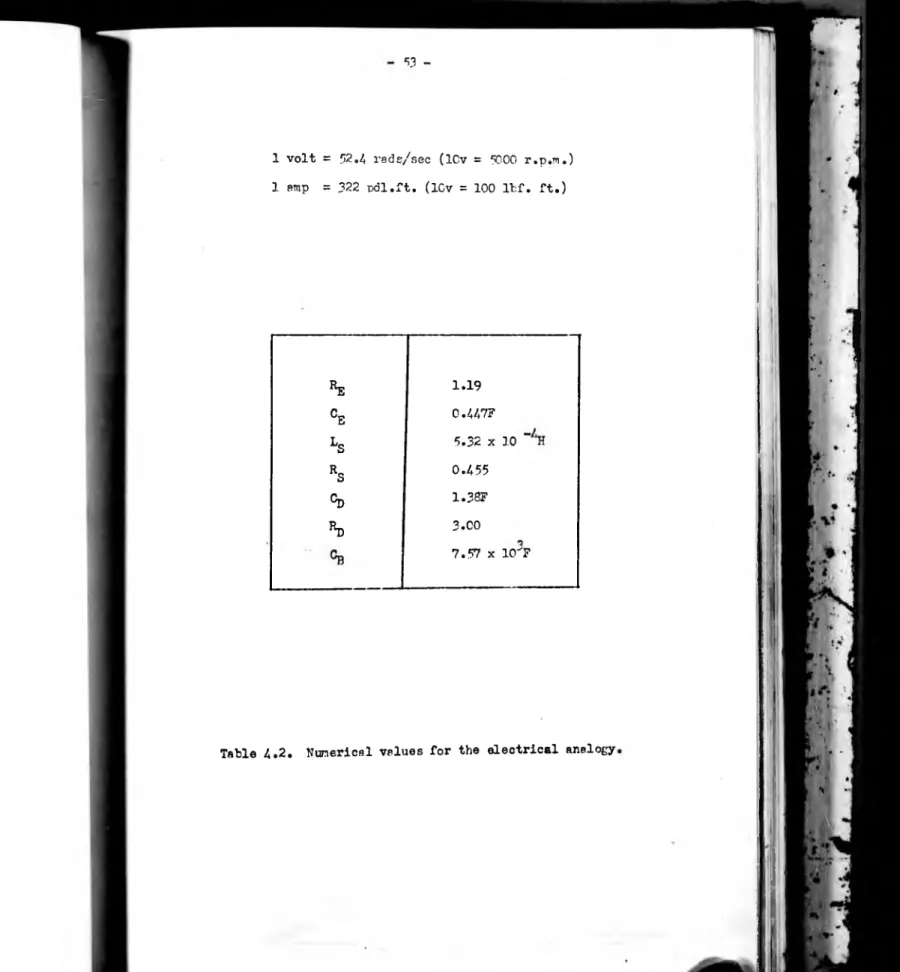
The basis of tho electro-mechanical analogy used in tho plant model
is the formal sim ilarity of the mathematical equations describing the
¿2
-in table 4•1• I t w ill bo appreciated that the choice c f current to
represent torque and voltage to represent angular v elo city is arbitrary,
and could equally well have been reversed, in th is case an inductance
would be used to represent a moment of in e r tia and a capacitance
compliance. (7)
The model was developed in itia lly to represent the system under
steady state conditions about a chosen operating point in the middle
o f the torque and speed ranges. To extend the model so that i t would
represent the system under small signal dynamic conditions at th is
point the energy storage elements and time delays were added. Their
interactions end magnitudes were evaluated by structural considerations
and dynamics measurements.
The engine toroue/speed curves for the fu ll range of th ro ttle servo
inputs are given in fig . 4 .1 . D iffic u ltie s were encountered in obtaining
the curves in the low speed and high torque regime due to unstable
operation, and an explanation of th is is presented la te r in the chapter.
The curves in th is regime were obtained using s proportional speed
control which acted upon the dynamometer fie ld current. The engine
is represented by a voltage source, V^, with internal resistan ce, Rg,
shown in f i g . 4 .2 a . The slope of the torque/speed curves remains
substantially constant for the fu ll range of th rottle settin g s. Vj? is
given by the intercept of the tangent to the toroue/speed curve with
the speed a x is . The slope of this tangent equals - l A j,. The model
structure is valid throughout the torque/speed range of the engine.
At low speeds with large th rottle openings the slope of the ch a ra cteristic
changes sign. Under these conditions Rg becomes negative. Vj, i s a
function of th ro ttle opening, which is governed hy the input voltage
to the th ro ttle servo VT. The relationship between VT and VE is shown
in f ig . 4.3b . I f the low speed high torque regime is excluded the