STAT305
Summer Research Project
2006-2007
The Application of the
Support Vector Machine to the Classification
Olivia Son
STAT305
The application of the
Support Vector Machine
to the Classification
Olivia Son
Deptartment of Mathematics
&
Statistics
Abstract
A classification technique, known as Support Vector Machine (SVM) is applied to
tobacco data from the SYFT technologies Ltd. The SVM is used to classify illegal
from others. Decision tree is performed prior to SVM a.fld these two classification
methods are compared by rnisclassification rate for the accuracy of classification
performance.
Introduction
During the past few years, the number of classification techniques has
increased with the rapid growth of technology. Amongst all these new
techniques, one that has become increasingly successful in discriminative
approaches to pattern classification as well as in regression problems is
a technique called Support Vector Machine (SVNI).
The foundation of Support Vector Machines (SVl\ll) has been developed by Vapnik in 1995 and is increasingly gaining reputation due to its many
attractive features.
The project is created from a set of tobacco data that is provided from
the SYFT technologies Ltd. The SYFT Ltd creates a mass spectrometer which analyses the gas composition and volatile compounds to detect
illegal shipment. The data are divided into four categories, 'legal', 'illegal',
'general cargo', and 'possible'. 'Legal' contains legal tobacco shipment,
'illegal' contains illegal tobacco and 'general cargo' contains neither of
illegal and legal shipment. The last class 'possible' is the data that do not
belong to any of other classes. The main task of the project is to detect
'illegal' from other classes, The way to approach this is performing the classification that enables to separate illegal from other classes.
Initially, it was assumed that illegal and legal are not well separated as
illegal would tend to be hidden in legal. However, by looking at the
scatter plot of the data, it is found that the illegal is well separated from
In order to separate illegal and general cargo which are not well separated, there is a need to apply a good classification technique.
Another classification technique called 'decision tree' was attempted first. While decision tree has a number of properties, such as not requiring any prior assumptions resembling a type of probability distribution of the class and other attributes, it is also limited in a way that it can only perform the classification linearly along the direction of the axis. In order to cope with this problem, a classification method which is more flexible and allows non-linear classification was required
Firstly, the classification technique called decision tree has been attempted. While decision tree has a number of properties, such as not requiring any prior assumptions resembling a type of probability
distribution of the class and other attributes, it is also limited in a way that it can only perform the classification linearly along the direction of the axis. In order to cope with this problem, a classification method which is more flexible and allows non~linear classification was required. Therefore, Support Vector Machine (SVJVI) is chosen as such a method and the project is designed to apply the Support Vector Machine to classification on to the tobacco data.
The performance of classification is evaluated by misclassification rate.
It is predicted that the SVJVI will perform better classification than the method of decision tree clue to its property especially ability to
classifying nonlinearly.
Methodology
Support Vector Machine (SVM)
S upport Vec tor Machin e was inve nte d by Vladimir Vapnik. It is a method to create a model from a set of training data. It illustrates the decision boundary by using a subset of the training exa mpl es, known as Support Vec tors. The reason this method is used for the project is because SVM can classify data non-linearly and has the abi lity to handle large feature spaces since comp lexity do es not dep end on the dimensionality of the feature space . Moreover, the sparseness of so lutions when dealing wit h large data sets is on ly because th e support vec tors are used to find th e separating hyperplane.
Linear Classifier
To illustrate the basic idea of SVM, the s implest case of SVM of linea r class ifie r is introduced .
•
•
•
•
•
•
•
•
• •
•
•
•
•
bes t way. In order to find the optima l separating hyperp lane, th e concept of a ma x imal marg in hyperp la ne is used . Th e advantage of using ma x ima l margin is th at it ignores othe r trai ning data as it on ly needs s upport vectors w hi c h defin es th e hyperplane and works very we ll e mpiri ca lly.
l\!Iaximising l\1argin
Margin of a linear classifier is the width that the boundary could be in creased by be fore hitting the nearest datapoints. S upport v ec tors are th ese nearest datapoints that the margin pushes up against.
" /
0
0
0 St1111ples 0
' 0 '
\~g~n
\'.~th positive
lnbel /
0 0
,o
/; 0
0 /
/
" / 0
,IJ' ; _. 0
/ ' Samples
O with negative 0
label
/ 0
0
/ /
0
"
0
/
I
"
Hyperplane with sma ll margins is more fl exibl e and is able to fit many training data. Thus, th e s ma ller the margins of the hyperp lane a re, t he grea ter the capac ity. However, according to the SRNl princip le, the margins with hig her capac ity have the greater genera li s ing error. To minimize th e generalisation e rrors, the hype rplan e must have the
Support vector to feature Space
So far , th e cas e of lin e arly s e parable data is consid e re d. Howe ve r , the
primary reas on for us ing the SVM for this proj e ct is to e nable SVM to
separate the data non-lin e arly. When the data is not line arly sepa rab le,
SVM maps the data into a high e r dimens ional s pac e calle d 'fe ature s pace '
by usiflg fun ctions known as kerne ls . The n SVM creates a separating
hype rplan e in the feat ure spac e to class ify the data in the spac e . This
ke rne l tran s fe rring function is powe rful in tha t it do es not nee d to
re pres e nt the s pa ce explicitly all we ne e d is s imply de fine th e ke rne l
function
•
•
•
•
,.,•
•
. . • .•
, . I \• •
_,-·
•
•
!
<.11: ri> _ _(J:<)--" '
.'
•
X -.••
•
•
•
•
.,•
••
.,•
•
•
•
' '•
' . ,•
.,
'•
• •
•
,,
· ..
•
•
•
•
., '' '
There are infinite ly many ke rne ls function s, but th e four main types th at
are commonly used in Support Ve ctor Machines are :
Linear: u' * V
Polynomial: (gamma*u' *v + coefOY'degree
Radial basis function(RBF): exp(- gamma*
I
u-vl "2)Sigmoid (feed-forward neural network): tanh(ga mma *u' *v + coe fO)
A polynomial is a popula r me thod for non-lin e ar mod e ling. Howe ve r , RBF
is mos t popular kerne l amongst four fun ction s due to the numb er of
advantages .
e nables to transfe r original da ta into a hig he r dime ns ion feature s pace non-lin early, so it can dea l with non-linear re lations hip of the class and attributes. The RBF ke rn e l tra nsfe rs samples non-linea rly into a highe r dime nsional s pac e, so it can de al with the case wh e r e the re lation between the class la be ls and the attrib utes is non-linear unlike linear ke rne l. Furthermore, for ce rtain parameters, the s igmoid ke rne l be haves like RBF a nd a lso REF ke rn e l has less hype rp a rame ters th an the
poly nomial kernel.
Thus it is recomme nde d that RBF ke rn e l is th e most s uitable mode l to use .
Now Consid e r how each ke rn e l mode ls pe rforme d as class ifie r. Eac h of ke rnels mode l de monstrates class ification of non-linear data which is the res ult of transformation by its function.
Kernel functions supported by DTREG:
Linear: u' *v
~ 2D E ~ample space
-1 + .It'
! •• ••
I
I a. •• . • •• o ·I
1
.·. .·.: . .... . . .
• • . [!) •
.
...
.
.
•...
• •••
i • • ; : •
....
f • • • •
I • e •
•
•
• •
-•I. • •• • ••
I • ,:: • •. •• • •
l •
·~.
• •••
-t • • •• .... • • ., .... ,
j • • • •
!
.,.. • • • • • •• • •
#l • • • • • • • - . , ;
,_:_ ~~ • • • -9.0 • • •
Polynomial: (gamma*u' *v + coefOY'd e gree
Nonlinem sepnml on IXlun<l ~liY 2D Example space
~
•• C!iJS:l 1 .V = +·t
• •
0 •
#
-il - •
I
.
0 CfJSS 2, )' =- I
•
•
I
•l__ • •
Radial basis function: exp( -gamma*
I
u- vI
/\2)Do 0 D0 o0o D D
0 9----~, 0 0
, ' 0 ', D D
D D
o~oo9...'h o~
D 1 0~0 I D
' 08
0 - /0 \ 0 -q/ D D
' ... -.,.~ D
oDD Do 0
0
• 1!1
• •
• ~
•
•
~ e~ L'.nth e !.' ~tt ··-..i:itnt : u t. ·,,·i t!_ Hi\:!in.: Dte·l·! :e- n. ~·: t:.tnniu ! .; :!.
Ci:·-:: \ n ·~ t .-~l \1 t·. L l'~·t ~ ~~-: t::.i ! . ;1 [ -: ta(<•. I :it! ! t.: :·~ ·: ,tl t r t· -:; ; ,u ~
- 20 Example space - 20 Example space
•
•
•
• •
~ +il!WI
• •
• D ·•
w
~ - 0
1!1 • •
• • • I!J
• • •
:t3 . 0
0 1!1 • • •
,
• • • •• •• w•
1!1 • 0••
••
-3 . Q
G
I " •
..
•
•
•
0
..
D •
,
...
"'• 0~·-
...
•
•
••
3 . 0 •
...
•..
0
• 0
•
l
.
..
• •
1!1 # '1!1
• • • •• •
.
:.~ r.t..,
•-. 0 0 D 0•
,..
· ~•
. ,
•
·,~·· ··:·.,
0
,.
I I' +3 ~ .0 I
• 0
.
1!1 ~~ , • • .. • • !:. 1!1 1
.I
Sigmoid (feed-forward neural network): tanh(gamma*u' *v + coefO)
0.9 /---~
a.a 8.7
I
9.6 a.5 0.4 0.3I
I '
0.2
a. 1
/
e
-6 -4 -2 e 2 4 6
Even though, SVM is us e d to produc e a hyperp lane that idea lly se parates the feature vectors comp le te ly into two non-ove rlapping g roups , perfect separation may not be possible, or it may produc e a classifie r with a large numb e r of fe a ture vector dimens ions that the mode l does not genera lize well to other da ta , which is known as over fitting.
..
..
0 0 D 0 ,.,. ,. "
;:(
/
r
/ 0
D
ftl
; ;
,
D ):::(
, ,. / ,
..
r ,..
, ,. ,. ; ;,
/ / , " / ;,.
, ; ,,.
..
To a llow some fle xibility in separating the data , SVM has a cost
misclassifications. If the value of C increases, then the cost of misclassification also increases and leads to a more accurate model which may not generalize well.
Another paramP.ter that is used in kernel functions is gamrna which is the width of kernel function.
Default
SVl\II
used 1n R
To apply SVJ\II to the tobacco data, the package of e 11071 in the software R is used. The default setting of SVJ\II used in R is as follows.
Firstly, the kernel function used is RBF kernel and the parameter gamma is defined by the formula gamma
=
if Cis.vector(x)) 1 else 1I
ncol(x). The parameter C is 1 in default. The type of SVM used is nu~ classification. Resubstitution method is used as misclassification rate.l\!Iisclassification Rate
The performance of the classification work IS evaluated by
Miscassification Rate. In the l\!Iisclassification rate, there are two types, Resubstitution and Cross Validation Rate.
As mentioned before, traing set of data is used to define the classifier then the testing set of data is used to assess how well the defined classifier performs. For the Resubstitution, the same data is used twice as training and testing set. Thus resubstitution has a high risk of underestimating the misclassification rate. However, Cross-validation is the leave-one-out form in that it removes each observation in turn to define the classifier. It then tests if the leave-one-out classifiers correctly classifies the removed observation.
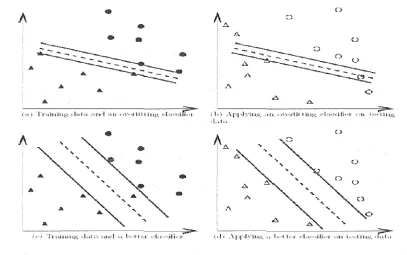
Figure l(a) and 1 (b) as the training and validation sets in cross-validation,
the accuracy is not also sensible. However, classifiers in l(c) and l(d)
which do not over-fit the training.
A
•
•
•
IIIII~£,
-~·0
£,.
u
/\
0
(1•.1 ... Applyiu.u, ·'IH •-•V••dittlH!.f. ···Lt~:~:ifi•'l ,-,u f•_•:-lill,i!,
,L~c.
( )
r:..,i~llr\--, 1 ~·\.n 1{\··-~rtin·Jnq; .;::·l~~:~ ... iHc·r .:•nd .:~ lll·t·l.••l""' <·L··~:-:-.ili~·l' ( . :111•1 .A Luunll1r.,.; :l.:d·:1, '
-:•ud i(·~-.rilH.!: daLt:,,
Thus it is recommended that cross validation ts better to use for
[image:12.595.101.509.190.445.2]Application
The Summary of Decision Tree
Pruned Tree Using CV Misclassincation Rate
CHEiv\81 0.02515
I Classification Matrix
CHEM3 0.37835 CHEt'(HL_Q_,_ 5 '1095 datamcpred Illegal General Legal Possible Cargo
CHEiv\5 0.15915 CHEiv129 < 2.1993 lllegal 11 3 0 0 positive negative
. CHEI0l12_Q0044 . CHE~ .s_Q0288 negative negabve
General
442
20 0
Cargo
Legal 0 ~
89 0
1
positive negat1ve negabve actual Possible 0 0 0 0
Before attempt SVM, the Decision tree method is tried for this data. The actual which is illegal is well classified with the misclassification rate of 0.19.
Demonstration of SVM on IRIS data
Before conducting the SVM to the tabacco data, the SVM example on Iris data is observed. The iris data is an established data that is used for demonstrating how to perform classification algorithms. This iris data have four features of the iris, and the aim is to classify the groups of iris based on these four features. In order to visualize the SVM performance, only two features of petal length and the petal width are taken into
account since they contain the most information about the class.
Pet l
Vl!rclth
•
+
•
•
••
+ ++ tJ.l:.. #. •••
*++++.+
••
.... 1 .
•
..
+ ViginicaVcrs ilcolor
Setosa
ret., I
e gth
F J.. u RE· ~1. l: Iris lata t
2.5
2.0
~ 1.5
$' '<U a> Q,. 1.0 0 .5 0 X 2
SVM classification plot
3
XX X
0 Ill<)( )()()(
X OO<X X
O ll!lXJ>(X)
cooo 0
co oco
4 5
Petai.Length
6
As it is illustrated in Figure 4.1, the Versilcolor and Setosa classes can
easily be separated by a linear classifier, whereas, the separation between Versilcolor and Viginica is not simple. However, it illustrated that the SVM performs well as there is only misclassification of 2 between versicolor and verginica
pred setosa versicolor v1rgm1ca
setosa versicolor virginica 50 0 0 0 48 2 0 2 48
Then this method is tried on the Tobacco Data
5
0 u
·~
Q)
>
"'
UJ
Default application of SVM to tobacco data
Misclassification rate shown,
Classification Matrix
pred llegal General !Legal Cargo
Illegal 8 0 0
General
Cargo 13 548 78
~egal 0 0 13
possible 0 0 0
!Possible
0
0
0
0
Misclassification rate
=
#misclassifiedI
#total=
(13+ 78)/(8+ 13+ 548+ 78+ 13)=
91/660=
0.138Now actual which is illegal did not have large misclassification rate with
others, however, we found that there is high misclassification rate
l)etween legal and general cargo, thus even the prime aim of the
research is to classify illegal from others, we need to improve the SVM.
In order to improve the SVM, it is suggested to change the parameter of
gamma and cost or attempt other kernel functions.
The value of Default gamma is 0.02, so the values of gamma 0.2 and
0.002 are attempted. However, no improvement was observed by the
same classification matrix, hence there is no change in misclassification
rate. The only support vector has changed from 230 to 330 when gamma
of 0.2 is attempted and to 331 when gamma of 0.002 attempted.
By default, the value of the cost parameter is 1, so the values of 10 and
100 are attempted. However, no improvement was observed again by the
same classification matrix, hence the same misclassification rate. The
Result
The misclassification rate of 0.0091 for decision tree and 0.138 for SVM
indicate that Support Vector Machine does not perform as well as the
decision tree for this set of data 0.138.
Changing the default settings of gamma to 0.2 and 0.012 and cost to 10
and 100 do not improve the performance of the Support Vector Machine
for the Classification.
Future Work
There are a number of suggestions to improve the SVM for classification.
The accuracy of an SVM model is largely dependent on the selection of
the model parameters. The attempt of changing the parameters of gamma
and cost in a wide range of the value and observing its affect on
misclassification matrix will enable to find the Optimal Parameter Values.
Secondly, it is suggested that using the Cross- Validation method as
misclassification rate will test the accuracy of classification performance
more precisely.
Lastly, even though the REB is the most well-know kernel, it is also
suggested to attempt other kernel functions for this data, since another
Reference
Pg.150-151, 168-169, 256-257 Tan, P. (2006). Introduction to Data
Mining. Boston: Pearson Education Inc.
Pg.371-389 Hastie, T. (2001). The Elements of Statistical Learning; Data
Mining, Inference, and Prediction.
http://www-users.cs.umn.edu/~kumar/clmbook/ch4.pdf
http://www.iro.umontreal.ca/~pift6080/documents/papers/svm tutorial.pp
t
http://www.ecs.soton.ac.uk/~srg/publications/pdf/SVl\II.pdf
http://www.cltreg.com/svm.htm
http://en.wikipedia.org/wiki/Support vector machine
http://v-.r\\'W.iro.umontreal.ca/~pift6080/documents/papers/svm tutorial.pp
t
http ://www.csie.ntu.eclu. tw/ ~cjlin/libsvm
http ://www.csie.ntu.eclu. tw/ ~cjlin/papers/guide/ guide .pdf
Appendices
> library(e1071)
Loading required package: class ## classification mode
#default with factor response:
>model<- svm(category- ., data= datain) > x <- datain[,2:51]
> y <- datain[,l] > print(model) Call:
svm(formula = category - ., data = datain) Parameters:
SVM-Type: C-classification SVM-Kernel: radial
cost: 1
gamma: 0.02
Number of Support Vectors: 236 > summary(model)
Call:
svm(formula =category - ., data = datain) Parameters:
SVM-Type: C-classification SVM-Kernel: radial
cost: 1 gamma: 0.02
Number of Support Vectors: 236 ( 21 125 90)
Number of Classes: 3 Levels:
actual negative positive possible # test with train data
> pred <- predict(model, x) #(same as:)
# Check accuracy:
> table(pred, y) y
pred actual negative positive possible actual 8 0 0
negative 13 548 78 positive 0 0 13 possible 0 0 0
>
## Default S3 method:0
0
0
0
>
svm(x, y = NULL, scale = TRUE, type = NULL, kernel =+ "radial", degree= 3, gamma= 0.2,
+ coefO = 0, cost= 1, nu = 0.5,
+ class.weights =NULL, cachesize = 40, tolerance= 0.001, epsilon= 0.1,
+ shrinking = TRUE, cross = 0, probability = FALSE, fitted = TRUE, subset, na.action = na.omit)
Call:
svm.default(x = x, y = NULL, scale = TRUE, type = NULL, kernel = "radial", degree= 3, gamma= 2, coefO = 0, cost= 1, nu = 0.5, class.weights =NULL, cachesize = 40, tolerance = 0.001, epsilon= 0.1, shrinking =TRUE,
cross= 0, probability= FALSE, fitted= TRUE, subset, na.action = na.omit)
Parameters:
SVM-Type: one-classification SVM-Kernel: radial
gamma: 0.2 nu: 0.5
Number of Support Vectors: 331
>
# test with train data>
pred<-
predict(model, x)>
pred<-
fitted(model)>
>
# Check accuracy:>
table(pred, y)y
>
# S3 method for class 'formula':>
svm(formula, data = NULL, subset, na.action =+ na.omit, scale = TRUE)
Error in as. vector(x, mode) : cannot coerce to vector
>
## Default S3 method:>
svm(x, y = NULL, scale = TRUE, type = NULL, kernel =+ "radial", degree= 3, gamma= 0.002,
+ coefO = 0, cost= 1, nu = 0.5,
+ class.weights =NULL, cachesize = 40, tolerance= 0.001, epsilon= 0.1,
+ shrinking = TRUE, cross = 0, probability = FALSE, fitted = TRUE, subset, na.action = na.omit)
Call:
svm.default(x = x, y =NULL, scale= TRUE, type= NULL, kernel= "radial",
degree= 3, gamma= 0.002, coefO = 0, cost= 1, nu = 0.5, class.weights =NULL, cachesize = 40, tolerance= 0.001, epsilon= 0.1, shrinking= TRUE,
cross = 0, probability= FALSE, fitted= TRUE, subset, na.action = na.omit) Parameters:
SVM-Type: one-classification SVM-Kernel: radial
gamma: 0.002 nu: 0.5
Number of Support Vectors: 331
>
# test with train data>
pred<-
predict(model, x)>
# (same as:)>
pred<-
fitted(model)>
>
table(pred, y) ypred actual negative positive possible actual 8 0
negative 13 548 positive 0
possible 0
>
# adopt new cost = 100>
0 0
0 78 13
0
>
## S3 method for class 'formula':0 0 0 0
>
svm(formula, data = NULL, subset, na.action =+ na.omit, scale = TRUE)
Error in as.vector(x, mode) : cannot coerce to vector
>
## Default S3 method:>
svm(x, y = NULL, scale = TRUE, type = NULL, kernel =+ "radial", degree= 3, gamma= if ( is.vector(x)) 1 else 1 I ncol(x),
+ coefO = 0, cost= 100, nu = 0.5,
+ class.weights =NULL, cachesize = 40, tolerance = 0.001, epsilon= 0.1,
+ shrinking = TRUE, cross = 0, probability = FALSE, fitted = TRUE, subset, na.action = na.omit)
Call:
svm.default(x = x, y =NULL, scale= TRUE, type= NULL, kernel= "radial", degree = 3, gamma= if (is.vector(x)) 1 else 1/ncol(x), coefO = 0,
cost= 100, nu = 0.5, class.weights =NULL, cachesize = 40, tolerance = 0.001, epsilon = 0.1, shrinking = TRUE, cross = 0, probability = FALSE,
fitted = TRUE, subset, na.action = na.omit)
Parameters:
SVM-Type: one-classification SVM-Kernel: radial
I
Number of Support Vectors: 330>
# adopt new cost = 10>
>
## S3 method for class 'formula':>
svm(formula, data = NULL, subset, na.action =+ na.omit, scale = TRUE)
Error in as. vector(x, mode) : cannot coerce to vector
>
## Default S3 method:>
svm(x, y = NULL, scale = TRUE, type = NULL, kernel =+ "radial", degree= 3, gamma= if ( is.vector(x)) 1 else 1 I ncol(x),
+ coefO = 0, cost = 10, nu = 0.5,
+ class.weights =NULL, cachesize = 40, tolerance = 0.001, epsilon= 0.1,
+ shrinking= TRUE, cross= 0, probability= FALSE, fitted= TRUE, subset, na.action = na.omit)
Call:
svm.default(x = x, y = NULL, scale = TRUE, type = NULL, kernel = "radial", degree = 3, gamma= if (is.vector(x)) 1 else 1/ncol(x), coefO = 0,
cost= 10, nu = 0.5, class.weights =NULL, cachesize = 40, tolerance= 0.001, epsilon = 0.1, shrinking = TRUE, cross = 0, probability = FALSE,
fitted = TRUE, subset, na.action = na.omit)
Parameters:
SVM-Type: one-classification SVM-Kernel: radial
gamma: 0.02 nu: 0.5