AN EXPLORATORY INVESTIGATION OF THE PROCESSES INVOLVED IN THE COMPLETION OF RAVEN7S
PROGRESSIVE MATRICES
A thesis presented to the
Department of Psychology and Sociology University of Canterbury
In partial fulfilment of the requirements for the Degree of Master of Arts
by
David Edward Carter ~
The author wishes sincerely to thank
Professor R.A.M. Gregson for his helpful supervision of the research and statistics involved in this
thesis.
The Director General of the New Zealand Department of Health is thanked for allowing access to patients. Gratitude is also expressed to the Medical Superintendent Dr. T.E. Hall; Consultant Psychiatrist Dr. R.S. Hemmings; the Chief Clinical Psychologist Mr. H.R. Unger; other medical staff and nursing staff of Sunnyside Hospital for their willing co-operation in this research.
Chapter I II III IV V References Appendix 1 2 3 4
TABLE OF CONTENTS
Introduction
Problem and Research Hypotheses Design and Procedure
A. Experimental Subjects B. Extraneous Variables C. Experimental Measures
D. Procedure
Results
INTRODUCTION
The Progressive Matrices test was designed to measure intellectual functioning within the context of Spearman's concept of "gil (Burke, 1958). It purports to be a quantitative measure of eduction: the test's
author, J.C. Raven, has described i t has a test of "innate educti ve ability" (Raven, 1940). Essentially, the test grew out of the reaction against the empirically composed heterogeneous tests as developed by Binet and his American followers (Westby, 1953).
The first intimation of the matrices test was given by Penrose and Raven (1936), and i t was further described by Raven (1939, 1940). The test Was finally standardized in 1941 (Raven, 1941). This standard series of the test has become known as "Progressive Matrices
(1938)".
visually presented "matrices" or patterns. Each matrix is a network of logical relations between simple and more complex visual forms. From each matrix, a part has been removed. The testee has to examine the matrix, and then choose from the multiple choice options (below each design) the design or design-part which best completes the matrix. The sixty matrices are grouped into five sets of twelve problems each. The aim of the test designer was to produce five sets of items progressively graded in
difficulty both between and within sets (Westby, 1953). Each set has a theme to be educed by the subject. Set A requires chiefly accuracy of discrimination - all that is required is for subjects to complete a pattern. The later sets are more difficult, involving: analogies between parts of figures; progressive alterations in patterns; systematic permutations;
into parts.
and the systematic resolution of figures
It is clear from Raven's writings that he considered Spearman's laws of eduction or neogenesis to be of fundamental importance (Spearman, 1927).
basis of these laws, Raven (1940) argues
"Perceptual tests . . . may appear useless artistic stunts or obscure mathematical problems, but upon investigation success in solving them is found to depend upon the ability for logical thought which is the essential factor in all intelligent conduct. Progressive Matrices is a series of such tests designed to measure the
accuracy of eduction."
In the Progressive Matrices manual (Raven, 1960) the test is described as follows:
"Progressive Matrices (1938) is a non-verbal test of a person's capacity at the time of the test to apprehend figures presented for his
perception, to see relations between them, and to conceive the nature of the figure
completing each system of relations presented."
In fact, however, what is actually measured by Progressive Matrices
(1938)
is not easily settled (Burke,1958).
Raven himself variously describes the test as being "a means of estima ting a person~· s innate educti ve ability"(1940),
as a "test of' a personis present capacity to form comparisons, reason by analogy, and to develop a logical method of thinking, regardless of previously acquired information"(1948),
as designed to measure"accuracy of eduction"
(1940),
and as a means of assessing a "person's output of intellectual activity"(1947).
Eventually, in fact, the test is offered as a test of general intelligence, which Raven defines as "the ability to reason by analogy from awareness of relations between experienced characters."
(1960).
As outlined above, the strategy of the Progressive Matrices test was to measure "g" via various forms of
"perceptual reasoning". Spearman
(1946)
consideredof "gil. This has been a general English opinion e.g. Vernon
(1947),
Vincent(1952).
Westby(1953)
states that factor analysis in the services suggests that the test is analmost pure "g" test, with a small loading of some spatial perceptual factor. However, Burke
(1958)
after viewing many relevant investigations, states that the evidence is not convincing that Progressive Matrices(1938)
hasvalidity as a pure measure of the Spearman construct of
"g".
A lot of work has been done bearing on the
content validity, the construct validity and the reliability of the Progressive Matrices
(1938)
e.g. Barrett(1956),
Burke et ale
(1969),
Desai(1952),
Desai(1955),
Eysenck(1944),
M. Eysenck (19~5), McLeod and Rubin(1962),
Shaw(1967),
Sinha(1951)
and others. Comparatively, although Raven's Progressive Matrices(1938)
has been an extremely widely used test, very few studies have attempted to gain knowledge of the internal dynamics of the test.the reasoning errors on Raven's Progressive Matrices (1938).
Raven's Progressive Matrices (1938) was designed to measure the ability to form comparisons and reason by analogy, thereby providing an index of intellectual
functioning. (Raven, 1960). It has been suggested (Fracchia, 1969) that a relationship exists between type or degree of mental illness and disturbances in abstract processes, such as concept formation, comparative reasoning, and analogic reasoning. The Progressive Matrices (1938) was not
primarily designed to assess the ideational effects of mental disturbance upon complex reasoning ability, but i t has been utilized in that capacity_
Kasper (1958), using Raven1s suggested method of deviations from expected set scores as an index(1),
reported a failure to show the efficiency of the test in
discriminating the influence of neurotic or characterological pathology.
( 1)
Raven (1954) suggested that two points or more deviation between expected and actual scores in any of the five sets of twelve items each possessed "psychological
Jurjevich (1967) investigated what he called "avoidable errors" on Progressive Matrices (1938). No significant relationship was found between the incidence of avoidable errors and the degree of neurotic or
character disturbance as measured by the M.M.P.I.
Sheppard, Fiorentino, Collins, and Merlis (1968, 1969) used a different approach in an attempt to identify performance errors on Progressive Matrices (1938). They criticize Jurjevich in that M.M.P.I. scales were used
singly as measures of disturbance, and because the scoring system utilized defined all errors as avoidable, regardless of the patientsg
ability to solve the items.
Sheppard et ale (1968) tested the item structure of Progressive Matrices, and found that the integrity of
the sets was maintained with regard to increasing difficulty. (Other studies have reported similar findings, Halstead,
1943; Rimoldi, 1947; Kier, 1949). On the basis of these findings, Sheppard et ale suggested that an error be
showing that he did have the reasoning ability to solve the easier item" (1968).
In an investigation by this group (Sheppard et ale 1968) i t was hypothesized that schizotypic patients would be less regular and make more avoidable errors than
sociopathic patients. Patients were so classified on the basis of M.M.P.I.
profiles~1)
The hypothe sis was supported, the performance of schizotypic patients being found to be more erratic - they made significantly more avoidable errors - than the sociopathic patients.In a recent study, the same authors (Sheppard et al.,1969) examined the performance of three additional groupings of patients. Again, patients were defined by M.M.P.I. patterns, and termed "secondary sociopathic", ''paranoid I f , and "s chizophrenic mixed". (2) Tests of
significant t demonstrated that paranoid patients committed more avoidable errors than the secnndary sociopathic and
(1)q9t ~illPI pattern
=
sociopathic;5
scales above T.70=
schizotypic(2)q2' ~IPI pattern
=
secondary sociopathic; q28 iMMPI pattern=
paranoid;mixed schizophrenic patients, but there was no reliable difference between the latter two groups.
Thus, the research findings appear somewhat contradictory with respect to Progressive Matrices (1938) efficacy in distinguishing pathological indeces.
Fracchia, Fiorentino, Sheppard and Merlis (1969) investigated the extent to which the defining and scoring of avoidable errors are significant factors in determining the tests ability to detect differences in the abstract reasoning performance of M.M.P.I. diagnosed pathological groups. Using eightyeight patients, divided into four M.M.P.I. profile pattern groups, (1) Fracchia et al. (1969)
found that the scoring method defining an avoidable reasoning error as " . . . failure to solve an item whose difficulty level was within the testeefs range of ability, as determined by his performance" was sensitive to differences in pathological type. However, the scoring method using
expected set scores (Raven, 1960) as the basic defining
(1)421 MMPI pattern
=
secondary sociopathic; 49' MMPI pattern=
primary sociopathic; 428'MMPI pattern = paranoid;concept for avoidable errors, when applied to the same groups, didn't show significant differences. The authors concluded that the manner of defining and that of scoring avoidable errors on Ravenus Progressive Matrices
(1938)
werE important factors in determining sensitivity toreasoning errors that are related to pathological ideation.
The present study grew out of a consideration of the fact that appropriately defined and objectively scored avoidable error indeces appear capable of assessing the impairment of intellectual functioning. In this research i t was hypothesized that Progressive Matrices
(1938)
is not merely comprised of a process of series induction, but that embedded in this is a process of similarity perception. If this is in fact so, the similarity perception featuresinvolved in the test may act to facilitate (or conversely, to render more difficult) the task of completing the arrays for some sUbjects. That is, the contaminating features involved in the test, may attenuate the differences in
above, i t may be more efficient to present a modified
version of the test itself i.e. eliminating the similarity perception features involved in the standard form.
In this manner, i t may be possible to obtain a clearer picture of the differences in abstract reasoning related to different pathological groups than is the case when
"avoidable error" measures are used. Thus, the present study is an exploratory attempt to determine whether or
CHAPTER II
PROBLEM AND RESEARCH HYPOTHESES
As has been outlined in detail above, Progressive Matrices
(1938)
comprises basically an incompletetwo-dimensional array, which may be completed by the
application of logical rules of some sort. The test has been described as a graded series of logically designed patterns (Wechsler,
1949).
It was Raven1s intention,inferable from some of the items in the test sequence, that each incomplete pattern in the series Was completed by a process of induction, and i t is the capacity of the subjects to perform this non-verbal induction which generates the measure of intelligence.
In fact, the process of completing the arrays may not simply be that of series induction; i t may be
comprised of a number of distinct sub-processes. Some possibilities are as follows
determined by inspection of the k
terms in their proper order, what must the (k + 1)th item be?" In some of the Raven arrays, the rule is probably better expressed along the following lines: "the possible combinations of attributes shown in the patterns
presented include all except one; hence the one missing must be so-and-so.!!
(2)Similarity Perception. The subject may carry out (1) above, up to a point, and then get an answer which is either (a) correct by chance, or (b) slightly but not grossly
wrong, because when choosing from the set of alternatives offered he does not effectively notice and distinguish between all the
details of the potential answers but chooses one which is similar, as he perceives i t , to what seems to be required.
alternatives offered have an equal choice of being chosen as the answer.
(4)
Non-random Irrational Strategies(e.g. perseverative responding) may also be employed by some sUbjects.
The attempt was made in this investigation to test the two major subprocesses separately, using tasks of the following types
-(1) Series Induction - tasks of two sorts were used: (a) Raven arrays, presented for completion, without the alternative solution pieces. Thus, in this task, subjects could not use similarity
perception cues to facilitate, or render more difficult, the task of completing
the array.
(b) Series induction questions as are used extensively in reasoning tests.
(2) Similarity Perception: these tasks
(a) the Raven arrays, and (b) the alternative solutions.
The general aim of this investigation was to determine i f expectations regarding the processes involved in the completion of Progressive Matrices
(1938)
could be substantiated empirically, and i f so to consider what the implications are for the standard test procedure.The specific aims were: to undertake an
exploratory factor analysis of the battery of tests as outlined abuve, to see i f there was any evidence of a
second factor; to determine i f the battery of tests would be effective in discriminating between two psychiatric patient groups, and two inormal' subject groups; and to discover where the differentiation (if found) occurred within the battery.
Hypotheses: (1) There is evidence that there is more than one factor involved in the five variables making up the test battery;
groups at a high level of significance;
CHAPTER III
DESIGN AND PROCEDURE
A. EXPERIMENTAL SUBJECTS
Four groups of twelve subjects each were used in this design: two schizophrenic groups; and two groups of normal subjects.
1. Schizophrenic Subjects
A number of studies have shown conclusively that i t is not meaningful to treat schizophrenia as though i t were a single dimension. However, much less agreement prevails concerning what the basic subcategories are, except that they do not coincide with those of psychiatric nosology. The lack of cohesive unity of schizophrenia, and the
Four dichotomous categories of importance have been proposed (Yates,
1966)
distinguishing (a) process from reactive schizophrenics, (b) good premorbid from bad premorbid schizophrenics, (c) acute from chronic schizo-phrenics, and Cd) paranoids from nonparanoid schizophrenics. The paranoid~nonparanoid dichotomy is of special interest. There has been doubt about including paranoids under theheading of schizophrenia for a very long time (Lang and Buss, Paranoid schizophrenics have beEn found to show less psychological deficit (e.g. Payne and Hewlitt,
1960)
andclinically have been considered to show less thought disorder and deterioration over time than have the other subgroups of schizophrenia.
all. paranoids.
These statements, however, do not apply to
In a most enlightening study, Johannsen et al.
(1963)
examined the correlations found between different measures used to describe schizophrenics. High correlations were found between placement on the process-reactive,acute-chronic, and good-bad premorbid scales. Only the paranoid-nonparanoid dimension appeared to be an
independent dimension: testing on a double alternation
non-paranoids, but not between the poles of the other dimensions.
That paranoid patients readily differentiated themselves from other subtypes regarding distractability was established by McGhie (1967). The majority of
researchers who have compared experimental measures of attentive behaviour in the different subtypes of
schizophrenia have agreed that patients falling into the two groups, hebephrenic and paranoid, tend to form two homogeneous groups, whose performance on tests is
strikingly different (McGhie et al., 1965; Silverman, 196qa; Silverman, 196qb)
For the purposes of the present study, and in line with most recent research, i t is accepted as most meaningful to subdivide schizophrenic patients into paranoid and nonparanoid categories.
time of testing. The patients were selected randomly from the total group of such patients available. The measure of exclusion was that patients must carry the primary diagnosis of Paranoid Schizophrenia, that there be no suggestion of brain damage, and that they had not received E.C.T. within the past year.
(b) Nonparanoid Schizophrenic Patients - this group consisted of six male and six female patients, selected randomly from the total group of such patients at Sunnyside Hospital. All patients selected carried the primary diagnosis of Schizophrenia of any subtype except Paranoid or Unspecified. Such patients who
showed any signs or symptoms of organic brain damage, or who had received E.C.T. within the past year, were not eligible for selection.
2. Normal Subjects
The normal subjects were subdivided into two groups, "bright" normals and "dull" normals, on the basis of their performance
groupings e.g. university students, teachers, nurses, police officers, factory workers, housewives, and others.
"Bright" Normals: This group consisted of six male and six female adults, none of whom had ever received any of the conventional psychiatric or
psychosomatic diagnoses. The criteria for inclusion in this group was a raw score of more than 50 on the WAIS Vocabulary subtest.
"Dull" Normals: Six male and six female adults comprised this group. The criteria for inclusion was a raW score of less than 50 on the intelligence
B. EXTRANEOUS VARIABLES
1. ~e: All groups were matched on this variable. The mean age of the paranoid schizophrenic subjects was
35.5 years (their ages ranged from 22-48 years). The mean age of the nonparanoid schizophrenic subjects was 31.9 years (their ages ranged from 19-45 years). The mean age of the "bright" normals was 33.3 years (age range from 20-48 years). The mean age of the "dull" normals was 35.4 years (with the age range being from 27-48 years). An analysis of variance for a 1 factor experiment, with unrelated measures, (Winer, 1962), indicates that these differences are not significant. (See Appendix 1).
2. Sex: All groups were balanced on the sex factor.
quick test of intelligence, this scale is considered one of the best available: Wechsler (1958) states that the Vocabulary subtest is "an excellent measure of general intelligence" and that i t "holds up better with age than any other test of the scale".
It is possible to convert a subjectis raw score on this subtest to an age-scaled score (Wechsier, 1955). In this manner, a subject's performance would be compared with the average for his age peers. However, in the five
experimental variables used in the present study, a
subject's ability was determined by his raw score - i.e. his score was not compared with that obtained by his age peers. Thus, a subjectts raw score on the WAIS Vocabulary subtest was used as the measure of intelligence.
The mean scores, the standard deviation, and the ranges obtained for each group are given in Appendix 1(a).
between either of these and the "dull" normal group. (See Appendix 1(c».
4.
Race: All subjects were native-born New Zealand Europeans.5 • Length of Hospitalization: It was not possible to equate the experimental groups on this variable, as i t is related to the diagnostic categories used. However, Foulds et ale (1962 a,b,c) demonstrated that for
schizophrenics in general, a decline in Progressive Matrices score was a function of age only; length of
stay in hospital, except insofar as i t was related to ageing was not associated with a decline in
intellectual performance.
c.
EXPERIMENTAL MEASURESThere were five subtests in the battery presented to the sUbjects. (For the items involved in each subtest, see Appendix 2).
(1) This task was a subtest of the total sixty items of Progressive Matrices (1938), with a bias toward the more difficult items. Two items were chosen from each of sets A and B, and four each from sets C, D, and E - i.e. sixteen items in all (1).
In this test, complete Progressive Matrices items were presented to the subjects in the standard fashion
(Raven, 1960). The task was to choose the missing insert from the alternatives offered below each matrix.
(2) In this test, the arrays were presented without the alternatives below, the subject-s task being
to describe what the solution item would need to look like. Again, SlX " t " t een 1 ems were use d(1) .
(1) Thirtytwo items)in all were assigned systematically to measures (1) and (2), in such a way that avoided having each item in one measure more difficult than the
(3)
This measure, and the one following, were tests of similarity perception. For the third measure in the battery, subjects were asked to rank thealternative solution pieces taken from the Raven items. The complete set of alternative solutions was presented to the subjects, who were required to rank these in terms of their perceived similarity to the Ifcorrectlf solution item. The items used in this task were selected from both Tasks 1 and 2 - eight altogether.
(4)
Subjects were here required to rank the individual pieces from the array itself, in terms of their perceived similarity to the solution item. The items used in this task (ten) were selected from the first two measures, but no item was used in both measures3
and4.
D. PROCEDURE
It was explained to the subjects that the tasks they would be asked to do constituted a research investigation. Patients were informed that their
performance would not in any way influence their treatment in the hospital, that the Medical Officers concerned would not have access to any test material, and that anything said would be regarded as strictly confidential.
All subjects were tested individually, in a
private office. For some patients the testing took rather a long time (1f+ hours) but i t was attempted to create and maintain motivation as far as possible: a careful watch was kept for fatigue, and there was always a break of a few moments between each subtest of the battery.
The subtests were presented in the order in which they were outlined above. The problems become progressively more difficult in each of subtests 1 and 2. It Was
they did not do so, they would be unlikely to do so in Task 2. However, in case this occurred, subjects were always asked, at the end of Task 2, whether they would
like to change any answers to former items, or go over them again.
All tests were untimed, as the Progressive Matrices test is usually administered as an untimed,
"capacity" test. Also, other studies (e.g. Schnell and Dwarshuis, 1967) have found a negligible correlation between Progressive Matrices scores and the time taken to complete i t .
Instructions For the first task (i.e. the standard
Raven presentation) the standard instructions were given, viz.
"Look at this (pointing to the upper figure). It is a pattern with a bit taken out. Each of these bits below (pointing) is the right shape to f i t
the space but they do not all complete the pattern." (Explained why numbers 1,2,3 are wrong and why
4
is nearly right. ) Then, "Point to the piece which isquite right." (Explanation continued until the nature of the problem was clearly grasped.) Then,
lIyou go on. If you pay attention to the way the easy ones go, you will find the
later ones less difficult. Just point to the piece which completes the pattern. Now carryon at your own pace. See how many you can get right. You can have as much time as you like. There is no need to hurry. Be careful. Remember each time only one bit is quite right. 1I
For the second task (i.e. 'Raven-minus-alternatives") the -instructions were
"Now here is a pattern with a piece missing, but this time I want you to explain to me what the piece would need to look like to
complete the pattern. You just t e l l me what would have to go in the blank space to
complete the pattern." (This explanation was continued until the nature of the
problem Was clearly grasped.) Then, "Just explain what the piece would need to look like. There is no need to hurry. Be careful."
For both the similarity perception tasks, the items were cut into their constituent pieces, and each piece mounted on a card. The correct alternative (for Task
3),
or the solution item (for Task4),
was"I want you now to rank all these pieces (pointing) in terms of their similarity to this piece. That is, I want you to put all of these in order, in terms of their likeness to this one. Put the one that is ~ similar, or most like i t , next to this one, then the next most similar one, down to the one that is least like i t . "
Task 5, the series induction measure, was administered in printed fashion, with the answers to be filled in on the question sheet. The instructions were printed at the top of the test and read as follows:
"For each question in this test there is a line at the right hand side of the page. Wherever you see a line, there are letters, words, or numbers missing. Your task is to write the correct letters, words, or numbers on these lines, in order to answer the questions. For example:
A B C D E F G
In this example the ltters on the left are in alphabetical order, and so the next two letters are iFg and iGt.
1 3 5 7
..2.
11Here the rule is to add 2 to each number to get the next.
Now try this one yourself: 3 ) ABC DEF GHI
one answer is required. If there are two lines, then two answers must be given in order to get a mark.
Work as quickly as you can. Any questions ?"
Techniques of Measurement All responses to all items on all measures were marked either correct or incorrect.
For Task 1, standard marking as per the Raven manual was followed.
For Task 2, the "Raven-minus-alternatives" task, a l i s t was compiled of the constituent aspects of each solution item. All of these aspects had to be mentioned for an answer to be marked correct. In fact, instead of answering in this fashion, a number of
subjects would point to pieces in the array, and state that the solution would be "those two superimposed.
"
It was possible to score these responses as well.by converting each piece into its axiomatic form. Thus, a logical ordering of these pieces could be obtained
(Appendix 2 (b».
For the final task, of series induction, the answers from the reasoning tests used were
. d(1) requlre .
Statistical Treatment of Data Both a factor analysis and a discriminant function analysis were carried out by use of the IBM
360/44
computer at the University of Canterbury.Factor analysis was performed by means of the IBM Scientific Sub-routines Standard Factor Analysis Program.
Statistical analysis of the results was
also carried out by the discriminant function analysis
(1)It has been noted that some of the Shouksmith answers could be disputed - R.A.M. Gregson, personal
IBM S.S.R. program at the University of Canterbury ( 1)
Computer .
The term discriminant function used in this program is more correctly the set of coefficients of a linear discriminant score as defined by Rao (1952)(2).
The discriminant analysis method enables differences in an a priori classification of groups to be examined In terms of the highest relative a posteriori probability of an individual being assigned to one of the a priori groupings on the basis of test scores which are common to all the individuals. In the present case, the a priori classification was in clearly defined
categories paranoid schizophrenics; nonparanoid schizophrenics; "bright" normals; and "dull" normals.
Diagramatically, the method may be illustrated
(1)This program has been modified by Professor R.A.M.Gregson of the Dept. of Psychology and Sociology, University of Canterbury.
by an example, using just two groups of scores: x axis
1 . x aXls
i
=
A,BThe ellipses around A and Bare equiprobability contours representing diverging individual subject scores about the mean values x ..
1 Not all contours are shown, but i t would be expected that the complete set of contours of A and B would intersect. The line dAB represents a
Any line can be drawn at right angles decision axis.
to this, such that all scores to one side will be called B, all to the other side called A. This line may be drawn at any point, according to the critical value placed on i t . By selecting the decision axis, and a line at right angles to i t , which leads to the fewest errors of
To distinguish between the subjects of two groups using the maximum amount of information i t is necessary to find a decision axis dAB which represents a line along which the distance between the two means of the groups is greatest, relative to the variation within the groups. For each group, a separate linear decision function is constructed. The degree of overlap between the clusters of scores is thereby calculated and is
expressed in the form of a Generalized Mahalanobis D-Square, and the significance of this can be tested. It is distributed as a function of chi-square, giving a measure of the extent to which the groups separate out in terms of the variables used in the analysis. Having determined what linear function is most influential in partitioning the variance within and between groups, i t is then possible to determine the probability by which a subject's scores apportion him to each of the groups. The revision of the original program mentioned above gives the probabilities associated with all the groups, and not just the largest probability_
1) Means of variables in each group, - i.e. the centroid of each group;
2) The pooled dispersion matrix, consisting of variance and covariance scores;
3)
The common means;4)
The Generalized Mahalanobis D-Square, with i t s associated chi-square, and degrees of freedom;5)
The discriminant function coefficients forvariables in each group;
6)
The classification functions for each subject.The means of the variables, in each group, the Mahalanobis D-Square, and the classification Iunctions
CHAPTER IV
RESULTS
Hypothesis 1
The research hypothesis: there is evidence
of more than one factor being involved in the test battery. Although i t was realized that the conditions of the study were such as to make the application of factor analysis not strictly appropriate (i.e. the method of subject allocation, and the use of a limited number of variables) an exploratory factor analysis was carr~ed out. The obtained correlation matrix, the eigenvalues, the
cumulative percentage of eigenvalues, and tmunrotated factor matrix are outlined in Appendix 3.
With only five variables, i t is not possible to define more than two factors. Both the eigenvalues obtained, and an inspection of the correlation pattern suggest that there is a very large common factor in the five research variables. However, variables
3
and4
with small but respectable loadings, giving some
indication of a second factor. Varimax rotation of the five factors gave no additional information, as the use of unities in the diagonal cells necessarily gave rise to specific factors, which were highlighted in the rotated matrix.
Thus, there is evidence, of a very tentative nature, of a rather small second factor being involved in the research battery (1).
Hypothesis 2
Research hypothesis: the test battery will discriminate between the research groups at a significant level.
All five variables studied in this research were used in the discriminant function analysis.
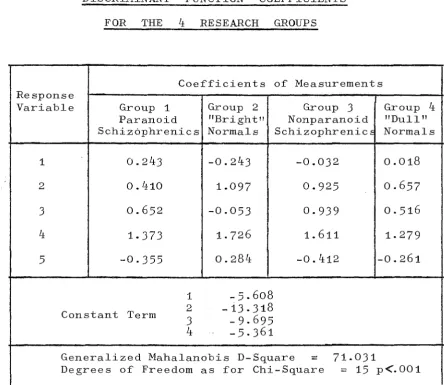
Table 1 shows that the battery of tests given to the subjects differentiates between the four groups
(1) Generous acknowledgement is due to Professor C.J.
at a significant level. Thus, there is a high degree of separation obtained between the mean values of the four groups; that is, the "generalized distance of Mahalanobis"between the groups is significant.
[image:43.598.98.543.306.691.2]TABLE 1
DISCRIMINANT FUNCTION COEFFICIENTS FOR THE 4 RESEARCH GROUPS
Coefficients of Measurements Response
Variable Group 1 Group 2 Group 3 Group 4 Paranoid "Bright" Nonparanoid "Dull" Schizophrenics Normals Schizophrenic~ Normals
1 0.243 -0.243 -0.032 0.018
2 0.410 1.097 0.925 0.657
3 0.652 -0.053 0.939 0.516
4 1. 373 1. 726 1. 611 1. 279
5 -0.355 0.284 -0.412 -0.261
1 - 5.608 Constant Term 2 -13.318 3 -9.695 4 -5.361
Generalized Mahalanobis D-Square == 71.031
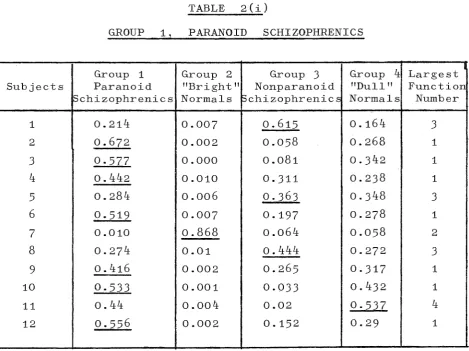
Tables 2 (i) - (iv) give the Bayesian a posteriori probabilities of each of the subjects belonging to each of the research groups, and the largest function number
associated with these probabilities.
The base rates are a priori set equal (i.e. effectively 0.25 ~ach) because they were not obtainable.
TABLE 2(i)
GROUP 1, PARANOID SCHIZOPHRENICS
Group 1 Group 2 Group 3 Group 4 Largest Subjects Paranoid "Bright" Nonparanoid "Dull" Function
iSchizophrenics Normals :,chizophrenicE Normals Number
1 0.214 0.007 0.615 0.164 3
2 0.672 0.002 0.058 0.268 1
3 0.577 0.000 0.081 0.342 1
4 0.442 0.010 0.311 0.238 1
5 0.284 0.006 0.363 0.348 3
6 0.519 0.007 0.197 0.278 1
7 0.010 0.868 0.064 0.058 2
8 0.274 0.01 0.444 0.272 3
9 0.416 0.002 0.265 0·317 1
10 0.533 0.001 0.033 0.432 1
11 0.44 0.004 0.02 0·537 4
[image:44.595.85.555.316.667.2]Referring to Table 2(i), i t may be seen that seven paranoid schizophrenics have a largest function number corresponding to the group to which they do in fact belong; that is, 7/12 subjects were correctly
identified as being paranoid schizophrenics. A further three were identified as being nonparanoid schizophrenics. Thus, most were broadly identified as being psychiatric patients. Two subjects were misclassified as "normals". One paranoid schizophrenic subject was classified as
belonging to the "bright" normal group, and had in fact a raw score on the WAIS Vocabulary subtest of 72, easily the highest in her group. The remaining subject was classified as "dull" normal, having a raw score of 14, the lowest in the group. Thus, in this group of
paranoid schizophrenics there was indeed a separation occurring, but the "dull" normals and the paranoid
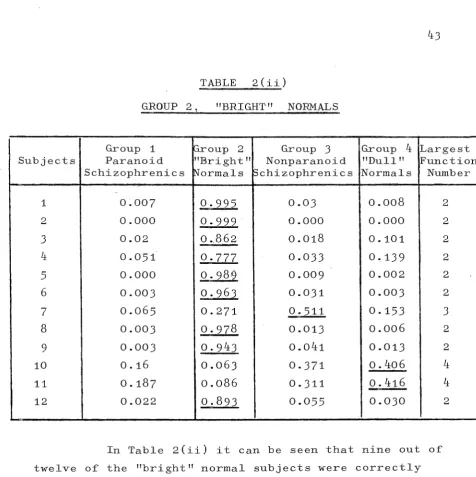
Group 1 ~roup 2 Group 3 Group 4 Largest Subjects Paranoid "Bright" Nonparanoid "Dull" Functioll
Schizophrenics )'.Jormals ~chizophrenics Normals Number
1 0.007 0.995 0.03 0.008
2 0.000 0.999 0.000 0.000
3 0.02 0 .. 862 0.018 0.101
4 0.051 0.777 0.033 0~139
5 0.000 0.98·9 0.009 0.002
6 0.003 0.963 0.031 0.003
7 0.065 0.271 0·511 0.153
8 0.003 0.978 0.013 0.006
9 0.003 0.943 0.041 0.013
10 0.16 0.063 0.371 0.406
11 0.187 0.086 0.311 0.416
12 0.022 0.893 0.055 0.030
In Table 2(ii) i t can be seen that nine out of twelve of the "bright" normal subjects were correctly identified. Two subjects were misclassified as "dull" normals. Broadly, then, eleven of twelve subjects were
2 2 2 2 2 2 3 2 2 4 4 2
correctly classified as being "normals". The two subjects misclassified as being "dull" normals obtained extremely
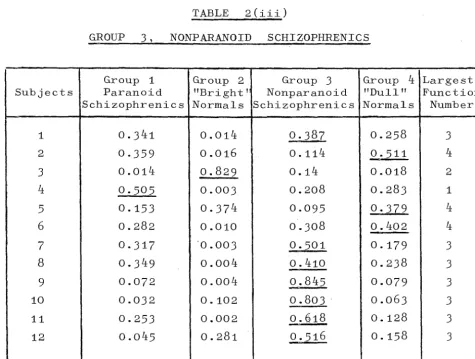
[image:46.595.75.552.86.564.2]TABLE 2(iii)
GROUP 3, NONPARANOID SCHIZOPHRENICS
Group 1 Group 2 Group 3 Group 4 Largest Subjects Paranoid "Bright' Nonparanoid "Dull" Functioy
Schizophrenics Normals Schizophrenics Normals Number
1 0.341 0.014 0.387 0.258 3
2 0·359 0.016 0.114 0·511 4
3 0.014 0.829 0.14 0.018 2
4 0·505 0.003 0.208 0.283 1
5 0.153 0.374 0.095 0.379 4
6 0.282 0.010 0.308 0.402 4
7 0·317 '0.003 0.501 0.179 3
8 0.349 0.004 0.410 0.238 3
9 0.072 0.004 0.845 0.079 3
10 0.032 0.102 0.803 0.063 3
11 0.253 0.002 0.618 0.128 3
12 0.045 0.281 0.516 0.158 3
[image:47.603.77.553.220.579.2]in this group, misidentified as "bright" normal, had a raw score on the WAIS Vocabulary scale of 53 - the second highest in this group. The three misidentified as "dull" normal had raw scores of 52, 30, and 32 - the last two being the lowest in the group.
TABLE 2(iv)
GROUP 4, "DULL" NOffi.'IALS
-Group 1 Group 2 Group 3 Group 4 Largest Subjects Paranoid "Bright" Nonparanoid "Dull" Functior
Schizophrenics Normals ISchizophrenics Normals Number
1 0.398 0.002 0.149 0.451 4
2 0.184 0.019 0.536 0.261 3
3 0.282 0.168 0.136 0.414 4
4 0.213 0.246 0.139 '0.402 4
5 0.439 0.035 0.155 0·370 1
6 0.343 0.027 0.176 0.454 4
7 0.620 0.001 0.06 0.318 1
8 0.456 0.001 0.204 0·338 1
9 0.289 0.004 0.241 0.426 4
10 0.240 0.008 0.321 0.431 4
11 0.305 0.033 0·310 0.352 4
Referring to Table 2(iv), in the "dull" normal group
eight subjects have a largest function number corresponding to the group to which they do belong. That is 2/3 were correctly indentified, while three subjects were
misidentified as being paranoid schizophrenics, and one as belonging to the nonparanoid schizophrenic group. None of this group were classified as being "bright" normals. Again, a separation of the "dull" normals
from the other groups has occurred, but a decided overlap with the paranoid schizophrenic subjects is apparent. Two of the three subjects misclassified as being paranoid
schizpphrenic received the lowest scores for their group on variables 1 and 2.
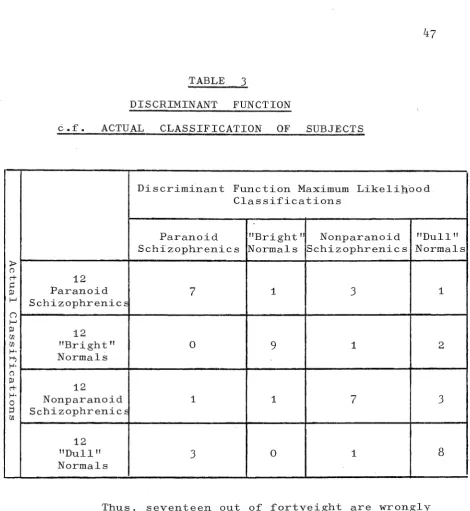
In Table 3, a simple diagram sets out the classification given by the discriminant function analysis, and the actual a priori groupings of the
c.f.
ACTUAL CLASSIFICATION OF SUBJECTSDiscriminant Function Maximum Likelih-ood Classifications
Paranoid ItBright It Nonparanoid "Dull" Schizophrenics Normals Schizophrenics Normals
~
(')
c+ 12
~
Paranoid 7 1 3 1
~
i-' SchizophrenicE
n
i-'
~
12 Ul
Ul "Bright It 0 9 1 2
1-'-Normals H) 1-'-(') ~ 12 c+
1-'-Nonparanoid 1 1 7 3
0
::J. SchizophrenicE Ul
12
"Dull" 3 0 1 8
Normals
[image:50.595.80.551.74.586.2]The results of the discriminant function analysis thus demonstrate that the battery of tests administered to the research subjects differentiated between the groups at a high level of significance.
As was noted above, however, although the
"dull" normal group and the paranoid schizophrenic group were differentiated from each other, there was a definite overlap occurring.
Throughout the discriminant analysis, a failure to correctly identify the group membership of various individuals has been found. It is important to note
that the research groups themselves are rather imprecisely and inadequately defined, and the discriminant analysis
(a very sensitive procedure) is picking this up.
A discriminant function analysis is capable of finding differences, i f this is at all possible. In this respect i t is a misleadingly sensitive form of
analysis when thinking in terms of practical clinical decisions; i t gives a best course of action even when this is a useless best course. Thus, although the
between the research groups at a high level of
significance, i t will be instructive to examine the individual variables within the battery to determine.on which variables the obtained differentiation occurs.
Hypothesis
3
The hypothesis: the research groups will
separate more clearly on the series induction tasks than on the tasks involving similarity perception.
The mean scores of the four research groups~ using first the variables tapping series induction, and then those of similarity perception are outlined below.
Firstly, the mean scores (expressed in terms of the per cent correct for each task) of the four research groups, using three variables are shown in Table
4.
The variables are the standard Raven items, the "Raven-minus-alternatives" test, and the test of series induction.Following this the two similarity perception variables are discussed in the same manner.
would be incorporated in any study on a larger sample. Following the analysis of mean scores, three of the five variables are discussed individually, i.e. raw scores for all subjects on these variables are examined.
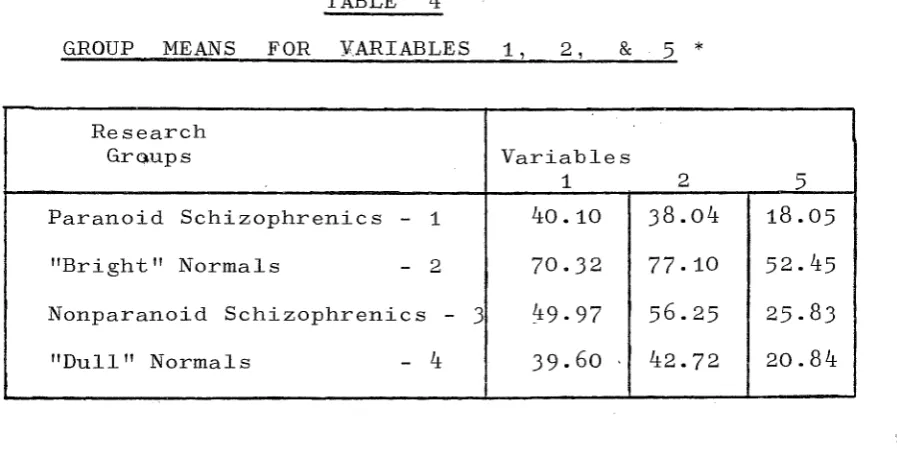
TABLE 4
GROUP MEANS FOR YARIABLES 1, 2, & 5
*
Research
GrQups Variables
1 2 5
Paranoid Schizophrenics
-
1 40.10 38.04 18.05 "Bright" Normals - 2 70.32 77.10 52.45 Nonparanoid Schizophrenics-
3 ~9.97 56.25 25.83 "Dull" Normals-
4 39.60 42.72 20.84Regarding variable 1, the most conspicuous
difference is obviously that between Group 2 and all other groups. Regarding groups 1, 3, and 4, the largest
difference is 10. This stands in contrast to the much larger difference between any of these scores and that of Group 2: the difference between the group of "bright" normals and the closest of the other groups (Group
3)
is [image:53.595.108.557.277.512.2]20. Also important, but not as conspicuous is the fact that the nonparanoid schizphrenics are separated from groups 1 and
4
by 10. It can be seen from both Table4
and Graph 1 that there is no diffeFence between theparanoid schizphrenics and the "dull"normals.
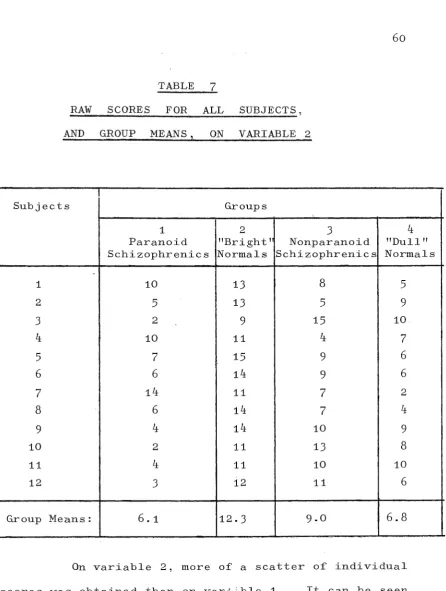
On variable 2, the "Raven-minus-alternatives" task, the same overall pattern is obtained, this time with slightly higher differences between the groups. (On Graph 1, this is shown by the groups showing the same pattern but being more spread out over this variable.) Again, the greatest difference is between Group 2 and the other groups; the difference between Group 2 and the closest of the other groups is 21. Tne nonparanoid schizJPhrenic ~ group is again separated from the "dull" normal group and
<:.>
from the paranoid schi~hrenic group, this time by 18 and 14 respectively. Thus, the groups are more differentiated from each other on this variable than they were on variable 1, although the difference between the paranoid schizophrenic group and the "dull" normals is, while greater here, s t i l l rather insignificant.
GRAPH 1
MEAN SCORES OF THE FOUR RESEARCH GROUPS
-!-l U (J) ~ ~ 0 u -!-l ~ (J) u ~ (J) P; 70
60
.
50.
-40
30
20 10ON VARIABLES 1, 2, AND
5
--,
,
,
,
,
"Bright" Normals"
"
'
, ,'
' Nonparanoid" ' , SChiZOPhreniCS
"
,.
"Dull" NormalsParanoid
Schizophrenics
O~ ________ ~ ______________ ~ ______________ ~ ____ _
The largest difference between groups 1, 3 and ~ is 7, while the difference between Group 2 and the closest of the other groups is
27.
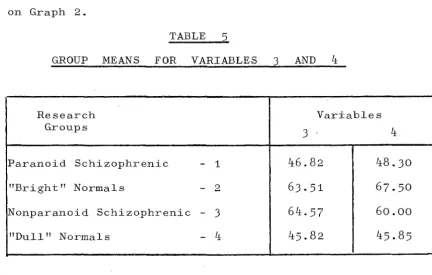
The mean scores of the four groups on the two similarity perception variables (variables
3
and ~) are outlined in Table5,
and can be seen diagrammatically on Graph 2.TABLE
5
GROUP MEANS FOR VARIABLES
3
AND ~Research Variables
Groups
3
~Paranoid Schizophrenic
-
1
~6.82 ~8.30"Bright" Normals
-
2
63.51
67.50
Nonparanoid Schizophrenic-
3
6~.5760.00
"Dull" Normals
-
~ ~5.82 ~5.85 [image:56.598.100.532.313.588.2]ON
80
0 .•
VARIABLES
3
ANDzc _ _
- -
-rt
"Bright" Normals Nonparanoid
Schizophrenics
- - - -
...
Paranoid
Schizophrenics
"Dull" Normals
schizophrenics and the "dull" normals are clustered together, as are the nonparanoid schizophrenics and the "bright" normals. However, there appears to be a marked difference between these two clusters; the difference is 17. The mean scores of the groups on variable 3, then, indicate a separation between the two
clusters, but do not indicate such a separation taking the groups individually.
On variable
4,
the second of the similarity perception tasks, the scores are spread out slightlymore than on variable
3.
The "dull" normals and paranoid schizpphrenics are separated by only 3, but the othergroups are separated by 7 and 12. Thus, the mean scores do indicate that there is slightly more separation of the groups on this variable than on variable 3.
Thus, an analysis of the mean scores indicates that i t was the variables involving series induction that most influenced the separation obtained by the discrimina~t
function analysis. Using group means, i t appears that i t was on variable 5 that the most differentiation of the
similarity cues had been removed. The overlap of paranoid schizophrenic patients and "dull" normals was again noted, and these groups were most separated on variable 2.
As outlined above, a better separation of the groups using mean scores appeared to occur on the series induction variables - 1, 2, and 5. These variable are discussed individually below. The tables show raw
scores for all subjects in the four groups and the group means, on these three variables. (Raw scores for all
subjects on all variables may be seen in Appendix ~).
The accompanying scatter diagrams show the range of scores obtained by the sUbjects. By examining the
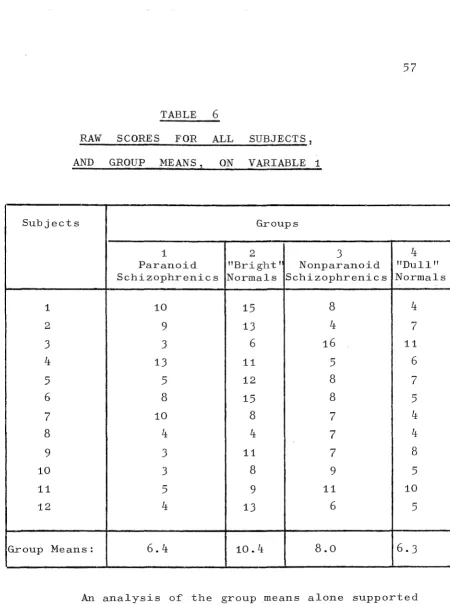
TABLE 6
RAW SCORES FOR ALL SUBJECTS, AND GROUP MEANS, ON VARIABLE 1
Subjects Groups
1 2 3 It
Paranoid "Bright I Nonparanoid "Dull" Schizophrenics Normals Schizophrenics Normals
1 10 15 8 It
2 9 13 It 7
3 3 6 16 11
It 13 11 5 6
5 5 12 8 7
6 8 15 8 5
7 10 8 7 It
8 It It 7 It
9 3 11 7 8
10 3 8 9 5
11 5 9 11 10
12 It 13 6 5
Group Means: 6.It 10.It 8.0 6.3
[image:60.597.102.553.56.663.2]the other groups, but as Figure 1 shows, the individual scores are so scattered that a meaningful analysis of trends is not possible with such small numbers. Group 2 ("Bright" Normals) show some trend toward the high
end of the scatter, but scores are widely dispersed along the length of the scale. Overall, i t would not appear that this variable contributed significantly to the
V1 C)! "0 r J ;5 - \
2
\.L ~ G <:J (/'1FIGURE 1
SCATTER DIAGRAM: RANGE OF SCORES FOR ALL SUBJECTS ON VARIABLE 1
16.
*
* *
14.
*
* *
12.
*
**
*
10.
**
*
*
*
8.
*
**
***
***
6.
*
*
* *
*
4.
**
*
*
***
2.
o
Paranoid "Bright" Nonparanoid Schizophrenics Normals Schizophrenics
TABLE
7
RAW SCORES FOR ALL SUBJECTS, AND GROUP MEANS, ON VARIABLE 2
Subjects Groups
1
2
3
4
Paranoid "Bright' Nonparanoid "Dull" Schizophrenics Normals Schizophrenics Normals
1
10
13
8
5
2
5
13
5
9
3
2
9
15
10
4
10
11
4
7
5
7
15
9
6
6
6
14
9
6
7
14
11
7
2
8
6
14
7
4
9
4
14
10
9
10
2
11
13
8
11
4
11
10
10
12
3
12
11
6
Group Means:
6.1
12.3
9.0
6.8
[image:63.595.109.556.79.671.2]til qJ
'0
J
jr
l-Le
0 (j (j7FIGURE 2
SCATTER DIAGRAM: RANGE OF SCORES FOR ALL SUBJECTS ON VARIABLE 2
16.
*
*
14.
*
* * *
* *
*
12
*
* * * *
*
10.
* *
* *
* *
*
* *
* *
8
*
*
*
* *
*
6
* *
* * *
*
*
*
4
* *
*
*
*
2
* *
*
o
RAW SCORES FOR ALL SUBJECTS, AND GROUP MEANS, ON VARIABLE
5
Subjects Groups
1
2
3
4:
Paranoid "Bright! Nonparanoid "Dull!! Schizophrenics Normals Schizophrenics Normals
1
720
4:
4:
2
4:
24:
6
8
3
4:
14:
19
10
4:
I8
14:
6
11
5
4:
19
11
7
6
6
21
7
6
7
15
13
4:
4:
8
4:
18
5
6
9
3
17
6
5
10
3
6
9
3
11
3
75
6
12
4:
16
11
5
[image:66.598.102.551.135.670.2]On variable 51 as an analysis of Figure
3
shows, most of the "bright" normals separate outreasonably clearly from the other three groups. Two of these subjects are, however, embedded in among the
other three groups. These "bright" normal subjects have in fact been classified as "dull" normals in the discriminant function analysis.
I t can be seen that Groups 1,
3
and4
show a mixed scatter of scores at the lower end of the scale, with two exceptions. One paranoid schizophrenicsubject's score is amongst those obtained by "bright" normals, and this subject was classified as being a "bright" normal in the discriminant function analysis. Again, the nonparanoid schizophrenics are all at the lower end of the scale, except for subject
3
j of thisgroup. This subject was also classified in the discriminant analysis as being a "bright" normal.
,
~, V1 Q.J u cJ j ~ L.. U-~ l.3
V7ALL SUBJECTS ON VARIABLE 5
30
j
1-24.
*
22.
*
20.
*
*
*
18.
*
*
16.
*
*
14.
* *
*
12.* *
10.*
8.
*
*
*
*
6.
*
*
***
* *
4.* * * * *
* *
* * *
2.Paranoid "Bright" Nonparanoid Schizophrenics Normals Schizophrenics
[image:68.595.83.477.96.737.2]Overall, then, the most consistent separation occurred on variable
5,
and this variable probablyaccounted for much of the separation between the groups. I t is also noted that there appears to be more
DISCUSSION AND CONCLUSION
The broad aim of this investigation was an attempt to gain a partial answer to the question: what are the processes involved in the task of completing Raven's Progressive Matrices
(1938)
? The specific aims were (a) to discover, by undertaking an exploratoryfactor analysis, whether there was any evidence of a second factor involved in the battery of tests; (b) to see i f the battery given to the research subjects significantly differentiated between them; and (c) to discover where
the differentiation, i f found, occurred within the battery. By these means, i t was hoped to discover whether tasks
involving similarity perception were involved in the process of completing the standard Progressive Matrices items.
outlined in Chapter IV, the research was not conducted in a way to make factor analysis strictly appropriate, and so this result must be viewed as being only suggestive.
However, i t does appear that the task involved in the similarity perception variables is somewhat different than that involved in the series induction tasks; other abilities do seem to be involved in the completion of the similarity perception variables.
In the discriminant function analysis, on the basis of the five measures employed in the research, the four research groups cannot be considered to have come from the same group centroids. That is, the groups are differentiated at a highly significant level. The
clearest differentiation occurs with the "bright" normal group. This was to be expected: the "bright II normal group was extreme on both intelligence and "sanityll. In the case of the paranoid schizophrenic patients, an oVBrlap occurred with the "dull" normals. What seems to have
contributed to this are the scores the subjects obtained on variables 1 and 2 (the "standard Raven items", and the
Thus, the discriminant analysis fails to identify correctly the group membership of various
individuals. The most plausible interpretation of this fact is that the groups are imprecisely and inadequately defined, and the discriminant analysis has picked this
up. (This is precisely what discriminant analysis is capable of, among other things.) Psychiatric
classification (for the patient groups) and performance on a quick, verbal measure of intelligence (for the normal groups) were used as the starting point for
selecting §ubjects, but these classifications are
themselves suspect. Using a verbal intelligence test as an index for the classification of normal subjects for tasks involving non-verbal performance would appear inappropriate, and iterative revision of the psychiatric classifications by means of repeated use of the
discriminant analysis seems to be needed.
that have most influenced the separation obtained by the discriminant function analysis. It seems variable
5
has had the most influence, with variable 2 having more influence than variable 1. When one views the individual raw scores, however, i t is noted that on all variables, wide individual subject differences occurred in eachgroup, mostly as a function of intelligence.
The fact that the research groups are more
clearly differentiated on the series induction varia~les
than on the similarity perception variables, does suggest that series induction is the better discriminator of the two. The finding that more differentiation occurs on variable 2 than on variable 1 tentatively suggests that
the standard Progressive Matrices items may be compounding series induction and similarity perception.ta~ks, and that i t is a better discriminator without the alternative
the variables are standardized, comparisons between variables are tentative in this sense.
However, i t does appear that Progressive Matrices
(1938)
has similarity perception featuresThe test appears to be attenuated by included in i t .
these features. That is, the similarity perception features in the test are obscuring the supposed nature of the task -series induction. It is suggested that Progressive
Matrices
(1938)
is confounded with, or weakened by, the superimposed similarity perception tasks. Thus, i tappears that using the test simply as an induction task (i.e.
uncomplicated by the similarrty judgements to be made among the offered alternatives) discriminates better than using the standard form of the test.
Implications for Further Research.
Findings from the research suggest that:
were imposed on the treatment of the data by the small sample size of this study. A larger sample would enable more meaningful conclusions to be reached.
2. Any investigation following the lines of the present study would need to use more sophisticated, quantified
ways of measuring similarity as perceived e.g. Gregson
(1969),
H8ijer(1969),
and Sj~berg(1966).
3.
It is suggested that iterative revision of thesubcategories of schizophrenia is neede~ and research on this could be carried out by repeated use of the
discriminant analysis.
REFERENCES
BARRATT 1 E.S. The relationship of Progressive Matrices (1938) and the Columbia Mental Maturity Scale to the W.I.S.C. J.Consult.Psychol., 1956, 20, 294-296
BURK~,H.R. Ravents Progressive Matrices: A review and critical evaluation. J.Consult.Psychol.,
1958, 93, 199-228
---, and BINGHAM, W.C. Raven's Progressive
Matrices: More on construct validity. J.of Psychol., 1969, 72, 247-251
DESAI, M.M. The test-retest reliabil~ty of the
Progressive Matrices Test. Brit.J.Med.Psychol. , 1952, 25, 48-53
The relationship of the Wechsler-Bellevue Verbal Scale and Progressive Matrices Test.
J.Consult.Psychol., 1955, 19, 60
EYSENCK, H.J. The effect of incentives on neurotics and the variability of neurotics as compared with normals. Brit.J.Med.Psychol., 1944, 20, 100-103
EYSENCK, Margaret D. An exploratory study of mental