Demand-driven or driven demand?
The role of demand-drivenness in Dutch PSD-instruments.
Master thesis Public Administration and Business Administration Date 15 January 2013
Author Mark Franken
Supervisors Hans de Groot (UT-PA) Ton Spil (UT-BA)
Contents
Contents ... 3
Acronyms ... 5
Preface ... 6
Summary ... 7
1 Introduction ... 10
1.1 Introduction ...10
1.2 Context ...10
1.3 Aims of the research ...11
1.4 Problem definition ...12
1.5 Limitations ...13
1.6 Outline ...13
2 Methods and approach ... 14
2.1 Literature review ...14
2.2 Dossier study, interviews and field visit ...15
3 Theoretical framework ... 17
3.1 Private Sector Development...17
3.1.1 The concept ...17
3.1.2 Logical framework ...17
3.1.3 Stakeholder analysis ...18
3.1.4 Dutch PSD-instruments ...19
3.2 Business Intelligence Systems ...20
3.3 Demand ...21
4 Demand-drivenness of Dutch PSD-instruments ... 24
4.1 Definitions ...24
4.1.1 Definitions in literature ...24
4.1.2 Associations ...25
4.1.3 Contrasts ...28
4.1.4 Conclusion ...28
4.2 Indicators ...29
4.2.1 Classification ...30
4.2.2 Conclusion ...31
4.3 Selection ...32
4.4 Scores ...34
4.4.2 FMO ...34
4.4.3 ORET ...35
4.4.4 ORIO...36
4.4.5 PSI ...36
4.4.6 PUM ...37
4.4.7 Conclusion ...38
5 Information on demand-drivenness by Dutch PSD-instruments . 40 5.1 Definitions ...40
5.1.1 Definitions ...40
5.1.2 Intended beneficiaries ...40
5.1.3 Strategy phase ...42
5.1.4 Request phase ...43
5.1.5 Approval phase ...43
5.1.6 Conclusion ...45
5.2 Indicator ...45
5.3 Availability ...47
6 Analysis: measuring the effect of demand-drivenness on impact 49 6.1 Main issues of impact studies ...49
6.2 Methods for impact studies ...51
6.3 Factors of PSD-impact ...51
6.4 Indicators for demand-drivenness ...52
7 Conclusion, discussion and recommendations ... 53
8 References ... 55
Appendix 1: Interview list ... 63
Appendix 2: Interview protocol ... 64
Appendix 3: Translation and weighting of indicators ... 66
Appendix 4: Exact or estimated scores on the indicators ... 70
Appendix 5: Transformation value in order to transform real scores to 1-3 scale ... 73
Appendix 6: Calculation of summarized score on demand-drivenness ... 74
Appendix 7: Indicators mentioned by interviewees to measure demand-drivenness ... 75
Acronyms
AIV Advisory Council on International Affairs BA Business Administration
BSC Balanced Scorecard BI Business Intelligence CAPEX Capital Expenditure
CBI Centre for the Promotion of Imports DDE Directorate Development Economics
DECD Donor Committee for Enterprise Development
FMO Nederlandse Financierings-Maatschappij voor Ontwikkelingslanden IB Intended beneficiary
ILO International Labour Organization
IOB Policy and Operations Evaluation Department (Inspectie Ontwikkelingssamenwerking en Beleidsevaluatie) IX Instrument X
MDG Millennium Development Goal MoU Memorandum of Understanding
NCW Dutch Christian Employers association (Nederlands Christelijk Werkgeversverbond)
OECD the Organization of Economic Cooperation and Development ORET Developmental Relevant Export Transactions
ORIO Developmental Relevant Infrastructure Development PA Public Administration
PPP Public-Private Partnership
PRSP Poverty Reduction Strategy Papers PSD Private Sector Development PSI Private Sector Investments
PSOM Program Cooperation Emerging Markets (Programma Samenwerking Opkomende Markten)
PUM Dutch Senior Expert (Programma Uitzending Managers) SER Social and Economic Council
SME Small and Medium Enterprises SRQ sub research question
TA Technical Assistance UT University of Twente
Preface
In order to graduate for the master programs business administration and public administration, I was looking for an organization that could offer me an internship during which I could perform a research on the cutting edge of business,
government and development cooperation. IOB turned out to be a suitable place for such a research project. The private sector development (PSD) policy review offered me a good context to perform this research about demand-drivennes. I am grateful to colleagues that made time for reflection on my concepts and draft reports, i.e. Antonie de Kemp, Dick van de Hoek, Henri Jorritsma, Ruerd Ruben and Willem Cornelissen. Also Jaap Voeten from the University of Tilburg, who gave reflection on my theoretical framework, can be mentioned in this row. I thank Lieke Pullen for editing of the text. I thank Denise Bergkamp for drawing the cartoon for the first page. Most of all, I am grateful to the support of my supervisors Max Timmerman and Jiska Gietema from IOB and Hans de Groot, Ton Spil and Annemarije Kooijman from the University of Twente (UT) for their support and supervision on this
research project.
As stated before, this research is performed at the cutting edge of business administration and public administration. The following will discuss in which part of this research specific elements of both fields can be recognized.
Public administration is about the governance of public issues. In this study the issue is the problem of poverty and the challenge that is formulated in the
millennium development goals to reduce poverty. Public administration starts from a macro perspective in which the global problem of poverty is seen as subject for national policy. The description of the logical framework of the PSD-policy of the Dutch Government is a typical example of an analysis of a macro perspective, simplified in a model in order to make a policy to handle this problem. The idea that the development of the private sector can and should be influenced by public interventions is also a public way of thinking.
Business administration takes a private business as starting point of analysis. The first link with this research is off course the private businesses that are subject of the PSD-policy in order to develop. But also the implementation of the instrument by the different executive organizations fits in the scope of business administration. These organizations are in many ways similar to regular businesses, e.g. the need for Business Intelligence (BI) systems that provide the management with
Summary
Demand is an ambiguous concept in a development context. Development
instruments claim to be demand-driven, but it is unclear what exactly is meant by such a statement, how it can be measured or how it effects the impact of an instrument.
Problem statement
This research is executed in the context of a policy review of IOB1 about the Dutch policy regarding private sector development (PSD) in developing countries. The Dutch PSD-policy consists of many instruments. The Dutch PSD-instruments2 are supposed to be demand-driven according to the policy documents. The ´terms of reference of the country studies´ mention some research question about demand-drivenness. In order to provide input for these questions this research develops methods to assess demand-drivenness and measures the extent to which PSD-instruments were demand-driven. The following main research question is discussed in this research: To what extent are the Dutch PSD-instruments demand-driven and to what extent do executive organizations have information about their own
demand-drivenness?
Methods
This question is answered by a combination of methods, consisting of a systematic literature review, interviews with representatives of the Dutch PSD-instruments, document- and data-analysis.
Literature
There is not one generally accepted definition of demand-drivenness in literature. Demand-drivenness is most often associated with participation, ownership and decentralization. Demand-driven is most often used as an opposite to supply-driven. Two recurring elements in the definitions of demand-driven are that the demand of the intended beneficiary is relevant and that the decisions in the different phases of an instrument are subject to influence by this demand. In the case of selected PSD-instruments, the relevant phases are: strategy, request and approval. The found definitions can be summarized in the following definition of demand-driven: The extent to which decisions in the different phases of a development-instrument are based on the preferences of the intended beneficiaries.
There is also not one generally accepted set of indicators in literature to measure the extent to which an instrument is demand-driven. However, 29 unique indictors for demand-driven were found in literature. The indicators can be classified
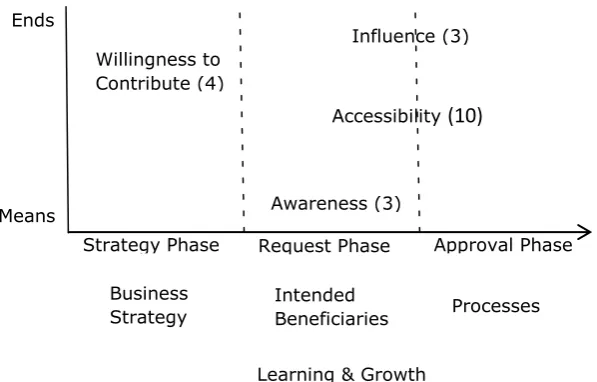
according to the three phases mentioned earlier and according to the following four assumptions about demand-drivenness that will be used as criteria:
1. an instrument is demand-driven when receivers are willing to contribute.
2. An instrument cannot be demand-driven when there is low awareness among the intended beneficiaries.
3. A demand-driven instrument is accessible for the intended beneficiaries. 4. Intended beneficiaries can influence a demand-driven instrument.
From this list of 29 indicators, 22 indicators are selected that are appropriate for the context of this research.
1 IOB: Policy and Operations Evaluation Department (Inspectie Ontwikkelingssamenwerking en Beleidsevaluatie) of
the Ministry of Foreign Affairs.
2 This research considers the Dutch PSD-instruments that are mentioned as ‘bedrijfsleveninstrumentarium’ by the
Scores of instruments
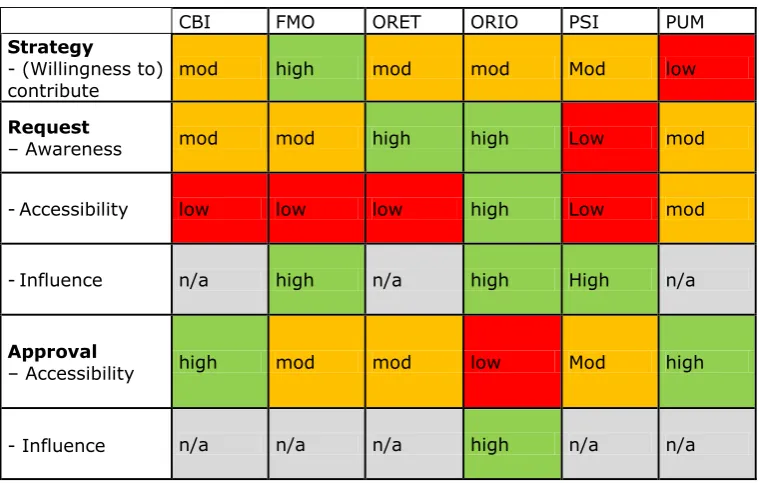
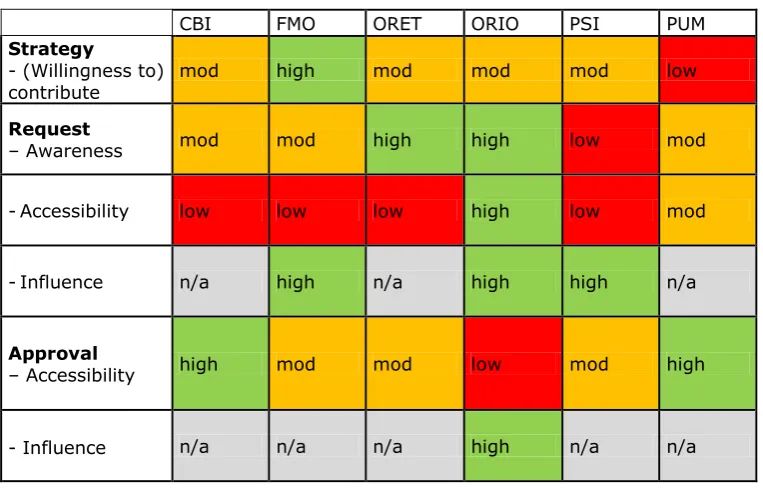
[image:8.595.165.545.370.612.2]The PSD-instruments are scored on the selected indicators. The scores are summarized in table x. The indicators show that the receivers of all instruments have demand for the instruments, because they are willing to contribute. In case of FMO this is clearer than in the case of PUM, the rest is in between. The strategic decisions are to a certain extent in line with the demand. The indicators show that the requests for ORIO are based on the demand of governments in developing countries. In the case of PUM, PSI and to a certain extent for CBI it is unlikely that the intended beneficiaries with the highest demand made the request, because many intended beneficiaries are not aware of the possibility to make requests. In the case of FMO and ORET this is more ambiguous. The indicators about the approval phase show the least disturbed process of demand-drivenness by the approval phase by PUM, followed by FMO. PSI, ORET and ORIO are indicated to have the most potential for disturbing the accessibility of the intended beneficiaries with the highest demand. In the case of ORIO it is possible that the ‘disturbance’ corrects some of the ‘disturbance’ of the request phase because it tries to select applications with sufficient demand. The scores are summarized in the table below.
Table x. Demand-drivenness of the Dutch PSD-instruments.
Information on demand-drivenness
When it comes to the definition of demand-drivenness that is given by the
instruments, it can be said that most instruments associate demand-drivenness with a fit or alignment of instruments with the wishes or priorities of the governments of developing countries or with the wishes of the intended beneficiaries. Most
instruments define the decisions in their strategy as a combination of demand-, need- and supply-driven3. The decision to request is in most cases made solely by the intended beneficiary and therefore seen as demand-driven. In case of FMO, supply also plays a role and in case of ORET it is only seen as supply-driven. The
3 Demand-driven: based on the endogenous demand/preferences of the intended beneficiaries.
Need-driven: based on exogenous needs or requirements.
Supply-driven: based on what can be supplied by the donor, e.g. by the available budget or the preferred sectors instead of what is needed or demanded.
CBI FMO ORET ORIO PSI PUM
Strategy
- (Willingness to)
contribute mod high mod mod Mod low
Request
– Awareness mod mod high high Low mod
- Accessibility low low low high Low mod
- Influence n/a high n/a high High n/a
Approval
– Accessibility high mod mod low Mod high
approval decision is mostly seen as need-driven. Only in case of ORIO demand plays a role also. In case of PSI, supply plays a minor role. ORET’s approval decision is completely supply-driven.
This classification that is made by the instruments can only be measured in a limited way by their own business-intelligence-systems. Demand-drivenness is not measured as such in the BI-systems of the Dutch PSD-instruments. The indicators the interviewees came up with that could be presented in reaction to a question of the minister to ‘prove’ the demand-drivenness of the Dutch PSD-instruments are limited. It is not surprising that most instruments score generally high on their own indicators, because they were only asked for indicators that prove their demand-drivenness. Also, it is likely that the scores are high because of a self-report bias.
Data on indicators that could be used to measure demand-drivenness, both found in literature and reported by the instruments, is only limited available. 29 percent of the indicators that were found in literature are being measured by the instruments. Impact
This research does not determine the effect of demand-drivenness on the impact of development instruments. However, it is possible to measure demand-drivenness with the indicators found in this research. Combined with regular impact studies and qualitative methods the link between impact and demand-drivenness can be
established. However, there are many other factors that influence the impact of PSD-instruments.
Conclusion
Based on this research it can be said that the strategy of all instruments is to a certain extent in line with the demand of the intended beneficiaries. It is unlikely, when businesses are the intended beneficiary, that they are the intended
beneficiaries with the highest demand for the intervention. It is likely that the approval phase reduces the influence of demand. However, essential data is missing to make a robust conclusion about the demand-drivenness.
The instruments do not measure demand-drivenness on purpose in their BI-systems. The availability of data that could be used to measure demand-drivenness is limited.
1
Introduction
1.1 Introduction
‘In a world with people that have lack of everything, there is also demand for everything.’ (WRR, 2010 p. 153) This is a quote of the scientific advisory council of the Dutch government in a report about development cooperation. It is exemplary for a complex issue in evaluation studies of development cooperation. Demand is an ambiguous concept in a development context. Development instruments claim to be demand-driven, but it is unclear what exactly is meant by such a statement, how it can be measured or how it effects the impact of an instrument. Different claims are made about the potential benefit of demand-driven instruments over supply-driven ones: it is supposed to improve the probability of broad-based adoption (Byerlee, 2000 p. 434) ownership, commitment, (Mengers, 2000 p. 375) sustainability, (Gupta, et al., 2008 p. 273; Schroeder, 2000 p. 424) efficiency, the chance of cost recovery (World Bank, 1993, in: Mukhija, 2010 p. 794), et cetera. Others challenge these claims by pointing to the limited empirical evidence. (Mukhija, 2010 p. 794; Mansuri, et al., 2004 p. 29) ()
This research discusses the concept demand-driven: the extent to which decisions in the different phases of a development-instrument are based on the preferences of the intended beneficiaries (see 4.1 for elaboration on the definition of demand-driven). First, the context of the research will be sketched, followed by the aims of the research, the problem definition and the limitations. This introductory chapter will end with an outline of the rest of this research.
1.2 Context
This research is executed in the context of a policy review4 about the Dutch policy regarding private sector development (PSD) in developing countries by the Policy and Operations Evaluation Department (IOB) of the Ministry of Foreign Affairs of the Netherlands5. Part of this policy review is executed by consultants that are hired by IOB, to whom will be referred as the consultants. In 2011, IOB programmed this policy review about the period 2005-2011 (IOB, 2011). Subject of the review are two operational goals of policy article four of the budget of the Ministry of Foreign Affairs. Article four concerns ‘more wealth and less poverty’ and is the core of the PSD-policy of the Netherlands. This context was helpful in order to get access to information and supervision. The following paragraphs will elaborate on the development of the Dutch PSD-policy.
The concept ‘private sector development’ was discussed elaborately for the first time in a policy context by the Dutch government in 2000. However, some
instruments that are considered part of the ‘business-instruments’ have existed for several decades, e.g. the Centre for the Promotion of Imports (CBI) as an
instrument for PSD was established in 1971 (CBI, 2012). Also, a couple of questions were already asked by Members of Parliament and a couple of statements were made by ministers about the necessity of PSD-policy before 2000 (Tweede Kamer, 1996). This eventually led to the report ‘Ondernemen tegen armoede’ – ‘Doing business against poverty’ - (Herfkens, et al., 2000), that has been the basis for the Dutch PSD-policy. A definition of PSD, the intervention logic and a stakeholder analysis can be found in chapter three, the theoretical framework.
PSD-policy has been part of the Dutch policy for development cooperation since 2000, although some comments were made and changes were implemented. Four trends in the changes of the PSD-policy will be mentioned. A first trend is the
4 A policy review is a form of periodic ex post evaluation research on general or operational goal level. The review is
about fundamental questions about necessity and effects of policy. (Minister of Finance, 2006)
5 The subject demand-drivenness is not only relevant in the development sector, but also in other departments of the
untying of the aid, i.e. aid without the compulsion to buy the goods in the donor-country. One example of this trend took place in 2002. The former secretary of state of foreign affairs, Van Ardenne-Van der Hoeven (2002), discarded the constraint on one of the PSD-instruments: PSOM6, which required 60% of the capital goods were originated in the Netherlands; this untied PSOM.
A second trend is formulated by the Advisory Council on International Affairs (AIV) (2006). They commented on the Dutch PSD-policy and concluded that a coherent policy is missing and that the focus should shift from direct investments in e.g. infrastructure to creation of an enabling environment by reducing risk and binding constraints. This shift is supposed to reduce direct government support to firms and thereby reducing market distortion.
A third trend is the increased use of public-private partnership (PPP). This form of cooperation between government, businesses and other partners is considered to be effective by the minister and secretary of state of Foreign Affairs (Rosenthal , et al., 2010 p. 10). In 2011, two letters by the secretary of state announce that PPPs will be a priority of the Dutch policy (Knapen, 2011 p. 8) (Knapen, 2011 pp. 6,7). It can be argued that PPPs lead to tied-aid (Tweede Kamer, 2012). The use of PPP
increases the role of individual firms in the execution of the Dutch policy in contrast to the previous trend.
A last trend that is most relevant for this research is the role of the intended beneficiaries. Several times it is mentioned by ministers or secretaries of state that the demand of the receiving ‘partners’ is leading (e.g. (Ardenne-van der Hoeven, 2002; Ardenne-van der Hoeven, et al., 2004; Koenders, et al., 2007; Koenders, et al., 2008; Knapen, 2011)). Also the already mentioned AIV-report (2006 p. 61) discusses the role of the receivers and states demand-drivenness as a quality criterion for PSD-instruments. The advice of the Social and Economic Council (SER) (2011 pp. 55, 88), ‘Development through sustainable enterprise’, confirms this pledge and advises to support demand-driven programs. The minister and secretary of state of foreign affairs (2010 p. 8) nuance this focus on the demand of the intended beneficiary by stating that a good Dutch supply will find its way to specific demand in receiving countries.
1.3 Aims of the research
The aim of this research is threefold. The first aim is to contribute to the policy review about PSD by IOB. In the terms of reference of the country studies that are part of the PSD policy review it is stated that the objective is to produce a
description of the demand-drivenness of the application of the Dutch PSD-programs (both policies and instruments), in order to ‘provide information from which lessons can be learnt by the Ministry of Foreign Affairs (MoFA) in the field of PSD-programs’. (IOB, 2012 p. 2). This research will contribute to the policy review by discussing demand-drivenness of the Dutch PSD-instruments.
The second aim is to formulate indicators that can be used to incorporate information about demand-drivenness in the BI-systems of development organizations that manage PSD-instruments. An example in the context of development aid of a call for objective, quantifiable indicators for information management systems to ‘improve its systems and products on an ongoing basis and become more responsive to its clients’ is formulated by Goldberg, et al. (2008 p. 27). An introduction on BI-systems can be found in the theoretical framework. The third aim is to contribute to conceptualization of the term demand-driven in IOB. Demand-driven is a recurring theme in IOB-evaluation (e.g. (IOB, 2011 pp.
6 PSOM: Programma Samenwerking Opkomende Markten, Program Cooperation Emerging Markets. Predecessor of
116, 117; IOB, 2012 pp. 5-12)), but a clear definition and operationalization is missing in the evaluation guide (IOB, 2009).
1.4 Problem definition
In order to reach the above mentioned goals, the next problem definition will be treated in the research.
The Dutch PSD-policy consists of many instruments. The instruments are supposed to be demand-driven (e.g. (Tweede Kamer, 2012 p. 13)). The terms of reference of the country studies state: ‘It is currently relatively unknown how this demand-driven approach and alignment work in practice.’ (IOB, 2012 p. 2). This document formulates the wish for methods to assess demand-drivenness and to establish the extent to which PSD-instruments were demand-driven. In order to meet this demand, the following main research question is discussed in this research:
To what extent are the Dutch PSD-instruments demand-driven, to what extent do executive organizations have information about their own demand-drivenness and to what extent does demand-drivenness influence impact?
To answer the main research question, three sets of sub research questions are formulated. The first set tries to find out to what extent the instruments are actually driven by the demand of the intended beneficiaries. It firstly approaches demand-driven from a theoretical perspective to find definitions (1) and indicators (2) that are used in recent literature to define and measure demand-drivenness in a development context. After a selection (3) is made of the available indicators that are appropriate for the PSD-instrument setting, the scores (4) on these indicators can be measured to determine the demand-drivenness of the Dutch
PSD-instruments.
The second set of questions tries to find out to what extent the organizations that implement the instruments know to what extent their instruments are demand-driven. These questions approach demand-driven from the perspective of the organizations that implement the Dutch PSD-instruments. Both the used definitions (5) and indicators (6) by the executive organizations will be identified and compared with the classification of definitions and indicators found in the first set of questions. Following it will be assessed to what extent data is available in the BI-systems of the executive organizations on the indicators that they use to determine
demand-drivenness (7).
The last sub research question is about the influence of demand-drivenness on the impact of PSD-instruments.
The sub research questions (SRQ) are as follows:
1. Which definitions of demand-drivenness in a development context are used in recent literature and how can these be classified?
2. Which indicators of demand-drivenness in a development context are mentioned in recent literature and how can these be classified?
3. Which indicators (found in the previous question) are appropriate to incorporate in the business intelligence systems of PSD-instruments in order to provide information about the demand-drivenness of these instruments?
4. How do the Dutch PSD-instruments score on the set of indicators of demand-drivenness formulated in SRQ3?
6. Which indicators of demand-drivenness are incorporated in the business intelligence systems of the Dutch PSD-instruments and how do they fit in the classification of SRQ2?
7. To what extent is data available in the business intelligence system of the Dutch PSD-instruments about the scores on the set of indicators of demand-drivenness?
8. To what extent can the influence of demand-drivenness on the impact of PSD-instruments be determined?
1.5 Limitations
The research is limited in various ways: instrumental, methodological and thematic. Most limitations are given by the context of this research i.e. the PSD-policy review.
The first limitation is instrumental. Only the Dutch PSD-instruments that are mentioned by the Secretary of State as part of the Dutch
‘OS-bedrijfsleveninstrumentarium’ (development cooperation – business instruments) (Knapen, 2012) will be considered i.e. PSI, FMO-ODA, CBI, PUM and ORIO. Also the predecessors of ORIO, i.e. ORET will be considered. The recently started programs, i.e. IDH and the PPP-facilities will not be considered. The majority of the money that is invested in PSD by the Dutch government is channeled through these
instruments. Programs of multilateral organizations like the International Labour Organization (ILO) or programs of Dutch NGO’s that are co-financed by the Dutch ministry of Foreign Affairs are not considered in this research.
The second limitation is in the methods. It is beyond the scope of this research to perform field work among the intended beneficiaries of the instruments. Therefore, the data gathering will partly be executed by consultants without direct supervision of the author of this research. Although their selection is based on an extensive tender procedure, the quality cannot be monitored directly.
The third limitation is in the themes that can be addressed. This research only deals with the extent to which PSD-instruments are demand-driven. It does not deal with the consequences of the extent of demand-drivenness for the impact of an instrument. It is impossible to assess this, because of the marginal evidence on impact of the instruments that is available. Also, primary research about impact is not feasible within the limited time that is available for this thesis. However, there will be one chapter that discusses the possibilities for impact studies of demand-drivenness in the future. Other sectors or policy fields than PSD will not be addressed, because of limited time.
1.6 Outline
2
Methods and approach
This chapter discusses the methods and describes the approach that is used to answer the research questions. The methods that are applied in this study can be roughly divided into two groups. The first and the second question are answered through a systematic literature review. The remaining questions are answered through the use of dossier study and interviews by the author and input from the country visits made by the consultants that are hired by IOB.
This chapter starts with the method of literature review, followed by the remaining methods.
2.1 Literature review
One of the aims of literature review is ‘to survey the current state of knowledge in the area of inquiry’ (Bhattacherjee, 2012 p. 23). This will be used to find possible definitions of drivenness and available methods to determine demand-drivenness.
According to the Campbell Collaboration Guidelines (2012) ‘it is important to have clear inclusion/exclusion criteria, an explicit search strategy, systematic coding and analysis of included studies and meta-analysis (where possible)’. The selection criteria for this study are: relevance for the research topic and quality, which is in case of academic literature a record in Web of Science. An article is considered relevant when it is about demand-driven in any sector of development cooperation or about private sector development in a non-development context.
The used search strategy is as follows. The database Web of Science is used for academic literature and the databases of the World Bank, IMF, OECD-DAC and ELDIS are used for professional literature. The search term that is used is: demand-driven. This leads to 798 academic articles. By excluding irrelevant categories7, 123 articles are left. Based on the titles and summaries, 89 irrelevant studies are excluded. After reading the articles seven irrelevant articles are excluded, which leads to a selection of 27 academic articles. The databases for professional literature delivered nine (World Bank), one (IMF), eleven (OECD-DAC) and 58 (ELDIS)
articles. Based on the titles and summaries, respectively one, one, six and six irrelevant studies are excluded. Also one article has been found twice in different databases and one article has been found three times. 32 articles from the ELDIS database are excluded because of non-availability. After reading the articles, two more articles are excluded. The total selection of articles from professional literature is 30 (six World Bank, four OECD-DAC and 20 ELDIS).
The articles that were included in this research are analyzed and the findings are reported in chapter four. In the case of the definitions, besides the reporting of the actual definitions that are used in the literature, the articles are analyzed on the associations and the contrast with demand-driven which are mentioned. This gives additional insight in the nature of demand-driven. These associations and contrasts are summarized in a word cloud, i.e. a visual representation of the relative
frequency of a list of key words by a grouping of words with different font sizes (Dictionary.com, 2012). Frequency of association does not prove a logical connection, but it does indicate to which other concepts the meaning of demand-driven is related according to authors. The indicators are classified according to the classification that is constructed in 4.2.1. The indicators are also generalized by translating context specific phrases into phrases that are also useable in the PSD context. For example: EAS, which is the name of an instrument, is translated into instrument X (IX). Intended beneficiary is shortened to IB and specific names of themes, regions and sectors are translated to these more general terms. Theme is
7 The included categories are: economics, planning development, management, business, urban studies, information
referring to the kind of intervention, e.g. in the theme education or finance. Sectors are about parts of the economy e.g. water, infrastructure or textile.
2.2 Dossier study, interviews and field visit
The selection of appropriate indicators is made based on a set of inclusion and exclusion criteria. The inclusion criterion is: used in the selected academic or professional literature to measure demand-drivenness. The exclusion criteria are formulated in consultation with the consultants during their inception phase8. Their experience with evaluation research in developing countries gave meaningful input for the formulation of exclusion criteria. The selected exclusion criteria are: 1. not measurable in most other contexts than the original research context, 2. the indicator is about a specific characteristic of an instrument that is unlikely to be found in other contexts, 3. the intended beneficiary is not seen as the relevant stakeholder to exercise demand. The exclusion criteria are explained and applied in chapter 4.3.
The scores of the Dutch PSD-instruments on the selected indicators are gathered by analyzing the evaluations and other documents that are available at IOB about the PSD-instruments, combined with the documents that are given by the instruments. Also, six interviews are performed with nine persons that are working for the organizations that execute Dutch PSD-instruments. One additional interview is performed with a policy officer of DDE that was involved with the transition from ORET to ORIO. The names of the interviewees can be found in appendix 1: interview list. The interviews were semi-structured (Boeije, 2005 p. 57). The interview
protocol that is also used to get input for other sub research questions can be found in appendix 2: interview protocol. The interview protocol is based on the research questions and the findings of the literature review. When no data is available for an indicator the interviewees were asked to make an estimate or to come up with an alternative, similar indicator. In most cases a direct score is found in the
documentation or given by the interviewee. A few score were calculated, based on the available data. In the case of variation scores a simple variance or standard deviation is not sufficient, because the differences in the amount of entries would make it incomparable. By calculating the difference in terms of percentage between the mean and the standard deviation this problem is treated. The data that is used is mostly from 2011. When available, extra years were added to the analysis in order to increase robustness of the data.
In order to give insight in the scores of the instruments compared to each other, the scores are transformed to a scale. A one to three scale is chosen, because many scores are estimates and therefore not very accurate. A ‘1’ means that the indicator points to relative less demand-drivenness and ‘3’ to more influence of demand on the decisions that are taken in that phase. The limits of the scales are based on the scores of the instruments, in such a way that the scores are distributed among the whole scales. This improves the comparability and above that, there is no
benchmark available to justify limits. When the scores for all instruments are the same, a ‘3’ is given if the scores are at the obvious upper side of the scale, e.g. when the absolute score is ‘high’ or ‘100%’; a neutral 2 is scored when the score is not at an obvious extreme of the scale. All indicators are measured for the whole instrument. These scores can be found in table 5. The scaled scores are summarized per criterion (i.e. willingness to contribute, awareness, accessibility and influence).
8 Part of the policy review is executed by the IOB internally; part of it is tendered and executed by consultants.
Instead of weighting all indicators with a neutral ‘one’, there is chosen for an alternative weighting in order to increase the weight of indicators about which consensus seems to exist. The weighting of the indicators is based on the citation score or impact factor of the journal in case of academic journals, which can be seen as an indication of the quality of the articles that are placed in the journal and the consensus that exist about the content. It is assumed that the relevance of the indicators correlate with the quality of the journal. In the case of articles from professional literature the score is based on an overlapping article; one article from the professional literature was also published in the academic journal The World Bank Research Observer with a citation score of 1.409. This score is used for all articles from professional literature. When more than one article refers to the same indicator, the scores are summed up. The summation is justified by the assumption that it is more likely that a indicator is of good quality when it is mentioned more often, although this can be biased for example by greater research interest for implementation issues compared to strategic issues. The weights are round up to whole numbers. The calculation of the weights can be found in appendix 3. The summarization is done by multiplying the scaled scores with the corresponding weight; after summation of the results of all indicators of one assumption, e.g. indicator 7-9 for the assumption ‘awareness’, the total is divided by the total weight. This gives a standardized score between 1 and 3. The calculation can be found in appendix 6. These standardized scores per assumption are transformed to table 6 in which the score of an instrument on a specific assumption is marked as low and red when the standardized score is the lowest of all the scores and is marked high and green when the standardized score is the highest of all instruments. Moderate and orange is used for scores in between.
The question about the definitions that are used by the Dutch PSD-instruments is answered by the semi-structured interviews. First the interviewees were asked about their definition of demand-drivenness. Following they were asked to react on the definition that is based on the found literature. They were also asked to classify different decisions of their instrument with the classification that is found during the literature study.
The question about the indicators that are used by the instruments is answered by asking questions about this theme during the same interviews. They were also asked how they score on their own indicators.
3
Theoretical framework
In this theoretical framework concepts will be discussed that are related to the research topic. First, the concept private sector development, the intervention logic that is behind it, an analysis of the stakeholders and a description of the Dutch PSD-instruments will be discussed. The second part is about BI-systems. In the third part, the term demand will be discussed. The term demand-driven is not defined in the theoretical framework in order to align with the grounded theory principle: ‘to avoid starting with a preconceived model but, rather, to produce a model growing out of data collection and analysis’ (Pozzebon, et al., 2011)
3.1 Private Sector Development
In this section, the concept private sector development, the intervention logic that is behind it, an analysis of the stakeholders and a description of the Dutch
PSD-instruments will be discussed.
3.1.1 The concept
As stated in the introduction, the Dutch government published its first policy document on PSD in 2000. Already in 1995 the Organization of Economic Cooperation and Development (OECD) published a document on PSD in their development co-operation guidelines series. They stated a definition and scope of PSD that starts with a definition of the private sector that is subject of development:
“Private sector” is conceived by the donor community as a basic organizing principle for economic activity where private ownership is an important factor, where markets and competition drive production and where private initiative and risk-taking set activities in motion. The private sector principle can be applied in all economic activities – agriculture, industry and services (including the delivery of public services). Donor motivations for supporting private sector development are based on promoting economic efficiency and social welfare. Donors agree that private sector development is fundamentally about people: releasing and harnessing their productive potential and satisfying their human needs and desires; and creating
pluralistic societies which provide both human freedom and human security. (OECD,
1995 p. 7)
3.1.2 Logical framework
The definition mentioned above partly clarifies the intervention logic or logical framework9 of PSD. In the document ‘doing business against poverty’ (Herfkens, 2001) the policy theory and intervention logic of PSD is also explained. This time by the minister of Development Cooperation and the secretary of state of Economic Affairs. The ultimate goal of the PSD-policy is to reduce poverty, which not only refers to material deficit, but also to lack of opportunity, empowerment and
security; this can be linked to the Millennium Development Goals (MDG), especially the first goal to eradicate extreme hunger and poverty. (UNDP, 2012) This reduction can be reached by inclusive economic growth, which means that economic growth should come with active participation of the poor so they can contribute to and share in the benefits. This means that economic growth has to be combined with sustainable employment, social service in health and education, reforms in land and resources access, promotion of social organization, decent wages and attention for the most vulnerable groups. According to this logic, it is the task of the private sector to provide employment, income and taxes for the public sector. The public
9 Logical framework: Management tool used to improve the design of interventions, most often at the project level. It
sector should, beside the delivery of public goods, focus on creating an enabling environment for private sector development. (Herfkens, et al., 2000) (Herfkens, 2001)
The first step in an intervention logic scheme is the input provided for the intervention. This consists of the PSD-policy and the (financial) means to execute this policy. In this report, PSD-policy refers to the intervention logic and policy that is formulated by the Dutch government for private sector development. A PSD-program is that what is actually implemented on country level. This consists of several PSD-instruments, like PUM, ORIO en PSI10. The input is needed to perform the process, which is the actual intervention in the form of projects e.g. training or a grant. This process leads to outputs like for example number of people who followed a training. The ratio between the input and the output is the efficiency. (IOB, 2009 pp. 17,18) The output is supposed to lead to the outcome, which is in this case an enabled private sector. The relation between the output and the outcome is called the effectiveness. As stated in the introduction, this relation has been subject of discussion, e.g. the question on which level the outcome is relevant: the trend is to strive for more macro enabling instead of direct firm support (e.g. (OECD, 2007; Advisory Council On International Affairs, 2006)). The last building block of the intervention logic is the impact or relevance. In this case, that is economic growth and eventually reduced poverty. The relation between the outcome of an enabled private sector and the impact on the economic growth and poverty reduction is often assumed, although the report ‘business against poverty’ state that economic growth does not necessarily leads to poverty reduction. The growth needs to be pro-poor or least benefit the poor in some way. The described intervention logic can be found in figure 1.
3.1.3 Stakeholder analysis
Many stakeholders are involved in the process from input to impact. The most important stakeholders will be mentioned. The donor provides the money and the PSD-policy, although the donor often claims that the policy is based on the needs or demands of those who are supposed to benefit. In this research, the donor is the Dutch government, more specifically the Ministry of Foreign Affairs. The stakeholder group that is supposed to benefit from the PSD-policy is in this case ultimately the poor people i.e. people that live below the poverty line that is referred to in MDG 1. They will be referred to as the poor. The group of stakeholders that are (directly) targeted by a specific instrument will be referred to as the intendedbeneficiary. The PSD-policy exists of a set of instruments that are implemented by another group of stakeholders, the so-called executive organizations e.g. Agentschap NL or FMO. The executive organizations implement several interventions or projects. The
stakeholder group that is approved to receive aid will be referred to as beneficiary. When the project is actually implemented the firm or person that is involved will be referred to as receiver.
10 Note that the intervention logic of specific instruments can differ from the general logical framework of the
PSD-policy. See the last part of this section for elaboration on the instruments.
Impact Economic growth & reduced poverty Outcome
Enabled private sector Process
Intervention 1 …
Intervention n Input
PSD-Policy Money
Output
Followed training 1 Given grant 2 …
3.1.4 Dutch PSD-instruments
The Dutch PSD-policy consists of a set of instruments. The following will describe these instruments.11 The first organization is CBI. CBI is the ‘Centre for the Promotion of Imports from developing countries - an Agency of the Netherlands Ministry of Foreign Affairs. CBI is established in 1971 in order to support producers / exporters to get a foothold in the Netherlands market, support to Business Support Organizations in improving their capabilities and to act as a Matchmaker between suppliers and buyers.’ The mission of CBI is to ‘contribute to sustainable economic development in developing countries through the expansion of exports from these countries.’ CBI works with five main services: export coaching programs, business support organization development programmes, training programmes on exporting to the EU, market intelligence information and a company database of companies coached by CBI. CBI uses a programmatic approach to integrate the different services. (CBI, 2012)
The second instrument is the ‘Nederlandse Financierings-Maatschappij voor Ontwikkelingslanden’ (FMO) i.e. the Dutch development bank. It finances companies, projects and financial institutions from developing and emerging markets. The core belief is that entrepreneurship is key in creating sustainable economic growth and improving people’s quality of life. FMO is specialized in the sectors: financial institutions, energy & housing and agribusiness, food & water. (FMO, 2012) The products and services of FMO can broadly be divided in two categories: financial products and services, and capacity development. (FMO, 2012) FMO manages several funds for the Dutch government in order to support higher risk projects with possible high development impact. These funds cover financial risks that FMO is not able to cover alone - allowing these higher risk projects to develop. (FMO, 2012) According to the letter of the Minister of Development Cooperation, Ben Knapen, concerned with an explanation of the PSD-instruments (Knapen, 2012) the Infrastructure Development Fund (IDF), Access to Energy Fund (AEF) and MASSIF are part of the Dutch PSD-policy. The predecessor of IDF is the LDC infrastructure fund. Besides managing the government funds, FMO is active with their own FMO-A fund. This fund is not directly funded or controlled by the Dutch government, but the state has a majority share in FMO which makes the state indirectly involved.
The aim of the third instrument, the program Development Relevant Export Transactions (ORET), is described by the Minister of Development Cooperation Van Ardenne-Van der Hoeven in 2006 as follows: ‘The aim of ORET is to enforce
sustainable economic growth and the business climate in developing countries. This happens by facilitating investments in economic and social infrastructure. The program reduces the costs of a project by donations for the purchase of capital goods, services or works. ORET is a subsidy program of the Ministry of Foreign Affairs.’ The program was launched in 1979. (Beerenschot, SEOR & Ecolas, 2006) Since 2002, it was executed and managed by the NIO. In 2007, the mandate was changed to PricewaterhouseCoopers Advisory N.V. and Ecorys Nederland B.V. (Ardenne-van der Hoeven, 2006). They are still managing the commitments of ORET that were started before the transformation of the program and that are not finished yet.
In 2009, ORET was changed to ORIO (Development Relevant Infrastructure Development) in order to increase the (development) relevance, demand-drivenness, sustainability and accessibility for SMEs both in the Netherlands and developing countries. The number of countries and sectors was decreased and the involvement during the whole process from preparation to operation and
maintenance was increased. (DDE, 2008) The ORIO program is commissioned to
11 The description is based on an overview that is published as preliminary study PSD Vietnam on the website of the
Agency-NL. ORIO contributes 100 percent to the preparation costs and 35-50 percent to the implementation and maintenance costs of a project.
The fifth instrument, the Program for Cooperation with Emerging Markets (PSOM) started in 1998 and was converted in 2008 to the Private Sector Investment
program (PSI). The aim of this program is to contribute to poverty reduction by stimulating sustainable investments in innovative business in developing countries. This is done by encouraging Dutch and foreign entrepreneurs to start investment projects in a joint venture company with a local entrepreneur. The program provides subsidies of 50-60% of the project costs of investments with high risks, which would otherwise not be carried out. PSOM/PSI is carried out by the EVD, which is
nowadays part of Agency-NL.
The sixth instrument is PUM. ‘PUM Netherlands senior experts is a non-profit organization, which has been advising needy businesses in developing countries and emerging markets for over thirty years. To this end, PUM links these businesses, at their own request, to Dutch professionals who voluntarily devote their considerable experience to creating a better world. PUM therefore promotes entrepreneurship, self-sufficiency and the sustainable development of small and medium-sized enterprise locally.’ (PUM, 2012) This quote represents PUM in a nutshell. 3.2 Business Intelligence Systems
A program that is supposed to be demand-driven, must incorporate information about the demand-drivenness of the instrument in the monitoring systems or BI-systems. The concept BI-systems will be explored in this section.
Business intelligence is most often used in the context of regular business administration. Various definitions are used. It is for example seen as ‘applied analytics’ (Dresner, 2006), or technologies and processes to collect and analyze data for better decision making (Davenport, 2006). Molensky et al. (2010) define
business intelligence as follows: ‘Business intelligence consists of monitoring and analysis technologies that will enable business users to turn data into information and information into knowledge, in order to optimize decision making and manage business performance with the goal to improve profitability and competitiveness of the business.’
In the context of development instruments, the concept of business intelligence is less popular, although many aspects can be applied to development instruments with the exception of the goal of profitability and competitiveness, which is often not relevant. Petrini & Pozzebon (2008) define the relevant core of business intelligence in the context of development instruments as follows: ‘the core of BI is the
gathering, analysis and distribution of information, and the goal is to support the strategic decision-making process.’ Based on the definitions above, the following definition of business intelligence is constructed: the monitoring and analysis technologies that enable organizations to gather, analyze and distribute information in order to support the decision making process.
There are several kinds of technologies, BI-systems or BI-tools that can be used. Spil et al (2002, based on: Alter, 1977) distinguish data oriented tools, decision oriented tools and model oriented tools. The tools range from simple file drawer systems, via spreadsheets and data warehouses, to extensive and tailored
management information systems. A new trend in business intelligence is to include indicators or data from outside the organization, e.g. retail prices of competitors or opinions of customers. This trend is driven by so-called web 2.0 technologies. (Trujillo, et al., 2011) () ()
difficulties are not technical but methodological and conceptual in nature.’ Therefore, this research will focus on the conceptual development of a set of indicators that can be used for a data oriented tool like file drawer system or a spreadsheet system. Two conceptual models will be discussed that can be used to classify indicators of demand-drivenness. The first model is constructed by Quinn & Rohrbaugh (1983) to classify criteria of effectiveness. Although there are considerable differences
between effectiveness and demand-drivenness, the model is useful as the constructs have key characteristics in common. Both constructs are related to basically
everything that is going on in an organization. Besides that, both constructs lack a simple, one-dimensional indicator to measure the construct. Three value dimensions are mentioned by Quinn & Rohrbaugh. One of the three mentioned value dimensions is related to organizational means and ends that can vary between an emphasis on processes and outcomes. This dimension will be used to classify indicators for demand-drivenness. It can be argued that indicators that measure ends are stronger than indicators that measure means that should lead to these ends, because they measure more direct the demand-drivenness.
The second conceptual model is an adapted version of the balanced scorecard (BSC). The original BSC has four dimensions on which indicators should be
formulated: financial, customer, internal business process and learning and growth (Kaplan, et al., 1992). The BSC is often adapted to make it fit for other contexts. The BSC can be made ‘sustainable’ by adding social and environmental indicators to the dimensions or by adding a fifth ‘sustainability’ dimension with these indicators. (Figge, et al., 2002) The sustainable BSC of Petrini & Pozzebon (2009) distinguishes four dimensions: business strategy, stakeholders, processes, and training and education. Other authors propose to transform the BSC to a public balanced
scorecard (Groot, et al., 2012), in which the weight of the dimension of customer or community resident is higher (Zhonghua, et al., 2012 p. 794). Others say the BSC should be transformed into a scorecard suitable for social enterprises. In there, ‘social return’ is added as an extra category (Meadows, et al., 2010 p. 136). The logic of the sustainable balanced scorecard is successfully applied to different sectors (e.g. construction by Zhao, et al. (2012) and salmon industry by Velásques, et al. (2011)). The logic of the public balanced scorecard is also successfully applied, for example to the urban waste sector (Guimarães, et al., 2010) and the health sector (El-Jardali, et al., 2011). These applications obviously lead to different sets of indicators caused by the different set of relevant stakeholders. This is in line with the conclusion of Oliveira et al. (2012 p. 5496) that ‘simply following the ‘‘best practice’’ approaches or the well-known cases of other companies may bring little benefit.’ Given the context of development instruments, the dimension ‘finance’ of the original BSC will be replaced by ‘business strategy’, because strategic goals are often broader than only financial goals which are idiosyncratic for commercial organizations, but are less relevant for development instruments. However, the financial goals should always be part of the strategic goals, because no strategy can be reached in the long run without healthy financial goals. Also, the dimension ‘customer’ will be renamed because this concept is ambiguous in the context of development aid. The term ‘intended beneficiary’ will be used instead, which makes clear that it is about the group that should profit from the instrument. The
dimensions ‘internal business process’ and ‘learning and growth’ will be kept the same, since both of them are relevant in this context.
3.3 Demand
classic perspective is the starting point of this section. Later, demand will be discussed in the setting of this research, i.e. development cooperation.
According to the neoclassical economist Alfred Marshall (1890), the final cause of demand is needs, wants or desires. He states: ‘[h]uman wants and desires are countless in number and very various in kind: but they are generally limited and capable of being satisfied.’ Besides this first aspect, Krohwinkel et al. (2008 pp. 198,199) point to the distinction between on the one hand ‘normative need’ or requirements, which is determined by experts’ evaluation and is basically exogenous and on the other hand ‘felt need’ or wants which is based on self-perception and is basically endogenous. For both kinds of needs there is a difference between desires and the possibility to satisfy them. To avoid confusion, normative needs will not be referred to as demand. However it can be argued that expert can make accurate ex ante predictions of the future ‘felt need’, maybe even more accurate than those who are the future demanders. See the discussion at the end of this report for some elaboration on this theme.
Demand in the economic sense measures the strength of the desire and becomes efficient when the price a person is willing to offer for a good reaches the level that others are willing to sell at. This obviously assumes an endogenous definition of needs. Demand can be used at the individual level, but is often used to express general demand of an entire market, which is the sum of all individual demands. For a supplier it is important to consider demand for the product he is willing to sell. If he tries to sell a product for which not enough demand exists, the supplier will eventually go bankrupt. Although most suppliers also create demand by ordering materials, the ultimate regulator of all demand is the demand of the final customer. Without his demand, the demand of the supplier would also not exist. The regulatory or driving power of demand leads in theory to optimal need fulfillment. (Marshall, 1890) Marshall (1890) refers to definitions of demand like: ‘amount he [customer] is willing to buy’ or ‘intensity of his eagerness to buy a certain amount’. He states that demand can only be expressed when these definitions are linked to the price at which the person would buy that amount. However, price is not necessarily
expressed by money; it can be seen as the trading point between different goods of different owners. His definition of demand can be summarized as the amount customers are willing to buy at a certain price or reversed.
Klerkx et al. (2006 p. 198) distinguish from the meaning of demand in economic sense in which purchasing power is crucial, by pointing to a second, more
substantive meaning. This meaning focuses on the interests of people in certain products or services and in the content of them, so not only the monetary value. This definition also focuses on needs as an endogenous concept. However this kind of demand can be expressed by preferences or priorities, which is basically about making a trade-off between different options by the demanding actor. The
distinction between price and preferences as means to express demand is especially relevant when market distortions influence the expression of demand by the price. This is very likely in a development cooperation context, since the reason for
development cooperation is basically originated in dissatisfaction with the (assumed) balance that is or will be created by the forces of economic demand and supply. Development cooperation distorts the economic system in order to help the poor that lack purchasing power to express their demand.
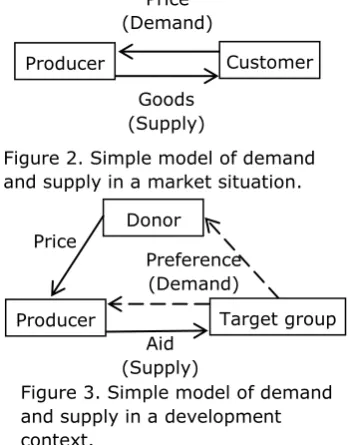
In a development context, no clear market with demand and supply exists. A normal market situation is reflected in figure 2. The price and the goods are that what is physically traded and what expresses demand and supply. Four parts of the normal market situation are similar in the setting of development aid. There is still a ‘producer’ that trades money for a product or service.12 In this case, the producer is the organization that implements a PSD-instrument. Second, the ‘customer’ is still
present in the form of the receiver of the aid, the so called ‘target group’ (OECD, 2010 p. 36) or intended beneficiary. Also the supply is similar. In a market situation the supply is expressed by the goods that are delivered. In a development context it is expressed by the aid (e.g. grants or technical assistance) that is delivered to the target group. Even the price is clear; the donor pays the price to the producer.
The problem is that it is unclear how demand fits in the model. Strictly
economically reasoned, the donor who pays the prices expresses his demand. It can be argued that the donor hereby fulfills his ‘moral’ need to do well or the need to gain legitimacy. When demand is considered in a more substantive sense and seen as preferences, the simple market model fails to give insight whose demand matters and how it affects the supply. The preferences that express the demand of the target group can probably influence the donor or the producer. Figure 3 gives an example of how the model of demand and supply can look like in a development context.13
The next chapter will explore how both the academic and the professional literature defines the role of demand of different actors in different aspects of the supply or aid that is given. Given the claim that a driving role of the demand increases effectiveness (see introduction), it is relevant to further explore these relationships.
13 In practice there are often intermediaries between the donor and the producer. There are also interventions in
which the donor gives the money to the target group. Customer
Producer
Goods (Supply)
[image:23.595.142.318.376.599.2]Price (Demand)
Figure 2. Simple model of demand and supply in a market situation.
Donor
Target group Producer
Aid (Supply) Price
Preference (Demand)
4
Demand-drivenness of Dutch PSD-instruments
4.1 Definitions
In order to assess the role of demand-drivenness in a development context it is important to clearly define this concept. In the theoretical framework the concept demand is already explored. For a suitable definition it is important to know whose demand matters and what exactly the demand is driving. This paragraph will answer the following question: which definitions of demand-driven in a development context are used in recent literature? The following sections discuss the found definitions, associations and contrasts of demand-drivenness in both academic and professional literature. It concludes with the definition that will be used in the rest of this report.
4.1.1 Definitions in literature
Demand-driven is often mentioned in the literature, but it is often poorly, or not at all, defined. The following is about the definitions that are found in academic literature. An overview of the definitions can be found in table 1.
Demand-drivenness can be defined as a particular feature of the design of an instrument, namely ‘that communities, civil-society organisations and other stakeholders are invited to exercise direct control over key project decisions.’ (Schou, 2009 p. 156)
Three other definitions are found to be in use in different settings. The first one is used in the setting of privatized agriculture extension services. In that setting: ‘‘‘demand-driven’’ refers to finding a good fit between the knowledge and information desired by farmers and the services delivered by extension service providers.’ (Klerkx, et al., 2006 p. 198) The second is found in the setting of social funds in Malawi. ‘This [demand-driven] means that the funds are to be allocated to groups that qualify for the funding (perhaps based on the level of poverty) and
where adequate project proposals have been formulated.’ (Schroeder, 2000 p. 430) The third one is found in an article about the same fund which defines demand-driven as follows: ‘any community group (i.e. a village) in Malawi can be invited to state its primary needs’ (Schou, et al., 2010 p. 547)
It is clear that the definitions differ in whose demand matters. They mention communities, civil-society organizations and other stakeholders, farmers and groups. There is also a difference in what is to be influenced i.e. key project decisions, delivered services or fund allocations.
The following is about a few definitions that are given in the selected professional literature. Most are applied on specific situations.
The first definition is given in the context of a policy document about an approach to strengthen sector competitiveness in Kazakhstan. ‘Demand-driven’ is defined as follows by the OECD: ‘leveraging feedback from OECD foreign investors and the local private sector on their priorities.’ (OECD, 2011 p. 30)
A second definition is given in a strategy about ICT in development of the Swiss Agency for Development and Cooperation. According to them demand-drivenness means that: ‘developing countries and those that are in transition should determine if and how ICTs are a priority for their social and economic development’. (SDC, 2005 p. 17)
A fourth definition is given in a beneficiary assessment about a social fund in Malawi, where ‘demand-driven’ is defined as an ‘approach whereby communities identify, select and manage their own projects’ (Ng'ong'ola, et al., 2001 p. 19) A fifth definition is found in a paper about the politics behind pensions in Lesotho, Namibia and South Africa. According to the authors, a policy can be defined as demand-driven when they do not serve political ends, but when ‘they serve welfare objectives of reducing poverty and promoting equality’. (Pelham, 2007 pp. i,7) A last definition in a study of the Norwegian Agency for Development Cooperation states that ‘demand-driven’ ‘means that calls are issued for applications’ (Tostensen, et al., 2010 p. 37). In the context of the referred study about support to
legislatures, the applications are mainly made by civil society organizations in order to receive a part of the available grant.
These definitions also differ in whose demand matters. They mention foreign investors and the local private sector, the beneficiary countries, the SMEs,
communities and civil-society organizations. There is also a difference in what is to be influenced, i.e. policies, strategies, programs, projects and the approval of grants. In short, there is not one general applicable definition of demand-drivenness available.
Table 1. Definitions of demand-driven in literature. Stakeholders whose demand matters are made bold. What is to be influenced is underlined.
4.1.2 Associations
Although authors are often reluctant to define demand-drivenness, they often associate demand-drivenness with other characteristics of an instrument or even use it as synonyms. This section will start with the associations that are found in academic literature and continue with the findings from professional literature. A word cloud of all the associations can be found in figure 4.
The most common association in academic literature is the association of
demand-drivenness with participation, e.g. (Sanginga, et al., 2006 p. 504; Prokopy, et al., 2008 p. 295; Byerlee, 2000), or more specific community participation e.g. (Murray, et al., 2010 p. 94; Schroeder, 2000 p. 423; Madrigal, et al., 2011 p. 1663). Participation exists in many types or degrees of intensity (Mansuri, et al., 2004 p. 6). An example of a typology is given by Sanginga et al. (2006 p. 504). That communities, civil-society organisations and other stakeholders are invited to exercise direct control over key project decisions.
Finding a good fit between the knowledge and information desired by farmers and the services delivered by extension service providers.
That the funds are to be allocated to groups that qualify for the funding
(perhaps based on the level of poverty) and where adequate project proposals have been formulated.
Any community group (i.e. a village) in Malawi can be invited to state its primary needs.
Leveraging feedback from OECD foreign investors and the local private sector on their priorities.
Developing countries and those that are in transition should determine if and how ICTs are a priority for their social and economic development.
Programs based on the stated needs of the SMEs themselves rather than based on the perceptions of officials.