TOPICAL REVIEW • OPEN ACCESS
Co-benefits of greenhouse gas mitigation: a review
and classification by type, mitigation sector, and
geography
To cite this article: Hong-Mei Deng et al 2017 Environ. Res. Lett. 12 123001
View the article online for updates and enhancements.
Related content
Ancillary health effects of climate mitigation scenarios as drivers of policy uptake: a review of air quality, transportation and diet co-benefits modeling studies
Kelly M Chang, Jeremy J Hess, John M Balbus et al.
-2 °C and SDGs: united they stand, divided they fall?
Christoph von Stechow, Jan C Minx, Keywan Riahi et al.
-Negative emissions—Part 3: Innovation and upscaling
Gregory F Nemet, Max W Callaghan, Felix Creutzig et al.
-Recent citations
Negative emissions—Part 3: Innovation and upscaling
Gregory F Nemet et al
-Connecting the sustainable development goals by their energy inter-linkages David L McCollum et al
TOPICAL REVIEW
Co-benefits of greenhouse gas mitigation: a review and
classification by type, mitigation sector, and geography
Hong-Mei Deng1,2,3,4, Qiao-Mei Liang1,2,3,5, Li-Jing Liu1,2,3and Laura Diaz Anadon4,5
1 Center for Energy and Environmental Policy Research, Beijing Institute of Technology, Beijing 100081, People’s Republic of China 2 School of Management and Economics, Beijing Institute of Technology, Beijing 100081, People’s Republic of China
3 Beijing Key Lab of Energy Economics and Environmental Management, Beijing 100081, People’s Republic of China 4 Department of Land Economy, University of Cambridge, Cambridge CB3 9EP, United Kingdom
5 Authors to whom any correspondence should be addressed.
OPEN ACCESS
RECEIVED 24 July 2017 REVISED 6 November 2017 ACCEPTED FOR PUBLICATION 7 November 2017 PUBLISHED 18 May 2018
Original content from this work may be used under the terms of the Creative Commons Attribution 3.0 licence. Any further distribution of this work must maintain attribution to the author(s) and the title of the work, journal citation and DOI.
E-mail:[email protected]@cam.ac.uk
Keywords:co-benefits, greenhouse gas mitigation, bibliometric analysis, co-occurrence analysis, geographic level, sectors, methods Supplementary material for this article is availableonline
Abstract
The perceived inability of climate change mitigation goals alone to mobilize sufficient climate change
mitigation efforts has, among other factors, led to growing research on the co-benefits of reducing
greenhouse gas (GHG) emissions. This study conducts a systematic review (SR) of the literature on
the co-benefits of mitigating GHG emissions resulting in 1554 papers. We analyze these papers using
bibliometric analysis, including a keyword co-occurrence analysis. We then iteratively develop and
present a typology of co-benefits, mitigation sectors, geographic scope, and methods based on the
manual double coding of the papers resulting from the SR. We find that the co-benefits from GHG
mitigation that have received the largest attention of researchers are impacts on ecosystems, economic
activity, health, air pollution, and resource efficiency. The co-benefits that have received the least
attention include the impacts on conflict and disaster resilience, poverty alleviation (or exacerbation),
energy security, technological spillovers and innovation, and food security. Most research has
investigated co-benefits from GHG mitigation in the agriculture, forestry and other land use
(AFOLU), electricity, transport, and residential sectors, with the industrial sector being the subject of
significantly less research. The largest number of co-benefits publications provide analysis at a global
level, with relatively few studies providing local (city) level analysis or studying co-benefits in
Oceanian or African contexts. Finally, science and engineering methods, in contrast to economic or
social science methods, are the methods most commonly employed in co-benefits papers. We
conclude that given the potential mobilizing power of understudied co-benefits (e.g. poverty
alleviation) and local impacts, the magnitude of GHG emissions from the industrial sector, and the
fact that Africa and South America are likely to be severely affected by climate change, there is an
opportunity for the research community to fill these gaps.
1. Introduction
1.1. The policy context on co-benefits from GHG mitigation
The impact of anthropogenic greenhouse gas (GHG) emissions on the global climate is a major challenge for sustainable development (IPCC2014). Since 1992 there has been a lot of activity in the international sphere to develop national plans to address the chal-lenge of climate change, culminating in the 2015
Paris Agreement. To date, the parties to the Paris Agreement have submitted 165 pledges detailing their plans (among other things) to reduce emissions— these pledges are known as Intended Nationally Determined Contributions (INDCs) (UNFCCC2017). However, even if these INDC pledges are met (and many may not be), they are widely acknowledged to be insufficient to limit the increase in global aver-age temperature over pre-industrial levels by 2◦C (Robiou du Pontet al2017).
Research has shown that there are many reasons why pledges to reduce GHG emissions and actions to date have been insufficient including politics, concerns about costs and fairness, and the fact that (in most places) the public does not rank climate change miti-gation at the top of the list of important issues facing their country (Greenblatt and Wei2016, Meinshausen et al 2015). This low prominence of concerns about climate change in the public sphere is largely explained by the fact that mitigation efforts (and costs) today are expected to largely result in avoided harms in the future and to‘other people’(Hansenet al2013). People tend to prioritize economic growth and the improvement of their living standards—i.e. they want energy that is first
‘cheap’and then clean—which means that protecting the benefits of people far away in the future is not high on the priority list (Ansolabehere and Konisky2014).
The concern that climate change mitigation goals alone may not be able to catalyze sufficient public sup-port to implement more aggressive GHG emissions mitigation efforts (Bollenet al2009) has partly resulted in an increased interest in (and research on) other ben-efits from GHG mitigation, which will be referred to as
‘co-benefits’from now on. These co-benefits include things like improvements in health outcomes and bio-diversity.
In this work, we assess the state of knowledge on the co-benefits of GHG mitigation by developing and implementing a typology of co-benefits research that differentiates between the types of co-benefits, miti-gation sectors, and geographic scales investigated, and the types of research methods used. We also summa-rize common metrics from a bibliometric and keyword co-occurrence analysis, including the journals that are publishing co-benefits research.
The rest of this paper is structured as follows. We first discuss the methods used in this review (section2) and present the descriptive results from the systematic review and bibliometric analysis (section3). We then describe the typology of co-benefits developed in this work (section4), and present the results of applying it to the papers resulting from the systematic review (section 5). We conclude with a discussion of key insights from the analysis for researchers and policy makers (section6).
Before delving into the main analysis of the article, however, we define co-benefits (section1.2) and sum-marize why an assessment of the knowledge base in this space is timely and needed (section1.3).
1.2. Defining co-benefits
Although a few studies discussed the health benefits of reducing GHG emissions in the late 1990s (Ekin 1996, Messner 1997, Wang and Smith 1999), the concept of co-benefits was not formally put forward until 2001 in the Intergovernmental Panel on Climate Change (IPCC) Third Assessment Report (IPCC2001). Mayrhofer and Gupta (2016) summarized the evolu-tion of the co-benefits concept and argued that this
term can be traced back to the concepts of‘no-regrets’
policies and ‘double dividends’ for carbon taxation. According to the IPCC Third Assessment Report (IPCC2001),‘co-benefits are benefits of policies that are implemented for various reasons at the same time, including climate change mitigation, acknowledging that most policies designed to address GHG mitiga-tion also have other, often at least equally important, rationales (e.g. related to objectives of development, sustainability, and equity)’.
The term‘co-benefits’is sometimes used to denote non-climate change mitigation benefits that are clearly mentioned as additional (if not primary) motives in the design and implementation of GHG mitigation poli-cies. In this work, however, we also include in the term
‘co-benefits’ what the IPCC designates as ‘ancillary benefits’, which refer to side effects arising subsequently from the scheduled greenhouse gas mitigation policies (IPCC2001). In other words, we also include in our definition of co-benefits (and thus in this review) the impacts of particular climate change mitigation efforts that may not have yet been used as primary or secondary policy goals.
Finally, following the IPCC Fifth Assessment Report (IPCC2014), our definition of co-benefits from GHG mitigation includes both positive effects and neg-ative effects (also known as‘adverse side effects’). Even though the value of research on co-benefits to moti-vate additional climate change mitigation efforts from policy makers or to increase public support for cli-mate change mitigation efforts stems from the‘positive’
co-benefits, it is clearly important to understand the adverse effects of such mitigation efforts, as they will also affect policy making and should shape future research. Thus, for completeness, we include adverse side-effects in the definition of‘co-benefits’used in this systematic review. To summarize, in this work we define
‘co-benefits’to include‘positive’co-benefits, ancillary benefits and adverse side effects.
1.3. The need to better understand the body of knowledge about co-benefits
Many researchers working on climate change mitiga-tion and public health will not need a systematic review and additional analysis to conclude that a lot of research has investigated GHG mitigation co-benefits in the form of reduced air pollution and improved health out-comes (e.g. Buonocoreet al2016, Driscollet al2015, Tanget al 2014, West et al2013). In addition, it is relatively well-known that there is a body of research on the protection of biodiversity, the preservation of watersheds and soil, and the reclamation of land that can result from GHG mitigation activities focusing on reducing deforestation. The link between understand-ing these types of co-benefits from GHG mitigation and making the case for action has also been made. For instance, Dudeket al(2003) have argued that local authorities in Russia have been encouraged to pro-vide more finance for forest projects by emphasizing
benefits in terms of both AFOLU emissions reduc-tions and other ecosystem benefits from preventing deforestation.
Having said that, researchers and policy makers would benefit from a systematic and comprehensive analysis of the types of co-benefits that have been identi-fied and investigated, in which GHG mitigation sectors such co-benefits may accrue, and the geographic focus of research on co-benefits. Similarly, researchers and students would also benefit from a detailed and sys-tematic understanding of what types of methods and data have been used to determine the existence (and in some cases magnitude) of different types of co-benefits. The reason for this is that, as we know from work on policy analysis, translating policies or insights from one place to another is extremely hard unless all underlying mechanisms are perfectly understood (Cartwright and Hardie2012), something that is partic-ularly difficult in complex systems (Anadonet al2016). Thus, having information about the types of co-benefits from GHG mitigation in a particular sector and location would help support policy decisions in that particu-lar location (and, in some cases, elsewhere, provided there is appropriate local knowledge) by providing information about the benefits (and sometimes costs) of GHG mitigation. Similarly, a lack of research in a particular space might signal a missed opportu-nity for researchers and policy makers to identify possible additional co-benefits (which again, includes benefits and costs) from GHG mitigation.
Knowledge on the co-benefits of mitigating GHG emissions in different locations and sectors can serve as an input to cost-benefit analysis or to assessments of tradeoffs of climate change mitigation policies. But perhaps more importantly than improving cost-benefit analysis, knowledge about the co-benefits of GHG mit-igation (particularly at the local level) may provide information and rationales for taking action to mitigate GHG emissions that are more persuasive to particular sets of decision makers or the public as a whole.
The complexity of understanding what we know about the co-benefits of GHG mitigation is significant given the heterogeneity of the co-benefits (e.g. from health benefits, to increased resilience, to increased eco-nomic development outcomes), the mitigation sectors in which these co-benefits may be realized (e.g. agricul-ture, industry, electricity and transportation sectors), and the fact that such co-benefits may be highly depen-dent on where the GHG mitigation takes place (e.g. in New York City, in the Indus basin, in China, or glob-ally). Given that countries and regions vary significantly in their susceptibility to climate change, their previous and future contributions to worldwide GHG emissions, and their capacity to share the responsibility of mit-igating GHG emissions (Cazorla and Toman 2000), having robust evidence regarding what co-benefits may accrue from a particular GHG mitigation effort in a particular sector and location may help spur action. In addition, a comprehensive understanding of the
co-benefits of climate change mitigation policies can also help inform country negotiators in interna-tional environmental negotiations (Pittel and R¨ubbelke
2007).
There have been previous reviews in the area of co-benefits, but their scope differs significantly from this review. In particular, most of the existing reviews were conducted from the perspective of either: (a) particular co-benefits (e.g. health co-benefits (Remais et al2014, Cheng and Berry2013, Bell et al2008)); (b) the co-benefits of climate change adaptation efforts (VijayaVenkataRamanet al2012) as opposed to GHG mitigation efforts; (c) the co-benefits of mitigation in a subset of sectors (e.g. transport sector (Kwan and Hashim2016), AFOLU sector (Bustamanteet al2014, Verspechtet al2012), energy sector (Smith and Haigler 2008)); (d) the co-benefits in a small number of geo-graphical locations (e.g. South Africa (Klausbruckner et al 2016), Bangladesh (Ahammad et al 2014)); or (e) methodologies for quantifying and valuing the co-benefits of GHG mitigation ( ¨Urge-Vorsatzet al2014). In contrast, this study reviews the overall liter-ature on GHG mitigation co-benefits between 2001 (the year when the term was coined) and 2016 both qualitatively and quantitatively to develop a system-atic and comprehensive typology of co-benefits across a range of dimensions, assess the relative effort of researchers on different efforts, and identify possible gaps in the body of knowledge. We use a systematic review and bibliometrics (the detailed analysis of pub-lication trends in scientific journals) to characterize the information such as document type, journals, authors, and article citations. The bibliometric analysis includes a keyword co-occurrence analysis, network analysis, and citation analysis. We then analyze the full text of the papers resulting from the systematic review. This analysis involves the hand-coding of the papers by two researchers independently to classify papers according to the types of co-benefits, mitigation sectors and geo-graphic levels investigated, as well as according to the research methods used. Our comprehensive approach allows us to systematically document the areas of focus of the research community across a wide range of co-benefits, sectors, geographies, and methods.
2. Methods
2.1. Overview of methods
This study relies on a systematic review, bibliometric analysis, and network analysis. We then hand-code the papers resulting from the systematic review and develop and implement a typology of co-benefits research. We now provide more background on the methods used in this paper before providing detail on our particular implementation in sections3–5.
Systematic reviews follow rigorous transparent processes to extract findings from a body of research in a replicable manner, in some cases to inform future
research and policy (Stoker and Evans 2016). Sys-tematic reviews involve the sysSys-tematic identification, mapping, and synthesis of the body of research. The sys-tematic review was conducted iteratively with different rounds of full-text analysis.
Bibliometric analysis are routinely used to pro-vide a quantitative analysis of academic literature and to evaluate the performance of a specific study area (Nicolaisen2010, Weiet al2015). It is often employed to assess characteristics of the literature in terms of journals, authors, institutes, countries, citations, inter-national collaborations and so on (Li and Zhao2015). Bibliometric analysis has been widely used to study the state of knowledge in the area of energy and envi-ronmental policy. Examples of bibliometric analysis in this space include the study of carbon markets (Du et al2015), carbon taxes (Zhanget al2016), climate policy modeling (Weiet al2015), low-carbon energy technology investment (Yuet al2016), climate change research (Haunschildet al2016) and energy manage-ment strategies for hybrid electric vehicles (Zhanget al
2015).
We start with a systematic review. We then con-duct a traditional bibliometric analysis of the corpus of papers extracted during the systematic review. We present the results from the bibliometric analysis detail-ing main research subjects, lead authors and highly cited publications, etc. We then use network analysis to visu-alize some of these results. Finally, we conduct a detailed analysis of the papers resulting from the systematic review that entails the a hand-coded mapping anal-ysis developed iteratively categorizing papers (using the abstract or the full text) into different co-benefits, sectors, areas of geographic focus, and methods. Such additional and more targeted classification of the papers of co-benefits aims to better inform researchers in the field and policy makers is not possible using solely traditional automated bibliometric analysis.
2.2. Details of method implementation
2.2.1. Identification of the corpus of papers in the sys-tematic review
The raw list of publications analyzed in this paper was obtained from Web of Science, which includes Science Citation Index Expanded (SCI-E) and Social Sciences Citation Index (SSCI) on 19 February 2017 to ensure that virtually all papers from the year 2016 were covered (we did not impose a limit in terms of starting year). The first step of the systematic review was to iteratively develop a search string to ensure that all relevant papers were captured. The iterative process involved analyzing the literature to identify synonymous terms and revising the search string until the results stopped changing. The final search string, which led to the identification of 4766 papers, is included in the appendices (tableA1).
The second step involved excluding the pub-lications that included correct terms but were on unrelated topics. Visual inspection of the abstract of the papers (and the full text when necessary to make a
determination), for example, revealed that a signifi-cant number of publications involved unrelated papers from the chemical or medical sciences instead of the climate change mitigation co-benefits. By including an
‘exclusion criteria’with words that were common in unrelated papers, such as catalyst, reaction, chemical, metabolism and chemotherapy, the list of papers to be considered in the next step of analysis was reduced to 2277 papers.
The third step involved the one-by-one exami-nation of these papers by two researchers working independently to further exclude other unrelated papers. The reconciliation of the exclusions between the two independent researchers led to a final list of 1554 papers on co-benefits from GHG mitigation for further in-depth analysis.
For completeness, we have included the full search string (including the words used to exclude unrelated papers) in the appendices (table A2). We found that the number of publications on co-benefits before2001 was very small (less than 1% of the total). The reason for this is that, as previously explained, the concept of co-benefits was formally put forward in 2001. Because of this, we define the time window for our analysis as 1 January 2001−31 December 2016.
Using the categories available in the dataset from Web of Science, we analyzed the 1554 publications in the final dataset according to their language, document type, subject categories, journals, publication outputs and citations, authors, institutes and countries. These results are covered in section3.
2.2.2. Network analysis
A second stage of the analysis involved a network analysis by using the software BibExcel and Pajek. BibExcel was used to extract information which was downloaded from the dataset of Web of Science. Pajek was then employed for visualization of the analyzed results. The cooperation across authors, institutes and countries, the network of highly cited publications and frequently occurred keywords were analyzed accord-ingly in section3.
2.2.3. Development and implementation of the classifi-cation of co-benefits research
The third and final stage of the research involved the mapping of the papers identified in the systematic review. This involved hand-coding the papers from the systematic review into different types of co-benefits in different sectors and geographic locations, resulting in the typology of co-benefits presented in section4. We also classify the papers according to the main method used.
We categorized the co-benefits into ten types: ecosystem impacts, economic impacts, health impacts, air pollution impacts, resource efficiency impacts, conflict and disaster resilience impacts, distribu-tional impacts, energy security impacts, technological spillover and innovation impacts, and food security
impacts. The categorization of sectors for GHG miti-gation resulted in eight types: AFOLU sector, electricity sector, transport sector, residential sector, governmen-tal sector, industrial sector, marine sector, and buildings sector. Four geographic levels were used to map papers: international level, national level, regional level (a con-nected part of areas within a country), and city level. Finally, the corpus of papers from the review were clas-sified according to the continent or continents that were being covered: Europe, Asia, North America, Oceania, Africa and South America. We also classified papers depending on what was the main method used: science and engineering methods, economic meth-ods and social science methmeth-ods. The papers resulting from the systematic review coded according to these five dimensions. The results from this coding analy-sis are available in the supplementary data available
atstacks.iop.org/ERL/12/123001/mmedia. Papers that
covered more than one co-benefit, more than one sec-tor, country, or method appear more than once in the supplementary data. To visualize the results from the mapping and coding exercise across the co-benefit type, mitigation sector, geographic level, continent, and research method, we use Sankey diagrams imple-mented through the Tableau software, as shown in section5.
3. Results from the bibliometric analysis of
co-benefit papers
In this section we describe the field of co-benefits pub-lications explaining in turn: the general statics on the evolution of co-benefits publications (section3.1), the most prolific authors, institutes and countries (section 3.2), the network of cooperation across authors and their affiliations in this space (section3.3), a citation analysis (section3.4), an analysis of the most commonly co-occurring keywords (section3.5), and an analysis of the research methods used in co-benefits publications using keywords (section3.6).
3.1. General statistics on co-benefit publications
The 1554 publications retrieved in this study include publications in English, German, French, Polish and Italian, with English, as expected, accounting for the vast majority (99.4%) of the publications. Articles (as opposed to letters, reviews, or book chapters, for instance) account for the majority (88.0%) of the total number of publications. The appendices (table A3) include more descriptive information on languages and publication types.
As one may expect, given the fact that the term‘ co-benefits’was created in 2001, reviews on the topic came out relatively recently; more than 50% of the reviews were conducted between 2013 and 2016, with the first review being released in 2002. According to Web of Science Categories (including environmental sciences, environmental studies, energy fuels, ecology, green
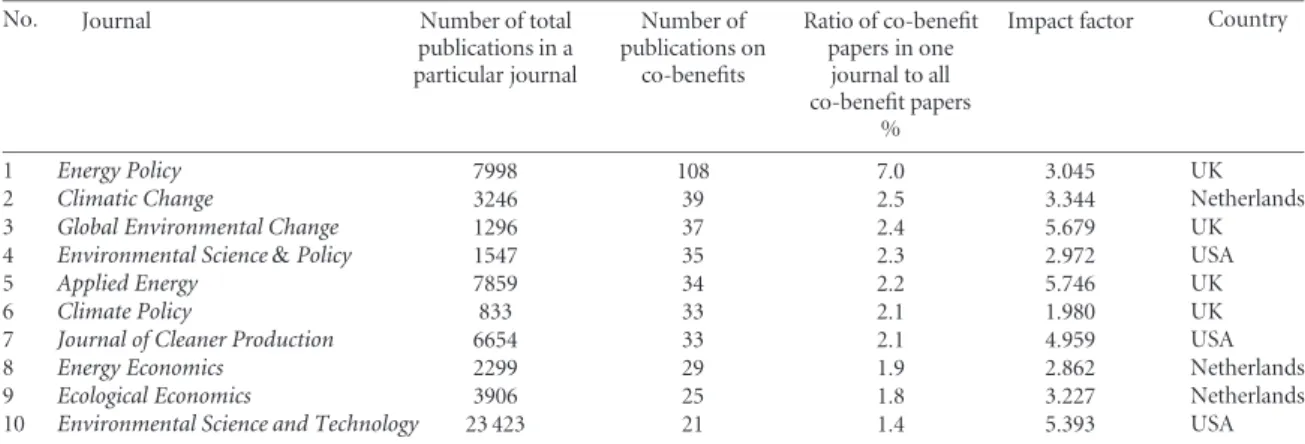
sustainable science technology, economics, meteorol-ogy atmospheric sciences, engineering environmental, public environmental occupational health, geography, forestry, etc), the top five subjects which account for 61.2% of the total subjects used to categorize the papers in Web of Science are environmental sciences6(21.8%), environmental studies7(15.5%), energy fuels (9.2%), ecology (5.1%) and green sustainable science technol-ogy (9.6%).Energy Policyis the journal in which the largest number of co-benefits papers was published, with 108 publications (7.0% of the total). The top ten journals with the largest number of publications on co-benefits from GHG mitigation are listed in the appendices (tableA4).
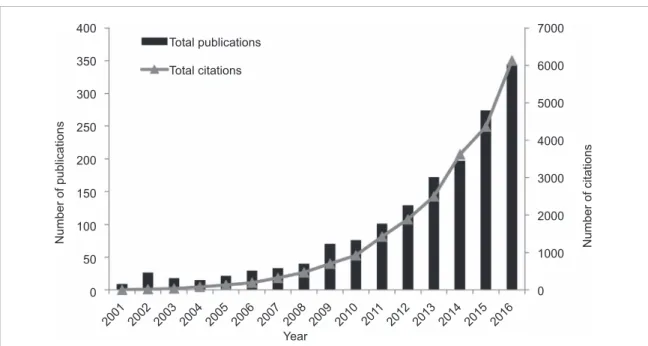
Figure 1 shows the evolution of publications on co-benefits from GHG emissions mitigation over the period studied. The increase in the number of publica-tions in this space has been exponential, starting from nine publications in 2001 (when the term‘co-benefits’
was coined) to 344 publications in 2016 with slight fluctuations.
3.2. Most prevalent authors, institutes and countries
The bibliometric analysis of productive authors, insti-tutes and countries can provide researchers and policy makers with useful information to facilitate their under-standing of this study area. The top 12 most prolific authors (with more than seven publications8) are pre-sented in the appendix (tableA5). Three of these most prolific authors are based at IIASA in Austria, two are based in the United Kingdom and two in Australia. The publications of these12authors account for 7.7% of the total number of co-benefit publications.
TableA6in the appendix shows the11most pro-ductive research institutes, defined as those that are authors or co-authors in more than 20 publications on co-benefits. IIASA was present as an institute in the largest number of publications (49, or 3.2% of the total). Nine of these research institutes are universi-ties, one is a governmental organization and one is non-governmental organization. Four of these insti-tutes are located in the UK and two in the Netherlands. The output of these 11 institutions makes up 21.0% of the total number of publications in this space. In spite of the lack of US-based authors and institutions in the‘top’spots, with the exception of the Univer-sity of California Berkeley, overall, publications written
6Environmental sciences is a stand-alone subject that draws on fun-damental scientific knowledge in mathematics, chemistry, physics, and biology coupled with specialization in a particular area of sci-ence to provide advanced scientific and quantitative understanding of contemporary environmental challenges.
7Environmental Studies is a subject that provides a broadly inte-grated understanding to the social, political, and historical facets of our environmental challenges with focus on policy, law, and sociality aspect of these challenges.
8The number of publications chosen here and similar numbers chosen in the following text are for better and clearer illustration of related information.
400 350 300 250 200 150 100 50 0 2001 2002 2003 2004 2005 2006 2007 2008 2009 2010 201 1 2012 2013 2014 2015 2016 Year 7000 6000 5000 4000 3000 2000 1000 0 Number of citations Total publications Number of publications Total citations
Figure 1.Total annual publications (black bars, left-hand-side vertical axis) and total annual (not cumulative) citations (grey line, right-hand-side vertical axis) on co-benefits from GHG mitigation (2001–2016)9.
by US-based scientists led the total output of co-benefit publications over time (they are just less concentrated). This can be seen in the annual academic performance of the top six most productive countries as illustrated in figure 2. The country with the largest number of publications was the United States, followed by the United Kingdom.
3.3. Network analysis of cooperation across authors, institutes and countries
A network analysis of scientific collaborators pro-vides insights about possible complementarities among researchers as well as of potential gaps.
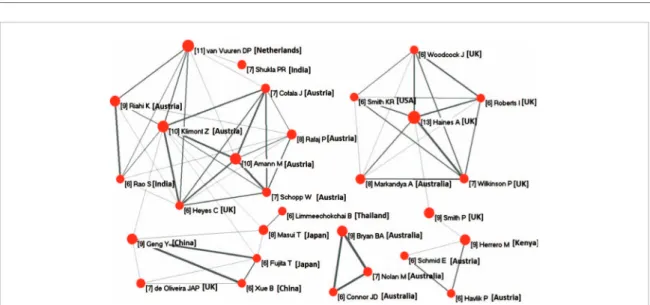
The red dots in figure3show the top 21 institutions in terms of the number of papers on co-benefits with at least one author from that institution. The existence of the black lines connecting the institutions indicate co-benefits papers with at least one author from each of the connected institutions; the wider the black line, the larger number of joint papers between those insti-tutions.
Imperial College in London cooperated the most frequently with other 13 institutes and it was followed by Tsinghua University in Beijing, which cooperated with 11 institutes. The University of Cambridge and IIASA were in the third-most-collaborative groups by having ten and nine joint publications respectively. Figure3shows that geographic proximity is somewhat correlated to publication cooperation in co-benefits, with small clusters of more intense collaboration in
9The evolution of the number of citations, exhibits a growing ten-dency and can be divided into two periods. During the first period 2001–2010, the total number of citations increased more slowly, from 3−856 times at an annual average rate of increase of 81.5%. The period between 2010 and 2016 exhibits an annual average rate of increase at 31.5%, reaching 5834 citations for these papers in 2016.
the UK (Cambridge, Imperial College and Oxford), continental Europe (as denoted by IIASA and the Uni-versity of Utrecht), and East Asia (as denoted by the National Institute of Environmental Studies in Japan and the Chinese Academy of Sciences). Such inten-sity of regional collaboration can be partly explained, as we will show in section 5.2 by the prevalence of national and international analysis on co-benefits, as opposed to urban or city level analysis. In the appendix (figureA1) we include a network analysis of the most collaborative authors. The most collabo-rative countries are also presented in the appendices (figureA2).
3.4. Citation analysis
Citation analysis is the evaluation of the frequency, patterns, and graphs of citations in articles and books (Buzydlowski et al 2002, Rubin 1998). Citations in articles play an important role to understand the impor-tance of particular pieces of research as measured by connections to other research works (Garfield and Mer-ton1979). We conducted two types of citation analysis. First, we conducted a backward citation analysis of the 1554 co-benefits publications that constitute our cor-pus of co-benefits publications (as described in section 2). This backward citation analysis involves analyzing what articles were cited most frequently by the co-benefits articles, such most highly cited articles may or may not be directly related to the co-benefits of reducing GHGs. FigureA3in the appendix depicts the results of the backward citation analysis. It shows the 18 studies that were cited more than 25 times by the papers in our dataset. Overall, analysis indicates that co-benefits research has mostly drawn upon research in epidemiology (articles inThe Lancet) and ecology. This finding is explained by our analysis in section3.5
Year
Number of publications
Figure 2.Annual co-benefits publications of the top six most productive countries10. A paper was assigned to one or various countries depending on whether the affiliations of the author(s) in the paper represented one or more countries (this means that a paper can be included in the total count of papers of more than one country).
Figure 3.Cooperation networks among the 21 prolific institutes on co-benefits publications. The size of the node implies the number of publications of each institute, and the thickness of the linkages among the nodes indicates the strength of the cooperation measured by the number of papers that are jointly co-authored.
indicating that health and biodiversity co-benefits of GHG have been the most widely investigated topics.
Second, we conduct a forward citation analysis, namely, an analysis of the publications that cited the 1554 publications in our database. Forward citation analyses give an indication of the relative impor-tance of different papers (Garfield1979), although they
10It should be noted that in this study China just refers to mainland China and documents from Taiwan, Hong Kong, Macao are not included in China.
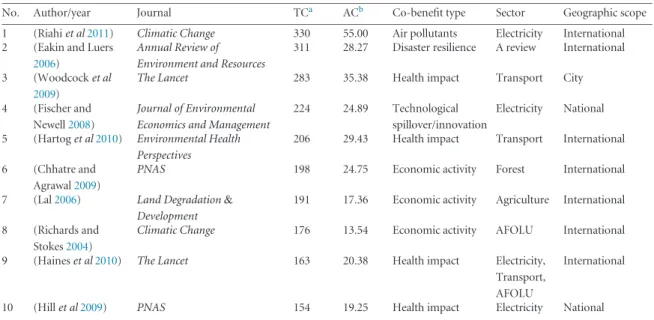
are imperfect measures of scientific merit since, for instance, citations are also a function of the research effort in a particular area (the number of researchers in a field) and field-specific norms (Adleret al2008). In addition, papers that have been out for a longer period of time have more of a chance of being cited, i.e. a 2016 paper with five citations in 2016 may end up with the same citations in 4 years as a paper published in 2012 with 100 citations in 2016. The top ten papers in our database with the largest number of forward citations are shown in the appendices (tableA7).
[41] sustainability [36] sustainable development [28] Energy efficiency [36] renewable energy [22] Bioenergy [23] energy [69] adaptation [19] vulnerability [21] resilience [17] transport [21] agriculture [16] India [35] China [24] integrated assessment [19] uncertainty
[20] Life cycle assessment [28] food security [25] Health [56] Air pollution [24] Land use [42] biodiversity [62] ecosystem services [60] mitigation
[44] climate change mitigation
[254] climate change
[49] REDD [31] greenhouse gas emissions [20] Greenhouse gas [22] greenhouse gases [88] co-benefits [20] ancillary benefits [30] trade-offs [44] Climate policy [33] carbon sequestration [18] Policy
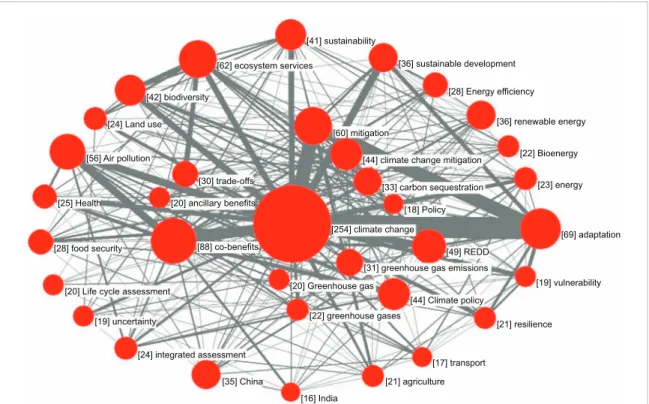
Figure 4.Network of frequently occurred keywords. The graph only includes the 35 keywords that are included in at least 15 papers. The size of the node is directly proportional to the number of times each keyword appeared (as shown in the bracket on the right of each node), and the thickness of the linkages between the nodes (the keywords) is proportional to the frequency with which two keywords appear together in the same paper.
3.5. Keyword co-occurrence analysis
Co-occurrence analysis of keywords is used to indicate the substantive content of documents by statistically investigating the keywords (terms) that appear together in the same document (Buzydlowskiet al2002). The 1554 articles in this study contain 4045 individual key-words, which are terms (typically somewhere between three and five) provided by the authors upon submis-sion of their scientific publication. Figure4shows the 35 keywords that appear more than 15 times in this database, indicating that only a small portion of key-words are frequently used. The fact that only a few keywords are used more frequently is partly explained, again by the wide range of co-benefits, sectors, geogra-phies and methods covered in co-benefits research, as we uncover in section4.
The analysis of the frequency and co-occurrence of keywords provides some insight into the areas of focus in terms of co-benefits, sectors and countries, as well as methodologies. We discuss these findings in turn.
In terms of focus areas, figure4shows groups of words that are co-occurring, in particular: air pollution, co-benefits, and climate change; ecosystem services, biodiversity, climate change and adaptation; and mit-igation, adaptation and climate change. The first two groups, in particular, indicate that air pollution and ecosystem services are the areas of research on co-benefits that have seen the largest amount of effort. As hinted in the introduction, there are many other co-benefits. GHG mitigation from transport sector and agriculture sector are more frequently appeared in the keywords. We can also see a significant focus
on national level analysis, in particular of co-benefits in China and India. Finally, figure 4also provides a sense of the most commonly used methodologies in the work on co-benefits, in particular integrated assessment models and life cycle assessment.
However, we found this keyword occurrence and co-occurrence analysis insufficient to understand research on co-benefits and identify gaps. As we discuss in section2, we found no study categorizing co-benefit research in terms of co-benefit types, sectors for GHG mitigation, and geographic scope. Because of this, we iteratively developed and applied such a classification (typology) using the full content of the papers, as opposed to just keywords and keyword occurrence, using our database. Section4details the typology we developed in the course of conducting full text analysis of the 1554 papers in the systematic review.
3.6. Keyword analysis of methods used in co-benefit papers
The analysis of keywords indicated that the most fre-quently used methods are integrated assessment models and life cycle assessments. More than 5.0% of the papers explicitly mentioned these two methods in the key-words. In the appendix (tableA8) we provide specific examples of some of the most commonly used methods. The methods that are less frequently mentioned in the keywords also include risk assessment, opti-mization, cost-benefit analysis, Input-Output analysis, computable general equilibrium (CGE) model, GAINS model, partial equilibrium model, multi-criteria assess-ment, Environmental Benefits Mapping and Analysis
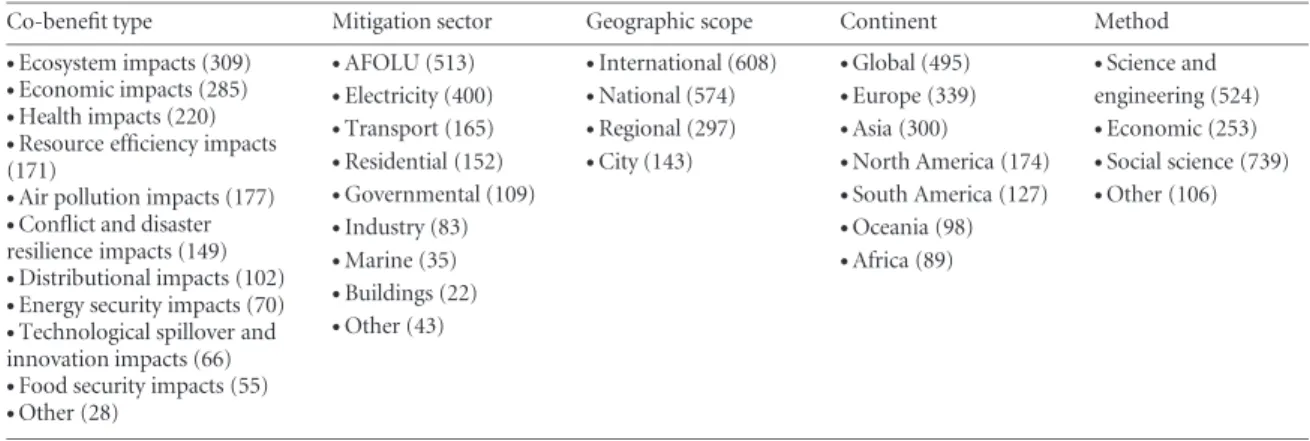
Table 1.Typology of co-benefits papers. Developed inductively and iteratively through the hand-coding of papers from the systematic review according to co-benefit type, mitigation sector, geographic scope, continent, and research method.
Co-benefit type Mitigation sector Geographic scope Continent Method
∙Ecosystem impacts (309) ∙Economic impacts (285) ∙Health impacts (220) ∙Resource efficiency impacts (171)
∙Air pollution impacts (177) ∙Conflict and disaster resilience impacts (149) ∙Distributional impacts (102) ∙Energy security impacts (70) ∙Technological spillover and innovation impacts (66) ∙Food security impacts (55) ∙Other (28) ∙AFOLU (513) ∙Electricity (400) ∙Transport (165) ∙Residential (152) ∙Governmental (109) ∙Industry (83) ∙Marine (35) ∙Buildings (22) ∙Other (43) ∙International (608) ∙National (574) ∙Regional (297) ∙City (143) ∙Global (495) ∙Europe (339) ∙Asia (300) ∙North America (174) ∙South America (127) ∙Oceania (98) ∙Africa (89) ∙Science and engineering (524) ∙Economic (253) ∙Social science (739) ∙Other (106)
Program (BenMAP), linear programming, and other modeling methods. We include a more detailed description of the analysis of methods based on key-words in the appendix (tableA8). Section5.4describes the results from the typology we developed to classify the co-benefits papers from the systematic review con-sidering the full paper, and not just the keywords used by the authors when submitting their paper. This clas-sification by method going beyond keywords allows us to characterize the full set of papers from the systematic review.
4. Typology of co-benefits publications
We create a four-dimensional typology of co-benefits publications covering co-benefit type, mitigation sec-tor, geographic level, and geographic focus by analyzing the abstract of each paper and (when needed to make a determination) the full-text of the co-benefits papers resulting from the systematic review. We also classify papers according to the method used, adding a fifth dimension.
Unlike the summary of the hotspots based on frequently occurring keywords in section3.5, the iter-ative hand-coded classification by two independent researchers presented here resulted in ten types of co-benefits, eight climate change mitigation sectors, four types of geographic levels, six continents and three high-level types of methods, as presented in table 1 and explained in sections4.1−4.3.
The number of papers for each category is also shown in table1in brackets to give a first impression of the relative research activity in the different categories. We measure activity in each category of the typology by counting the number of papers instead of weight-ing them by citations or journal impact factor. We do not present results weighted by patent citations because this is a relatively new research area with a lot of recent papers. Comparing recent papers from, for instance, 2014–2016 to older papers on the basis of citations would not reflect the fact that many of the papers (which are recent), which are recent, will not have
had a chance to be cited as much. Having said this, for the work in section3.4we conducted a forward citation analysis and we found that the results we present in terms of the prevalence of research on different co-benefits, sectors, geographies, continents, methods, etc. in figures 6–9 in section 5 would not change significantly if we presented results weighted by citations.
We do not present results weighted by journal impact factor because of the multi-disciplinary nature of the research. Impact factors in the social and natu-ral sciences, for example, tend to be very different and this could skew results. Such weighing by impact factor could suggest that there is a lot more work in one partic-ular co-benefit just because the field of research that has devoted more research in that space has journals with higher impact factors. Thus, we have not included an analysis of the prevalence of research in different areas weighted by impact factors in the main text. However, in the supplementary materials we include information about the impact factors of each journal in the database to complement our analysis.
4.1. Co-benefit types
The iterative development of the typology presented in table1resulted from the abstract and then full-text analysis of the 1554 papers from the systematic review. In what follows, we describe each of the 10 types of co-benefit types identified and provide one or several example papers in each category.
Some of the co-benefit types can be described as ‘direct’ co-benefits, while others are ‘indirect’
co-benefits. Direct co-benefits from climate change mitigation policies include ecosystem impacts, air pollutants, health impact, resource efficiency, energy security and technological innovation. Some co-benefits can be both direct and indirect. For example, food security can be a direct impact of mitigation pol-icy if it leads to more domestic production and an indirect impact if reduced GHG emissions lead to less drought and an increase in crop-yields. Increased eco-nomic activity, conflict impact and disaster resilience,
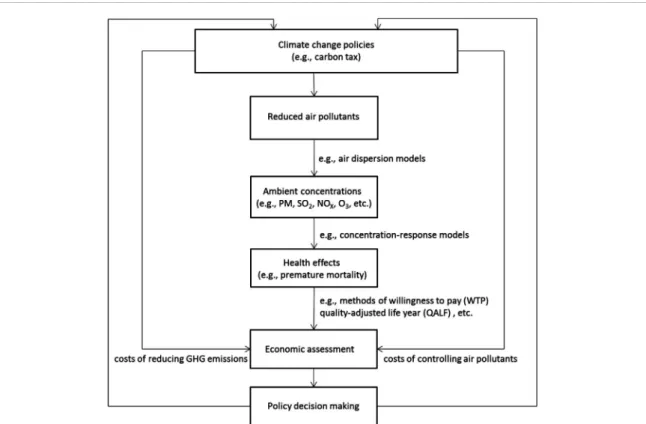
Figure 5.Schematic overview of the relationship between papers categorized in the‘air pollution impacts’co-benefit and papers in the
‘health impacts’co-benefit11.
Type Type-Sector Sector
Ecosystem impact 19.1%
Economic activity 17.6%
Health impact 13.6%
Air pollutants 10.9%
Resource efficiency 10.5%
Conflict and disaster resilience 9.2%
Distributional impact 6.3% Energy security 4.3% Technological spillover/innovation 4.1% Food security 3.4% Other 1.1% AFOLU 31.6% Electricity 24.7% Transport 10.2% Residential 9.4% Other 8.8% Governmental 6.7% Industry 5.1% Marine 2.2% Buildings 1.4%
Figure 6.Co-benefit types in different mitigation sectors. The width of the lines connecting a particular co-benefit (left-hand side column) with mitigation in a particular sector (right-hand side column) is proportional to the number of papers studying that issue.
and distributional impacts can also be direct or indirect co-benefits.
11 This figure was created by the authors using components of figures and text presented in related research, most importantly Bellet al (2008), Cao (2007), Cifuenteset al(2000), and Dessus and O’Connor (2003).
4.1.1. Ecosystem impacts
An important co-benefit of mitigating GHGs identified in the literature is the prevention of negative impacts on ecosystems, including biodiversity loss, ocean acid-ification, soil degradation, water pollution, and the loss of other ecosystem services.
Type Type-GeoLevel GeoLevel Ecosystem impact 19.1% Economic activity 17.6% Health impact 13.6% Air pollutants 10.9% Resource efficiency 10.5%
Conflict and disaster resilience 9.2%
Distributional impact 6.3% Energy security 4.3% Technological spillover/innovation 4.1% Food security 3.4% Other 1.1% International 37.5% National 35.4% Regional 18.3% City 8.8%
Figure 7.Co-benefit types at different geographic levels. The width of the lines is proportional to the number of papers.
Type Type-Continent Continent
Ecosystem impact 19.1%
Economic activity 17.6%
Health impact 13.6%
Air pollutants 10.9%
Resource efficiency 10.5%
Conflict and disaster resilience 9.2%
Distributional impact 6.3% Energy security 4.3% Technological spillover/innovation 4.1% Food security 3.4% Other 1.1% Global 30.5% Europe 20.9% Asia 18.5% North America 10.7% South America 7.8% Oceania 6.0% Africa 5.5%
Figure 8.Categorization of papers by co-benefit and continent providing the context for the analysis. The width of the lines is proportional to the number of papers studying a particular co-benefit in a particular continent.
The work of Phelpset al(2012), for example, falls in the category of ecosystem impacts co-benefit. Their work estimates the probability of critical biodiversity losses with events caused by climate change using five methods to link forest-based climate change mitigation with biodiversity conservation.
Many of the publications on the Reducing Emis-sions from Deforestation and Forest Degradation (REDD+) program developed by the United Nations Framework Convention on Climate Change also fall into this category of benefits. The publications reviewed indicate that the REDD+ program has ecosystem
co-benefits that include reductions in biodiversity losses and soil erosion through an increase in forest-based carbon sequestration (Harriset al2008), as well as other co-benefits in the space of resource efficiency impact (which we will discuss in section4.1.5below), including conserving water and other natural resources (Chhatreet al2012). Climate policies can also have co-benefits of mitigating ocean acidification on account of their common driver: CO2. Therefore, climate change mitigation policies can alleviate the change of a signif-icantly productive marine ecosystem structure (Kirby et al2009). Furthermore, marine life and humans will
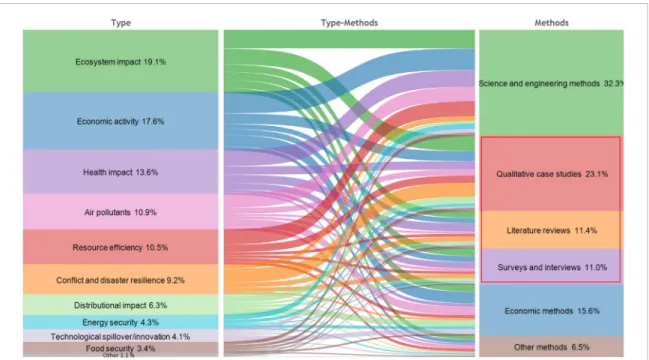
Figure 9.Categorization of papers by co-benefit and method providing the context for the analysis. The width of the lines is proportional to the number of papers studying a particular co-benefit by a particular method.
not be widely impacted by the phenomenon of ocean acidification (Harrould-Kolieb and Herr2012).
4.1.2. Economic impacts
The co-benefit of economic impacts includes economic development, employment, and productivity increases (e.g. improvements in crop yields).
For example, Jochem and Madlener (2003) esti-mated that the macroeconomic effects from climate mitigation can be slightly negative to positive, depend-ing on model structure as well as on assumptions on capital and labor markets. Fisheret al(2011) showed that climate change mitigation through REDD+ mech-anism in Tanzania was associated with increases in agricultural yields.
4.1.3. Air pollution impacts
Significant work has been devoted to estimating the impact of policies to reduce GHG emissions, such as carbon taxes, emissions trading systems market and energy efficiency improvements, on the co-benefit of reducing air pollution (Rypdalet al2007, Zhanget al
2015, Nemetet al2010).
A large number of studies have been focused on air pollutants, which include particulate matter (PM10, PM2.5), SO2, NOx, ozone and black carbon. For exam-ple, Bollen (2015) used a CGE model to analyze the air pollution co-benefits from climate policies in Europe and indicated that the substantial regional impacts in terms of reduced air pollution can provide an addi-tional motivation for reducing GHGs. Donget al(2015) conducted an analysis at a more granular level. They measured the air pollution impacts of reducing CO2 emissions in China at a provincial level and concluded that climate mitigation investment in western regions
would yield more cost-effective reductions in reducing air pollution when compared to eastern regions.
4.1.4. Health impacts
In many cases, air pollution impacts (co-benefits) are used to estimate improvements in public health outcomes measured in terms of either reduction in mortality, morbidity, increased prevalence of diseases, and/or increased health costs. This estimation is sup-ported by epidemiological research linking public health outcomes (impacts), such as reduced mortality, asthma or lower healthcare costs, to people’s exposure to the concentration of air pollutants. In this typol-ogy we separate air pollution impacts (section4.1.3) from health impacts (section 4.1.4) to improve the usability for policy analysis. The reason for this is that researchers may find it useful to be able to easily identify papers that have not estimated health benefits but have estimated pollution as the basis of further work either calculating the health benefits or calculating non-health co-benefits of reduced air pollution.
Some research indicates that even small increases in air pollution can lead to health costs. For example, one study focused on and conducted in the United States assessed in monetary terms the health co-benefits of reducing CO2 emissions in transport, buildings and power sectors. Their findings indicated that reduced exposure to PM2.5would reduce healthcare costs from $6−$30 billion depending on specific activities in the year 2020 (Balbuset al2014). This estimation required linking air pollution impacts to health outcomes and healthcare costs.
Other studies included in the health impacts cat-egory report results in terms of improved health outcomes. For example, Crawford-Brownet al(2012) estimated that the ozone and particulate matter (PM)
reductions associated with climate change mitigation policies in Mexico would reduce mortality by around 3000 lives and 417 000 non-fatal diseases of cases per year by 2020. Bailiset al(2005) studied the mortal-ity impacts and GHG emissions caused by household energy use in Africa. They found that gradual transi-tions to charcoal and petroleum fuels from wood would delay 1.0 million and 1.3 million deaths by the year 2030.
Finally, other studies focused on the health impact co-benefits of reducing non-CO2GHG emissions. For example, Anenberg et al(2012) used concentration-response functions to estimate worldwide air quality and health impact co-benefits of policy measures con-trolling methane and black carbon.
Figure6shows in schematic form the relationship between the different outcomes reported by different papers and the classification of papers into the ‘air pollution impacts’and‘health impacts’co-benefit cat-egories. The figure shows that GHG mitigation policies can result in the reduction of air pollution. Data on reduced air pollution can be used through air dispersion models, for instance, to estimate ambient concentra-tions of air pollution. Concentration-response models can then be used to translate ambient concentra-tions of air pollution (included in the air pollution impact co-benefit) to estimate health impacts, such as avoided premature mortality. Some research then uses increased mortality and prevalence of non-fatal dis-eases outcomes to estimate health-related economic costs through approaches such as willingness to pay and quality-adjusted life year. Both the health effects, such as premature mortality, and health-related eco-nomic assessments are included in the health impact co-benefit.
4.1.5. Resource efficiency impacts
The resource efficiency impact includes energy effi-ciency, solid waste recycling, and resource/material use impacts.
Research has indicated that GHG mitigation poli-cies can often lead to improved energy efficiency and increased resource utilization. For example, Garbuzova and Madlener (2012) concluded that GHG mitiga-tion policies in Russia would contribute to increasing investments into equipment modernization in the Rus-sian energy industry. As an example of research on resource efficiency impacts beyond energy efficiency, Kurniawanet al(2013) showed that the adoption of the Takakura home composting (THC) method in two cities (Surabaya and Kitakyushu) cooperatively resulted in reductions in GHG emission reductions and reduced municipal solid waste disposal volumes.
4.1.6. Conflict and disaster resilience impacts
GHG emission reductions have also been studied in terms of their ability to provide conflict and disaster resilience or to exacerbate conflicts and disaster vul-nerability. For example, Huettner (2012) argued that
although the REDD+ program is expected to pro-mote poverty alleviation, the marginalization of some local land users could lead to conflicts for land use if the policies are not well designed. Hsianget al(2013) indicated that human conflict can be significantly influ-enced by climatic events, such as more extreme rainfall or warmer temperatures, which means that climate change mitigation could serve to reduce future inter-personal violence and intergroup conflict. O’Loughlin et al(2012) also examined the relationship between conflict risk and climate variability in East Africa during the period 1990–2009 and concluded that the precipita-tion and temperature effects are statistically significant. Other work has indicated that GHG mitigation may also have impacts on our ability to manage the adverse impacts of climate change on geophysical, biological and socio-economic systems (IPCC2007). In other words, some research has investigated the extent to which some GHG mitigation policies may be able to also improve climate adaptation. For example, Rahn et al(2014) investigated the threat that climate change imposed to coffee production and the livelihood of farmers in developing countries and concluded, using interviews and farm visits, that afforestation of degraded areas can produce the highest synergies between climate mitigation and adaptation. Lascoet al (2014) reviewed different studies on how small land-holders adapt to climate risks in Asia and Africa and the impact of such adaptation measures on carbon sequestration. They concluded that compelling syner-gies between climate adaptation and mitigation can be obtained through agroforestry systems.
4.1.7. Distributional impacts
Energy access, energy poverty, poverty alleviation, social justice and equity are all included in the dis-tributional impacts co-benefit. Casillas and Kammen (2012) argue that low-income people who depend on agriculture and weather patterns to earn a living will be most vulnerable to climate change impacts, and equity should be a central consideration for GHG mitigation strategies. Another example of research in this space is the work of Wanget al(2016) indicating that some cli-mate change mitigation measures, such as carbon taxes, can make lower income groups being more affected if the tax revenue is not well used. Weber and Matthews (2008) linked American household consumption to their global carbon footprint and also indicated that climate mitigation policies such as carbon tax will have important impacts on people’s income distributions.
4.1.8–4.1.10. Technological innovation, food security and energy security impacts
Other co-benefits of climate change mitigation efforts include technological innovation, food security, and energy security.
Developing countries, for example, can benefit from the spillovers of developing, adopting or adapting low carbon technologies as a result of their climate
change mitigation efforts, which have already ben-efitted from the effects of policies in industrialized countries (IPCC2007). To achieve the goal of low-carbon power generation, some key determinants of upgrading wind power deployment in China are identified and thereby stimulating China’s technology innovation in wind industry (Li2010).
In the space of food security impacts, some research has found that more effective land use under the REDD+program, especially in impoverished areas, can help improve food security (Palmet al 2010). Other research has focused on the energy security impacts of GHG mitigation in terms of the ability of particu-lar policies not to reduce the dependence on external sources of energy but on the increased energy secu-rity that comes from a more resilient and diversified energy portfolio through low-carbon technologies and energy-efficiency improvements can help to realize the energy security goal for individual countries and regions (McCollumet al2013).
Before moving on describing the typology of GHG mitigation sectors, it is important to highlight that some papers address more than one co-benefit, one sector, or one continent. In these situations, the papers were included in both categories.
4.2. Climate change mitigation sectors
The climate change mitigation sectors are categorized into the following eight types: the AFOLU, electricity, residential, transport, governmental, industry, marine and building sector.
The agriculture and transport sectors are the most frequently mentioned in the analysis of the key-words in the co-benefits publications. Publications with
‘agriculture’as one of their keywords are often related to the AFOLU sector, which contributes to about 25% of anthropogenic GHG emissions globally (Bustamante et al2014). The transport sector is also an important source for GHG emissions globally.
As mentioned before, the AFOLU sector refers to agriculture, forestry and other land use sector. The elec-tricity sector includes power and energy sector. The residential sector includes heating, cooking, lighting, refrigeration, air conditioning, and using other appli-ances. The governmental sector contributes to GHG mitigation from the perspective of government. The industry sector includes sectors such as steel, cement and manufacturing sector. The marine sector includes fisheries and other marine related activities such as port investments, tourism, ocean iron fertilization, and marine shipping. The building sector includes com-mercial and residential buildings.
4.3. Geographic level
Publications are categorized in terms of their analysis according to the following four types of geographic scope: national, international, regional and city level. papers classified into the national level of analysis are studies that are focused on the context and co-benefits
that apply to one country at a national level, without breaking down information at the regional level within that country.
Regional level papers are those that conduct anal-ysis of a region within a country (analanal-ysis that look at
‘regions’defined by multiple countries are included in either the international or global category, as described below).
City level papers are those that look at one or several cities in either one country or various countries. And international level papers are those that incorporate analysis that include two or more countries, with a large fraction (70.0%) of them being analysis that are global—that look at countries around the world.
4.4. Geographic focus
In addition to providing insights about the geographic scope of the body of research on co-benefits, we also classified papers into the continent that was the main subject of their work: Europe, Asia, North America, Oceania, Africa and South America.
Some of the international level studies covered countries that were in more than one continent and, in some cases, we assigned the paper to the continents covered. However, in some cases, the international level studies covered the whole world. In such cases studies were classified as‘Global’in figure8.
Before presenting the results of applying the typol-ogy, we will summarize the geographic level results from the keywords analysis. The most frequently stud-ied countries in this research are China and India, which is not very surprising given that China and India are the two biggest developing countries in Asia, and the devel-opment of these two countries will play a major role in the world’s ability to address the challenge of climate change.
4.5. Method classification
We classify the 1554 papers from the systematic review according to the main type of research method used. We group research methods (and thus papers) into three high-level categories: science and engi-neering methods, economic methods, social science methods, and other methods. Science and engineer-ing methods include integrated assessment models (which, in contrast to optimization models, include models of the climate), optimization models (which include linear dynamic programming models, Markov model), simulation models (mainly agent based mod-els and system dynamics modmod-els), life cycle assessment (LCA), concentration-response models, multi-criteria assessment, air dispersion models, and experimen-tal approaches (conducting a scientific experiment). We divide economic methods into regression mod-els, general equilibrium modmod-els, cost-benefit analysis, input-output models, partial equilibrium models and decomposition models. Social science methods include qualitative case study, literature review, surveys and interviews.
5. Discussion
We now summarize the insights that emerge from analyzing and visualizing the subset of 1554 papers on co-benefits according to the typology presented in section4. We organize results presenting different combinations of the dimensions in table1.
5.1. Research on particular co-benefits in different mitigation sectors
Figure 6 shows the correspondence between papers that cover ten different types of co-benefits with eight types of climate mitigation sectors. Some papers cov-ered more than one type of co-benefits or sectors, and all types are counted in this study (this means that a paper will appear twice if it was focused on two co-benefits from one mitigation sector, for example). The ecosystem impact benefit type accounts for 19.1% of all papers, representing the type of co-benefit that was studied most widely, as measured by paper counts. The second co-benefit is economic activity, with 17.6%. Food security is the co-benefit type accounting for the smaller percentage (3.4%) of the papers reviewed. If air pollution impacts and health impacts are com-bined together, they constitute the largest proportion of the co-benefit papers (24.5%) instead of ecosystem impact.
The climate mitigation sector that has been the sub-ject of most research is the AFOLU sector (31.6%), while the co-benefits of mitigation in the buildings sec-tor has been the subject of the smallest percentage of publications (1.4%).
As we discuss below and is readily observable in figure6, the analysis of different types of co-benefits is not equally-distributed across the mitigation sectors. The size of the research effort on a particular co-benefit from mitigation in a particular sector is denoted by the width of the flows going from the first to the second column in figure7. The clearest example of that one would expect an uneven distribution of effort is that the co-benefit that has been the subject of most research, ecosystem impacts, is mostly analyzed as it applies to the AFOLU sector, since the AFOLU sector is more directly tied to ecosystems.
The key insight from the analysis in figure6, how-ever, is providing a sense of the co-benefits from particular mitigation sectors that have been more vs. less broadly studied. To some extent, having more papers in one type of co-benefit or for China is a function of how big the‘payoff’can be. However, to mobilize the public and policy makers to ramp up their GHG mitigation efforts it would be beneficial to have information on particular co-benefits and sectors in particular places even if, compared to the health cost of air pollution in China, their absolute value may be significantly smaller.
The discussion here and what follows identifies where there are opportunities to add to the evidence base by identifying and quantifying additional benefits
from mitigation activities in particular sectors, which could be useful for further mobilizing policy action.
5.1.1. Areas of significant research focus
We now discuss the combination of co-benefit types and mitigation sectors that have been the subject of the largest research effort so far.
The analysis of co-benefits in the form of ecosys-tem impacts in the AFOLU sector has been the focus of most research efforts, with a total of 222 papers. The second area of focus has been the assess-ment of economic activity in the AFOLU (92 papers) and electricity (87 papers) sectors. The third area of focus has been on co-benefits in the form of resource efficiency have a large focus in electricity (74) sector.
A lower level of activity has focused on: (a) air pollution on the electricity (60 papers) and transport (41 papers) sectors; (b) health impacts in the transport (54 papers), electricity (49 papers) and residential (42 papers) sectors; and (b) resource efficiency co-benefits from mitigation in the AFOLU (31 papers) sector. It was somewhat surprising that there has not been too much work on resource efficiency as a co-benefit of mitigation in the industry sector, given work on the circular economy.
Co-benefits of conflict and disaster resilience were often studied in AFOLU (60 papers) and residential sectors (25 papers), with distributional impacts being mainly studied as applied to the electricity (24 papers), residential (24 papers), and AFOLU (22 papers) sec-tors. Food security was substantially studied in AFOLU sector (43 papers) and energy security was primarily studied in electricity sector (37 papers).
5.1.2. Emerging areas or areas with little research The emerging areas or areas with little research are defined by those areas that are covered by fewer than five papers, 65.5% of which are emerging papers pub-lished since 2013. Five papers is, of course, an arbitrary number of papers. As can be seen in figure6, however, there are clearly some research areas that are the sub-ject of much research and others in which research is much less frequent. This means that varying the threshold of the number of papers does not signifi-cantly affect our discussion of the emerging areas of research.
We found that the co-benefits of ecosystem impacts were studied the least as they applied to the transport sector (four papers). There were only three papers in each of the following combinations of co-benefits and mitigation sectors: economic activity in the marine sec-tor; health impact in the building secsec-tor; distributional impact in the industry sector; and conflict and dis-aster resilience in the building sector. The study of economic activity in the building sector, and conflict and disaster resilience in the transport sector are both covered by two papers. There is only one paper in the study of health impact, distributional impact and air
pollutants in marine sector. Conflict and disaster resilience is not studied in the industry sector yet (zero papers). Co-benefits in the form of technological inno-vation were less frequent as they applied to the AFOLU (three papers) and residential (two papers) sectors. This is perhaps a reflection of the general (perhaps wrong) perception that there is not much new in terms of technology that can be done in both sectors.
The study of the food security co-benefit was scant as it applies to the residential (three papers), marine (two papers), electricity (two papers), industry (two papers), transport (one paper) and governmental (one paper) sectors. In turn, the study of energy security in the residential (three papers), building (two papers) and governmental sectors (two papers) is also very limited.
5.2. Research of particular co-benefits at different geographic levels
As shown in table1, and implemented in figure7, ten types of co-benefits and four types of geo-levels were identified and used to classify the database of co-benefit papers. Most of the co-benefit studies had an interna-tional level scope in their analysis, making up 37.5% of all the papers. Studies at the national level (namely, pro-viding results of benefits that were studied in more than one country) made up 35.4% of the papers. 18.3% of the papers related to studies at the regional (sub-national) level. Finally, only 8.8% of the studies focused on co-benefits at a city level. We now discuss to what extent different types of co-benefits have been studied at these different levels.
5.2.1. Areas of significant research focus
Ecosystem impacts were studied most frequently at the international level (121 papers), national level (92 papers) and regional level (84 papers), while the study of co-benefits in the form of economic activity was primarily conducted at a national level (112 papers), international level (94 papers) and regional level (63 papers). The study of health impact co-benefits was focused on analysis at the international level (90 papers) and national level (68 papers). The focus on national-level analysis was also the key focus of the analysis of air pollutants (71 papers) and resource efficiency (64 papers).
5.2.2. Emerging areas or areas with little research The emerging areas or areas with little research are defined by papers covering fewer than ten papers of a particular co-benefit in a particular geographic level. The emerging papers since 2013 accounted for 93.9% of the above papers. Co-benefits which were less studied from a city level perspec-tive include distributional impacts (seven papers), energy security (seven papers), technological inno-vation (two papers) and food security (one paper). Technological innovation (six papers) and food
security (five papers) co-benefits were also both less studied at a regional level.
5.3. Research on different types of co-benefit by con-tinent
As shown in table1, and implemented in figure8, ten types of co-benefits and six types of continents were identified and used to categorize the database of papers on co-benefits. Most of the co-benefits were studied globally or in multiple continents (namely, provid-ing results of benefits internationally without makprovid-ing explicit what national and continental level benefits are) (30.5%), with the European continent being the one that is the subject of most research on co-benefits (20.9%). Co-benefits papers with a focus on Europe are followed by papers studying co-benefits in Asia (18.5%), and North America (10.7%). The continents that have been the subject of less research on co-benefit have been South America (7.8%), Oceania (6.0%) and Africa (5.5%).
5.3.1. Areas of significant research focus
Co-benefits of ecosystem impacts were primarily stud-ied papers focused on multiple continents (96 papers), on Europe (71 papers), and on Oceania (35 papers). The study of co-benefits in the form of economic activ-ity was mainly focused on papers covering multiple continents (81 papers), on Europe (54 papers) and on Asia (49 papers). Health impacts were mainly studied in papers evaluating multiple continents (81 papers) and Europe (44 papers), while air pollutants were most frequently studied in Asia (69 papers). Resource effi-ciency benefits were mostly covered by papers focused on Europe (45 papers), multiple continents (40 papers) and North America (30 papers).
5.3.2. Emerging areas or areas with little research The study of a particular co-benefit in a particular con-tinent was defined as emerging or with little research when no more than five papers focused on that space. The emerging papers published since 2013 accounted for 69.7% of these papers. Health impacts in South America and Africa have only been the subject of nine and three papers. Air pollution co-benefits were the focus of four papers on Africa and zero papers on Oceania.
Given that conflict and disaster resilience, resource efficiency, technological innovation, and food secu-rity were not as widely studied as other co-benefits, it is not surprising that there is little research on these co-benefits in the continents that have less research capacity. Conflict and disaster resilience co-benefits in South America were only studied in eight papers. Resource efficiency co-benefits in South America and Africa were only covered by six and three papers. The study of technological innovation on Africa (zero papers), Oceania (three papers) North America (three papers) and South America (three papers) was the sub-ject of a small research effort. And, surprisingly, food