(will be inserted by the editor)
An Evolutionary Strategy with Machine Learning for
Learning to Rank in Information Retrieval
O. Ibrahim · D. Landa-Silva
Received: date / Accepted: date
Abstract Learning to Rank (LTR) is one of the problems in Information Retrieval (IR) that nowadays attracts attention from researchers. The LTR problem refers to ranking the re-trieved documents for users in search engines, question answering and product recommenda-tion systems. There is a number of LTR ap-proaches based on machine learning and com-putational intelligence techniques. Most exist-ing LTR methods have limitations, like beexist-ing too slow or not being very effective or requir-ing large computer memory to operate. This paper proposes a LTR method that combines a (1+1)-Evolutionary Strategy with machine learning. Three variants of the method are in-vestigated: ES-Rank, IESR-Rank and IESVM-Rank. They differ on the mechanism to ini-tialize the chromosome for the evolutionary process. ES-Rank simply sets all genes in the
Osman Ali Sadek Ibrahim School of Computer Science ASAP Research Group
The University of Nottingham, UK CS. Dept., Minia University, Egypt E-mail: [email protected]
Dario Landa-Silva
School of Computer Science ASAP Research Group
The University of Nottingham, UK E-mail: [email protected]
initial chromosome to the same value. IESR-Rank uses linear regression and IESVM-IESR-Rank uses support vector machine for the initializa-tion process. Experimental results from com-paring the proposed method to fourteen other approaches from the literature show that IESR-Rank achieves the overall best performance. Ten problem instances are used here, obtained from four datasets: MSLR-WEB10K, LETOR 3 and LETOR 4. Performance is measured at the top-10 query-document pairs retrieved, us-ing five metrics: Mean Average Precision (MAP), Root Mean Square Error (RMSE), Precision (P@10), Reciprocal Rank (RR@10) and Nor-malized Discounted Cumulative Gain (NDCG@10). The contribution of this paper is an effective and efficient LTR method combining a list-wise evolutionary technique with point-list-wise and pair-wise machine learning techniques.
Keywords Learning to Rank · Evolution
Strategy ·Linear Regression·Support Vector
Machine
1 Introduction
early IR research, unsupervised scoring meth-ods such as TF-IDF, Okapi-BM25 and
lan-guage models among others were used (
Man-ning et al.,2008). Using only one scoring method in IR systems is not very efficient. Moreover, the accuracy of results produced by learning models such as Okapi-BM25 and language mod-els is dependent on the relevance judgment (Tonon et al., 2015; Urbano, 2016; Ibrahim and Landa-Silva,2016). This inspires the need for using more than one scoring method for ranking retrieved documents with respect to the user queries. In addition, it is also impor-tant that other features such as the business importance of the documents on the web and the host server among other desirable features are considered for the ranking of documents. Recently, Qin et. al. proposed a new trend in the research on ranking documents by
produc-ing the LETOR datasets (Qin et al., 2010).
These datasets are distilled benchmarks from search engines and from the well-known TREC conference collections. These benchmarks con-tain more than one scoring weighting scheme as part of the benchmark features. They also contain some other features that indicate the importance of the documents on the web. The documents in these datasets were mapped into fully judged query-document pairs for Learn-ing to Rank (LTR) research problems.
Previous work described an LTR approach called ES-Rank based on an evolutionary strat-egy (Ibrahim and Landa-Silva,2017). The per-formance of that method was competitive when compared to fourteen other approaches from the literature. ES-Rank produced better re-sults but only in about 30% of the problem settings. Further research has resulted in the incorporation of machine learning techniques into ES-Rank as described in this paper. More-over, a more thorough experimental compari-son is conducted here to evaluate the perfor-mance of the proposed method using a larger set of problem instances and five performance metrics.
The intended contribution of this paper is to present an effective and efficient method for
LTR that combines an evolutionary strategy with machine learning techniques. The pro-posed method is an evolutionary strategy that evolves a vector of weights where each weight represents a desirable document feature. Three methods to initialize the vector of weights (chro-mosome) are investigated here: simply setting all weights to zero, initializing with Linear Re-gression and initializing with a Support Vector Machine. In order to assess the performance of the proposed method at top-10 query-document pairs retrieved, the following five metrics are used in a comparative analysis to fourteen state-of-the-art LTR methods from the literature:
Mean Average Precision (MAP), Root Mean Square Error (RMSE),Normalized Discounted Cumulative Gain (NDCG), Reciprocal Rank-ing (RR) and Precision (P) (Liu, 2011; Li,
2014). Experimental results in this paper show
that the proposed method performs very well and that the better initialization technique is
Linear Regression (LR) as it helps to achieve the best overall results. Furthermore, most of the other methods compared consume very long computation time (up to 7 hours) while the proposed method is much faster. Another im-portant feature of the proposed method is that the computer memory required for it to
oper-ate is modest, only in the order of (2×M)
whereM is the number of features in the
train-ing dataset.
The rest of the paper is organized as
fol-lows. Section 2 provides a discussion on the
background of the LTR problem in IR, while
section 3 presents a brief literature review of
related work in this subject. The proposed LTR
method is described in section4. Experimental
results are presented in section 5, while con-clusions and proposed future work are given in Section6.
2 Background
In the context of Information Retrieval (IR), a LTR dataset consists of query-document pairs
Table 1: Query-Document Pairs Representation in Learning to Rank (LTR)
Relevance Label QueryId:id Feature Vector
1 qid:1 1:0.1 2:0.8 4:0.5 ...N:M
0 qid:1 1:0.9 2:0.6 4:0.2 ...N:M
1 qid:1 1:0.1 2:0.8 4:0.5 ...N:M
1 qid:2 1:0.2 2:0.4 4:0.5 ...N:M
0 qid:2 1:0.3 2:0.7 4:0.3 ...N:M
1 qid:3 1:0.4 2:0.3 4:0.5 ...N:M
Fig. 1: Architecture of a Learning to Rank Approach as Discussed in (Liu,2009).
2010). Table 1 shows a representation of
sev-eral query-document pairs. Each pair contains a relevance label indicating the relevance de-gree of the document for each query. In most cases, the relevance labels are binary where 1 means relevant and 0 means irrelevant. There is also a query identifier (id) indicating the corresponding query for each query-document
pair. The feature vector refers toM other
fea-tures such as Term-Weighting Scores (e.g.
TF-IDF, Okapi-BM25 and Language Models (Qin
et al.,2010)), PageRank and Host Server Im-portance, features associated to each query-document pair in the LTR dataset. Each
fea-ture in the Feature Vector has the form
Fea-tureID:FeatureValue, where FeatureValue is the contribution value of this feature in the query-document pair. The dataset itself is
di-vided intoN folds (usually LTR datasets have
5 folds) and each fold contains training, vali-dation and testing sets for the query-document pairs. These folds are useful for examining the behaviour and predictive performance of LTR methods by applying them on test sets differ-ent to the training sets. More details about the organisation of LTR datasets and query-document pairs are given in (Qin et al.,2010;
Qin and Liu,2013).
Recently, LTR as a method based on su-pervised learning, has been widely used in IR to produce ranking functions based on the training datasets. The ranking function is used to rank the retrieved documents in
re-sponse to the user query. Figure 1 shows the
be-ing the input to a computational intelligence or machine learning technique (Li,2014). The ranking model or ranking function is created and then used to rank the search results for the user queries. The ranking model can also be used in the test phase to measure the pre-dictive performance of the ranking algorithm on the test datasets. The resulting ranking sys-tem will produce an ordered list of documents retrieved from the document collection in re-sponse to the search. The next section reviews some of the existing LTR approaches in order to set the context for the method proposed in this paper.
3 Related Work
There are three categories of LTR methods
(Liu, 2009): (1) the point-wise method, (2)
the pair-wise method and (3) the list-wise method. These categories are based on the loss function or fitness function measurements. The point-wise approach views each single object (query-document pair) as the learning instance. Examples of point-wise approach
are Linear Regression (Yan and Su, 2009),
Boosting (Freund et al., 2003), Gradient
Boosted Regression Trees (MART or GBRT) (Friedman, 2001; Mohan et al., 2011) and
Random Forest (RF) (Breiman, 2001). The
pair-wise approach views the pair of objects (two query-document pairs for the same query) as the learning instance. Examples of
the pair-wise approach are RankNET (Burges
et al., 2005) which is based on neural net-works, as well as RankBoost and SVMRank
(Li, 2014) which are based on support vector
machines. The list-wise approach takes the entire list of objects retrieved (the list of query-document pairs for each query) as the learning instance. Examples of the list-wise
approach are ListNET (Cao et al., 2007)
which is based in neural networks, RankGP (Lin et al., 2012; Mick, 2016), Coordinate
Ascent (Metzler and Bruce Croft, 2007),
AdaRank (Xu and Li, 2007) and RankGPES
(Islam,2013).
Although list-wise methods have been shown to perform better regarding accuracy
than point-wise and pair-wise approaches (Cao
et al., 2007), the need to improve the perfor-mance of LTR approaches has motivated re-searchers to propose hybrid methods as well. For example, Sculley proposed an approach (CoRR) combining linear regression (point-wise) with support vector machine (pair-(point-wise) (Sculley,2010). That approach is implemented in the Sofia-ml package and while it executes in reasonable computational time, its perfor-mance in terms of NDCG and MAP is lim-ited. In order to achieve better NDCG, Mo-han et al. proposed a hybrid machine learn-ing approach for initializlearn-ing GBRT uslearn-ing
Ran-dom Forest (Mohan et al., 2011). However,
experiments showed that their approach con-sumes too much run-time compared to other
approaches from the literature (Dang, 2016;
Li, 2014). Two other hybrid approaches are
LambdaRank and LambdaMART which com-bine pair-wise with list-wise methods (Burges,
2010). LambdaRank is based on RankNET
while LambdaMART is the boosted tree from LambdaRank. Both LambdaMART and LambdaRank have shown better performance regarding IR accuracy than the method by Mohan et. al. on the Yahoo! LTR Challenge (Chapelle and Chang,2011). Most of the LTR approaches still have some limitation on the computational run-time or the achieved accu-racy of the predictive results. However, the combination of list-wise and point-wise tech-niques has shown to be promising. Muahmmed and Carman conducted experiments combin-ing list-wise with point-wise Random Forest (Hybrid RF) showing that the their hybrid outperformed other methods both in compu-tational run-time and accuracy.
function) over a number of generations. A preliminary investigation of ES-Rank showed that the method performed well against other fourteen methods from the literature on three datasets and with respect to mean average precision (MAP), normalized discounted cum-mulative gain (NDCG) and computational run-time. For example, the computational run-time of IGBRT (rt-rank package) or
Coordinate Ascent (Ranklib package) on
the MSLR-WEB10K fold was over 9 hours while ES-Rank used just around 30 minutes. However, linear regression was even faster on that dataset using less than 3 minutes. Most of the other methods consumed more than one hour of computation run-time on the MSLR-WEB10K fold. Observing that linear regression, a point-wise technique, was very fast while still achieving reasonable accuracy, motivated the research presented in this paper. The previous paper used two fitness evaluation metrics and three test datasets.
This paper presents improved versions of ES-Rank, called IESR-Rank and
IESVM-Rank, that incorporate machine learning
techniques. Hence, the hybrid LTR methods proposed here combine the list-wise approach of ES-Rank with the point-wise approach of linear regression and the pair-wise approach of support vector machine for even better accuracy and lower computational run-time. This paper also includes a more extensive evaluation of ES-Rank using five evaluation metrics and ten LTR datasets.
4 The Proposed LTR Approach
The proposed LTR methodology uses a (1+1)-Evolutionary Strategy (ES) for evolving the ranking function, due to the proven capability of evolutionary strategies to effectively and efficiently converge towards a better solution (Beyer and Schwefel, 2002). A (1+1)-ES works on a population of size two, the current solution (parent) and the candidate solution
(offspring) which results from mutating the parent. Only if the offspring is at least as good as the parent, it replaces the parent for the next generation, otherwise the offspring is disregarded. A solution or chromosome is a vector of weights all together representing the ranking function being evolved. It is well-known that choosing an appropriate initial solution in evolutionary techniques
is an important issue (Diaz-Gomez and
Hougen, 2007). Three ways to create the initial parent are investigated here. One is to set all weights to the same value of zero, another one uses Linear Regression (LR), the third one uses Support Vector Machine. Experiments later in this paper show that using Linear Regression or Support Vector Machine for parent initialization helps ES-Rank to converge towards better solutions.
Algorithm1outlines the ES-Rank method.
The input is the training set of query-document pairs or feature vectors and the out-put is a linear ranking function. The chromo-some ParentCh is a vector ofM genes, where each gene is a real number representing the importance of the corresponding feature for ranking the document. Steps 1 to 4 initialize the chromosome vector by setting each gene
to a value of 0. The Boolean variable Good
used to indicate whether repeating the muta-tion process from the previous generamuta-tion is
set to FALSE in Step 5. A copy of ParentCh
is made intoOffspringCh in step 6. The
evolu-tion process forM axGenerationsgenerations
(1300 in this paper) starts in Step 7 and ends in Step 24. Steps 8 to 16 show the strategy to control the mutation process by choosing
the number of genes to mutate (R), the actual
genes to mutate and the mutation step. The mutation step is determined using Equation
(1) whereGaussian(0,1)is a random Gaussian
M utated Gene i=Gene i
+Gaussian(0,1)∗exp(Cauchy(0,1)) (1)
The mutation step defined by Equation 1
was chosen based on preliminary experiments in which several ways of combining the Gaus-sian and Cauchy numbers were tried. The com-binations tried involved adding, subtracting and multiplying these numbers. Both random and probabilistic mutation rates were tried in the preliminary experiments. Among the var-ious combinations tried, the one expressed by
Equation1 provided the best performance for
ES-Rank. A mutation process that is success-ful (produces a better offspring) in generation (G−1) is replicated in generationGas shown in Step 9. Otherwise the parameters of the mu-tation process are reset as shown in Steps 11
to 15. Steps 17 to 23 select between the
Par-entChand theOffspringCh according to their fitness function values. Finally, ES-Rank re-turns the ranking function in Step 25, defined by the transpose of the evolved vector of fea-ture weights and the query-document pairs. The computational complexity of this
algo-rithm is Ω(N ∗n∗log(R)), where N is the
number of training query-document pairs,nis
the number of evolving iterations andRis the
number of genes in the chromosome. The link
for ES-Rank library package is:IESRank.zip.
Instead of the simple initialization
pro-cess in steps 1 to 4 of Algorithm 1,
Lin-ear Regression (LR) and Support Vector Ma-chine (SVM-Rank) are used now. That is, the genes in the ParentCh vector take the weight values that result from the least square LR
or SVM-Rank models (Dang,2016; Joachims,
2016a). Incorporating these machine learning techniques into an evolutionary approach is a novel idea within the LTR domain. The rea-son for choosing LR and SVMRank is as well as ES-Rank, they produce linear ranking mod-els, while other techniques produce non-linear ranking models or they have high computa-tional run-time.
Algorithm 1: ES-Rank: Evolutionary Strategy Ranking Approach
Input :A training setφ(q, d) of query-document pairs of feature vectors. Weight Feature VectorW LR=g(wlri) from applying LR or SVM onφ(q, d) set.
Output:A linear ranking functionF(q, d) that assigns a weight to every
query-document pair indicating its relevancy degree.
1 Initialization
2 for(Geni∈P arentCh)do
3 Geni= 0.0 or weight from LR or SVMRank ranking model;
4 end
5 Good=FALSE;
6 Of f springCh=P arentCh;
7 forG= 1toM axGenerationsdo
8 if (Good==TRUE)then
9 Use the same mutation process of generation (G−1) onOf f springChto mutateOf f springCh, that is, mutate the sameRgenes using the same
M utationStep;
10 else
11 Choose number of genes to mutateRat random from 1 toM;
12 forj= 1toRdo
13 Choose at random,Geniin
Of f SpringChfor mutation;
14 MutateGeneiusingM utationStep according to Equation1
15 end
16 end
17 if (Fitness(ParentCh,φ(q, d))
<Fitness(OffspringCh,φ(q, d)))then
18 P arentCh=Of f springCh;
19 Good=TRUE;
20 else
21 Of f springCh=P arentCh;
22 Good=FALSE ;
23 end
24 end
25 returnthe linear ranking function
F(q, d) =P arentChT•φ(q, d) =WT•φ(q, d), that isP arentChat the end of the
M axGenerationscontains the evolved vectorW
ofMfeature weights,T indicates the transpose
In Bagging (Bootstrap Aggregation) meth-ods such as RF, the training dataset is divided into a number of bags. Then, a training rank-ing model is produced for each trainrank-ing sample the average ranking model from all learning ranking models is taken as the general rank-ing model of the RF technique. This method is used to reduce the variance of the learn-ing ranklearn-ing model on the trainlearn-ing dataset and hence reduce the over-fitting on predictive test dataset. However, this averaging method lim-its the increase in performance of the ranking model. On the other hand, random sampling takes sample data from the training dataset for learning the ranking model in each learning it-eration of the machine learning technique and this may cause over-fitting by high variance model representation or under-fitting by high
bias as mentioned in (Brownlee, 2017). This
issue also affects the performance of the rank-ing model. In the followrank-ing subsections, SVM-Rank (LTR with support vector machines) and LR (LTR with linear regression) are described in more detail.
4.1 SVMRank: Support Vector Machine for LTR
Joachims proposed a pairwise approach called SVMRank for LTR based on a Support
Vec-tor Machine (Joachims,2016a). The approach
compares every two query-document pairs in order to rank them in a retrieved query-document pair list. This approach uses the er-ror rate between the actual ranking and the ranking from its model as a loss function. The objective of the SVMRank technique is to min-imise the loss function value between the ac-tual relevance labels and the ranking model labels on the training dataset. This approach produces a linear ranking model of weights. Assume the vector of weights that are adjusted
by the SVMRank technique is−→w. The ranking
model is represented byf−→w(q), where qis the query set of the training data. The ranking
of two documents di anddj that have
query-document pairs Φ(q, di) and Φ(q, dj) can be
represented by:
(di, dj) f−→w(q)⇔ −→w Φ(q, di)>−→w Φ(q, dj) (2)
If the training set contains n queries, the
target of the SVMRank is to find the weight
vector −→w that maximises the number of
ful-filled inequalities in:
(di, dj) r∗1: − →w Φ(q
1, di)>−→w Φ(q1, dj)
...
...
(di, dj) rn∗ :−→w Φ(qn, di)>−→w Φ(qn, dj) (3)
This direct generalisation in Equation (3)
for Equation (2) shows that this problem is a
complex (NP-hard) problem to solve. However, it can be simplified based on the classification problem using SVM. Thus, the optimisation problem of SVMRank can be represented as follows:
minimise: V(−→w ,−→ξ) =1 2
−
→w· −→w+CX ξi,j,k
(4)
subject to:
(di, dj) r1∗:−→w Φ(q1, di)≥ −→w Φ(q1, dj) + 1−ξi,j,1 ...
...
(di, dj) rn∗ :−→w Φ(qn, di)≥ −→w Φ(qn, dj) + 1−ξi,j,n
∀i,∀j and∀k:ξi,j,k≥(5)0
whereCis a constant that adjusts the
mar-gin size against the training error and ξi,j,k is
the slack variable. Thus, the problem is to
min-imise the upper bound of Pξ
i,j,k. This
prob-lem is a convex probprob-lem that has no local op-tima. For clarification, constraints in Equation (5) can be re-arranged as:
− →w(Φ(q
k, di)−Φ(qk, dj))≥1−ξi,j,k, (6)
(Joachims,2016b). However, this package was slower than other LTR techniques. Thus, he later proposed a new library package for
rank-ing called SVMRank (Joachims,2016a).
SVM-Rank is faster because it does not include all query-document pairs of the training set in each learning iteration.
4.2 Linear Regression for LTR
The Linear Regression (LR) technique was introduced in the Ranklib library package (Dang,2016), but there is no paper discussing its comparison to other LTR techniques. The method used in Ranklib is the least square LR technique (Miller, 2006). In this method, the ranking model weight vector is chosen based on minimising the total distance be-tween the ground truth labels of the training query-document pairs and the labels produced by ranking the ranking model. The objective of the ranking model produced by the LR
tech-nique is to minimise loss = 1
N
PN
j=1|yj −
Pn
i=1(wixij)|. In this equation,N is the
num-ber of query-document pairs in the training
set,nis the number of features in each
query-document pairs, wi is the weight for feature
i in the ranking model proposed by LR and
xij is the feature value for feature iin
query-document pair j. Finally, yj is the ground
truth label for query-document pair j. From
our experiments, the LR technique in Ranklib is the fastest approach, but it is not the most efficient one within the Ranklib package.
5 Experimental Study and Evaluation
This section presents a comprehensive exper-imental study comparing the performance of the proposed LTR approach to fourteen other methods both in terms of accuracy and com-putational run-time. Accuracy is measured
us-ing five metrics described in subsection 5.2:
Mean Average Precision (MAP), Normalized Discounted Cumulative Gain (NDCG), Pre-cision (P), Reciprocal Rank (RR) and Root
Mean Square Error (RMSE). In order to as-sess the performance of a method for LTR, benchmark datasets containing training, val-idation and test sets are identified. The LTR approach is first applied to the training set in order to learn a ranking function. Then, the performance of the learned ranking function is assessed using the test set to measure the predictive performance of the LTR algorithm.
5.1 Benchmark Datasets
The benchmark datasets used in the exper-iments of this paper are MSLR-WEB10K,
LETOR 4 (MQ2007 and MQ2008) and
LETOR 3 ( Ohsumed, TD2003, TD2004,
HP2003, HP2004, NP2003 and NP2004) (Qin
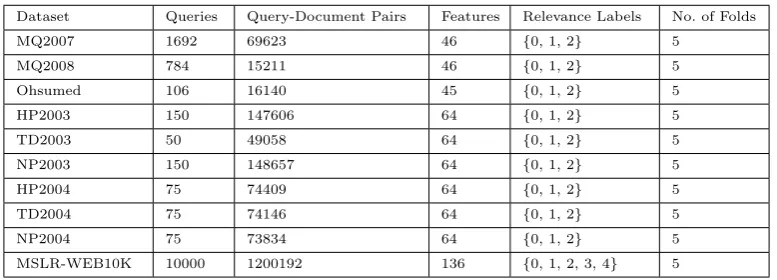
and Liu,2013;Liu,2011;Qin et al.,2010). Ta-ble2outlines the properties of these datasets. The number of query-document pairs and the number of features in the Microsoft Bing Search dataset (MSLR-WEB10K) are much larger than in the LETOR 4 (MQ2007 and MQ2008) or the LETOR 3 (Ohsumed and .Gov) datasets. Each query-document pair contains low-level features such as term frequency and inverse document frequency of the document terms existing in the queries. The low-level features were determined for all document parts (title, anchor, body and whole). There are also high-level features that indicate the similarity matching between the queries and the documents. Furthermore, hybrid features represent the recent research IR models in SIGIR conference papers such as Language Model with Absolute Discounted Smoothing (LMIR.ABS), Language Model with Jelinek-Mercer smoothing (LMIR.JM), Language Model with Bayesian smoothing using Dirichlet priors (LMIR.DIR) and User Click features (Liu,2011;Qin et al.,2010;Qin and Liu,2013).
has 1692. Each query has associated a num-ber of relevant and irrelevant documents, i.e. query-document pairs for each query. The rel-evance label indicates the relrel-evance degrees for the queries with the documents (query-document relationship). In most cases, the rel-evance labels include values of 0 (for irrel-evant), 1 (for partially relevant) and 2 (to-tally relevant). The exception is for the MSLR-WEB10K dataset with values (created by the Bing search engine) from 0 (irrelevant) to 4 (perfectly relevant). The LETOR 3 and LETOR 4 datasets were constructed by sev-eral research groups working in collaboration (Qin and Liu,2013;Liu,2011). To the best of our knowledge, besides the preliminary work
reported in (Ibrahim and Landa-Silva, 2017),
this paper is the first one to conduct a com-prehensive comparison between many LTR ap-proaches considering several accuracy metrics and computational run-time on several very different benchmark datasets.
5.2 Fitness and Evaluation Metrics
The following five accuracy metrics are used in
this study: MAP, NDCG@10, P@10, RR@10
and RMSE (Baeza-Yates and Ribeiro-Neto,
2011; Li,2014). Each of them is used as sep-arate fitness function on the training sets and also as the evaluation metric for the ranking functions on the test sets. Each of these met-rics is described in detail next.
Let d1, d2, ..., dD denote the sorted
docu-ments by decreasing order of their similarity
measure function value, where D represents
the number of retrieved documents. The func-tion r(di) gives the relevance value of a
doc-ument di. It returns 1 if di is relevant, and 0
otherwise. ThePrecision per queryqfor top-D
document retrieved (Pq@D) is defined as
fol-lows:
Pq@D = D
X
i=1
r(di) · D
X
j=1
1
j (7)
The Average Precision per query set Q (AvgP) is the average precision values over all
queries Q. This can be given by the following
equation:
AvgP =
PQ
q=1 Pq@D
Q (8)
TheAvgP value is calculated for a top-D
query-document pairs retrieved. The mean of the average precision values for over all query-document pairs retrieved (MAP) can be given by the following equation:
M AP =
PM
k=1 AvgP
M (9)
Where M is number of AvgP points
ex-isting in the search result. For considering the graded relevance levels in the datasets for LTR techniques evaluationr(dj) returns graded
rel-evance value (not binary relrel-evance value as in
MAP and Pq@D equations) in Equations 10,
11and12for other fitness evaluation metrics.
The Normalized Discounted Cumulative Gain of top-k documents retrieved (NDCG@k) in
Equation10can be calculated by:
N DCG@k= 1
IDCG@k·
k
X
i=1
2r(di)−1 log2(i+ 1)
(10)
where IDCG@k is the ideal (maximum)
discounted cumulative gain of top-k
docu-ments retrieved. The Discounted Cumulative
Gain of top-k documents retrieved (DCG@k)
can be calculated by the following equation:
DCG@k=
k
X
i=1
2r(di)−1 log2(i+ 1)
(11)
If all top-k documents retrieved are
rele-vant, the DCG@k will be equal toIDCG@k.
The Reciprocal Rank at top-K retrieved query-document pairs (RR@K) is as follows:
RR@K=
k
X
i=1 r(di)
Table 2: Properties of the benchmark datasets used in the experimental study.
Dataset Queries Query-Document Pairs Features Relevance Labels No. of Folds
MQ2007 1692 69623 46 {0, 1, 2} 5
MQ2008 784 15211 46 {0, 1, 2} 5
Ohsumed 106 16140 45 {0, 1, 2} 5
HP2003 150 147606 64 {0, 1, 2} 5
TD2003 50 49058 64 {0, 1, 2} 5
NP2003 150 148657 64 {0, 1, 2} 5
HP2004 75 74409 64 {0, 1, 2} 5
TD2004 75 74146 64 {0, 1, 2} 5
NP2004 75 73834 64 {0, 1, 2} 5
MSLR-WEB10K 10000 1200192 136 {0, 1, 2, 3, 4} 5
The Error Rate (Err) is usually used to measure the error of the learning model if it is used on another benchmark different from the training set. It is the subtraction between the training evaluation value to the predictive evaluation value, while the Mean Absolute Er-ror and Root Mean Square ErEr-ror are
calcu-lated by Equations13and14.
M AE= 1
n
n
X
i=1
|Erri| (13)
RM SE=
v u u t
1 n
n
X
i=1
(Erri)2 (14)
where n is the number of benchmark
in-stances (documents) used for evaluating the IR system effectiveness.
Each of the above accuracy metrics seeks to measure the quality of the proposed ranked model and the retrieved search results by this model. P@K is used to measure the number of relevant documents in the top-k documents retrieved. However, this metric does not con-sider the graded relevance levels of each re-trieved document, only if the query-document retrieved is relevant or not. MAP measures the average precision on the whole search re-sults rather than the top-k query-document pairs retrieved. The NDCG@K metric con-siders the graded relevance level of each pair
query-document for the top-k query-document retrieved. The difference between MAP and RR@K is that RR@K considers the impact of the position for each retrieved query-document pair in the search list more than MAP metric. Finally, MAE and RMSE calculate the differ-ence between the relevance labels produced by the ranking model with the query-document pair features against the ground truth rele-vance labels. MAE and RMSE consider the ranking problem as a ranking and classification problem. In this paper, all these metrics are used in the performance comparison to aim for an extensive evaluation of the proposed LTR technique.
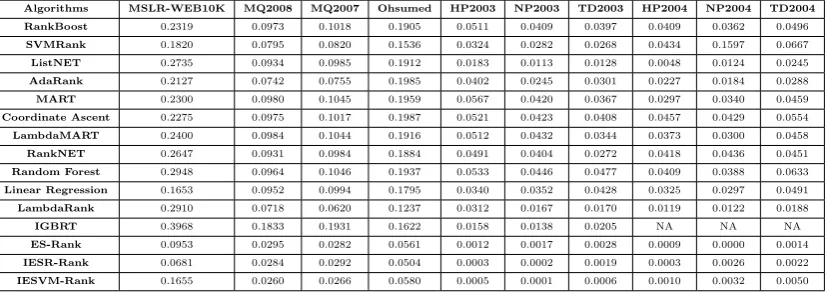
5.3 Results and Discussion
The variants of the proposed LTR method are called ES-Rank (baseline initilization), IESR-Rank (linear regression initialization) and IESVM-Rank (support vector machine initialization). Tables 4, 5, 6, 7 and 8 show the overall results for all the methods tested. The other fourteen methods are implemented
in the packages RankLib (Dang, 2016),
Sofia-ml (Sculley, 2010), SVMRank (Joachims,
2016a), Layered Genetic Programming for LTR (RankGP) (Lin et al., 2007;Mick,2016)
and rt-rank for IGBRT (Mohan et al., 2011).
the limitations of the rt-rank package for ob-taining them. The parameter values used for those other approaches are the default settings in these packages. Those settings produced the shortest computational run time and the lowest memory size requirements for each approach. The experimental results presented are the average scores of five runs on 5-folds cross validation. Each dataset fold consists of a training, a validation and a testing data. Experiments were conducted on a PC with 3.60 GHz Intel (R) core(TM) i7-3820 CPU and 8GB RAM. The implementation was in Java NetBeans under Windows 7 Enterprise Edition.
The results shown in tables4,5,6,7and8
correspond to the predictive values of the av-erage performance of five runs by the tested approaches. As mentioned above, the perfor-mance is measured with the evaluation metrics
MAP,NDCG@10,P@10,RR@10 andRMSE. From these results, it can be seen that IESR-Rank is generally the best approach producing the best performance among all methods in 7 out of 10 average MAP, 6 out of 10 average NDCG@10, 2 out of 10 average P@10, 2 out of 10 RR@10 and 4 out of 10 RMSE. The sec-ond best approach is ES-Rank, producing the best performance in 2 out of 10 average MAP, 2 out of 10 average NDCG@10, 1 out of 10 av-erage P@10, 2 out of 10 avav-erage RR@10 and 2 out of 10 RMSE. Random Forest comes in the third position with 3 out of 10 average P@10 and 3 out of 10 average RR@10, while IESVM-Rank is fourth with 4 out of 10 RMSE. The LambdaMART is fifth with 2 out of 10 aver-age P@10 and 1 out of 10 averaver-age RR@10. The IGBRT and RankBoost are joint in the sixth position with 2 out of 10 average NDCG@10 for IGBRT, while RankBoost has 1 out of 10 average MAP and 1 out of 10 average P@10.
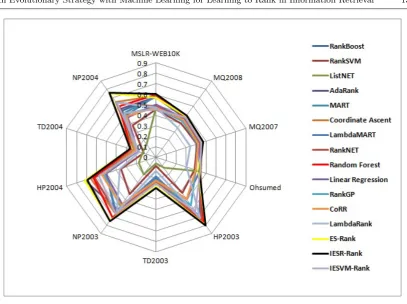
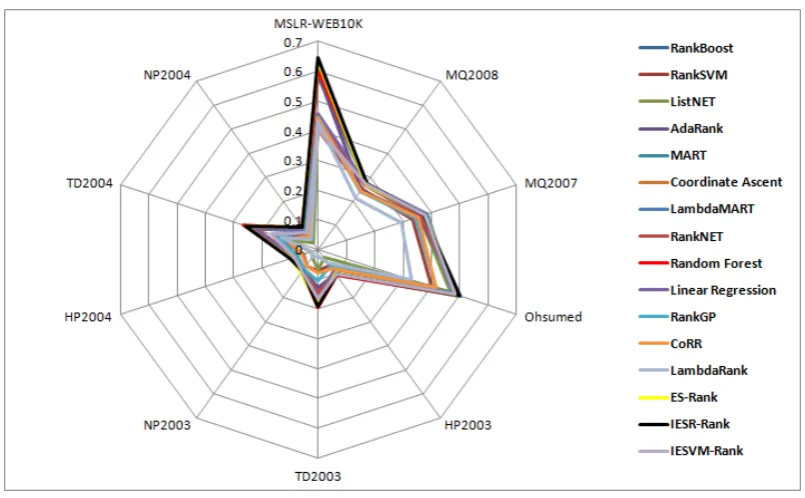
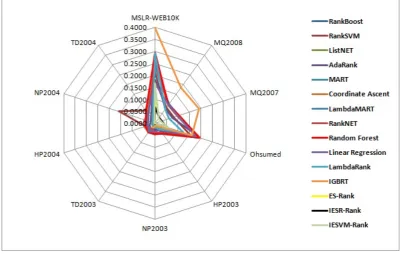
Figures2,3,4,5and6illustrate the radar chart for each fitness evaluation metric results reported in the tables mentioned above. In the first four figures, higher values correspond to better performance, while in the last figure
lower values correspond to better perfor-mance. From these figures it can be observed that the IESR-Rank technique exhibits the overall best performance among all techniques.
The statistical F-significant test of the re-sults is presented in table3. This table shows the null hypothesis P-values of the predictive results of the evaluation fitness metrics on the dataset folds. This F-test measures if there is differentiation between the average results be-tween techniques or not, while its null hypoth-esis assumes that there is no difference be-tween the results obtained by the techniques. If the p-values are small, this indicates that the hypothesis is rejected. The p-value un-der 0.05 indicates that the improvements for IESR-Rank and ES-Rank against the other LTR techniques are significant for distinguish-ing between them and the other techniques.
From table 3, the improvements in the
re-sults on MSLR-WEB10K, MQ2008, MQ2007, NP2003, HP2004 and TD2004 are significant, while the tests on Ohsumed, HP2003, TD2003 and NP2004 are not.
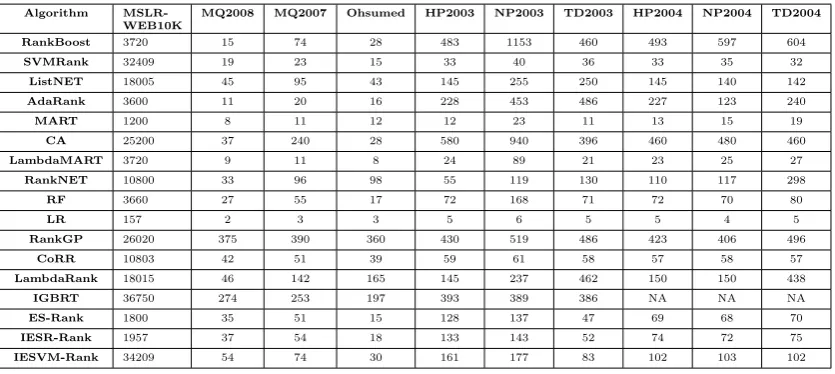
The average computational run-times of the algorithms for each benchmark dataset are
shown in table9. These results show that the
variants of the proposed LTR method are still very efficient in terms of computational run-time. It can be seen that by incorporating linear regression into ES-Rank, the computa-tional run-time of IESR-Rank increases just slightly over ES-Rank, but as discussed above, the accuracy results produced by IESR-Rank are much better.
6 Conclusion and Future Work
This paper presented a new LTR approach that combines a (1+1)-Evolutionary Strategy
with machine learning techniques. Three
Table 3: F-test of the predictive result for the algorithms on the datasets
Dataset MSLR-WEB10K MQ2008 MQ2007 Ohsumed HP2003
P-Value 0.0001926 0.03833 0.04951 0.2649 0.0828
Dataset TD2003 NP2003 HP2004 TD2004 NP2004
[image:12.595.113.524.236.396.2]P-Value 0.1945 0.02432 0.0159 0.01025 0.0564
Table 4: Algorithms Average Performance Applied on 10 Datasets Using MAP Fitness Evaluation Metric
Algorithm MSLR-WEB10K MQ2008 MQ2007 Ohsumed HP2003 TD2003 NP2003 HP2004 TD2004 NP2004
RankBoost 0.5737 0.47722 0.45348 0.44784 0.69838 0.2053 0.64712 0.62586 0.2178 0.55286
SVMRank 0.45736 0.39984 0.40784 0.38316 0.41926 0.0814 0.43316 0.3513 0.1241 0.37814
ListNET 0.47346 0.45256 0.43964 0.4401 0.12414 0.0573 0.20114 0.17426 0.1357 0.15684
AdaRank 0.57118 0.4653 0.45384 0.43656 0.72042 0.2452 0.61816 0.71532 0.1914 0.57006
MART 0.57952 0.47324 0.45894 0.4269 0.74602 0.1877 0.66526 0.4995 0.2041 0.51884
Coordinate Ascent 0.58628 0.48108 0.45976 0.44604 0.7477 0.2371 0.66282 0.6575 0.2245 0.65302
LambdaMART 0.58574 0.4704 0.45522 0.4258 0.7373 0.1805 0.6545 0.50046 0.1874 0.49574
RankNET 0.48584 0.45198 0.44808 0.4351 0.73694 0.2242 0.64972 0.61946 0.1863 0.64738
Random Forest 0.59818 0.4699 0.45866 0.43252 0.76856 0.2847 0.70794 0.62994 0.2541 0.60302
Linear Regression 0.502 0.455 0.42974 0.4333 0.49246 0.217 0.55652 0.5063 0.1886 0.46708
RankGP 0.46732 0.42672 0.41424 0.39914 0.56378 0.2149 0.58136 0.52558 0.2104 0.5142
CoRR 0.47614 0.43946 0.42164 0.39604 0.48888 0.2244 0.56786 0.54346 0.2103 0.4865
LambdaRank 0.47574 0.34836 0.3398 0.30728 0.71664 0.1309 0.64516 0.36672 0.1721 0.64424
ES-Rank 0.570386 0.48324 0.47004 0.42162 0.79902 0.2784 0.74894 0.71794 0.2615 0.75228
IESR-Rank 0.60272 0.49366 0.47312 0.4348 0.8002 0.2914 0.75444 0.69264 0.2584 0.75792
[image:12.595.108.527.439.607.2]IESVM-Rank 0.45742 0.47336 0.4555 0.4432 0.63686 0.2535 0.66258 0.57474 0.1932 0.51956
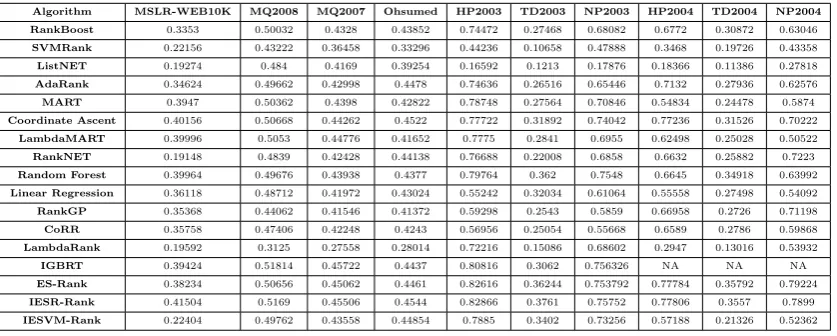
Table 5: Algorithms Average Performance Applied on 10 Datasets Using NDCG@10 Fitness Evaluation Metric
Algorithm MSLR-WEB10K MQ2008 MQ2007 Ohsumed HP2003 TD2003 NP2003 HP2004 TD2004 NP2004
RankBoost 0.3353 0.50032 0.4328 0.43852 0.74472 0.27468 0.68082 0.6772 0.30872 0.63046
SVMRank 0.22156 0.43222 0.36458 0.33296 0.44236 0.10658 0.47888 0.3468 0.19726 0.43358
ListNET 0.19274 0.484 0.4169 0.39254 0.16592 0.1213 0.17876 0.18366 0.11386 0.27818
AdaRank 0.34624 0.49662 0.42998 0.4478 0.74636 0.26516 0.65446 0.7132 0.27936 0.62576
MART 0.3947 0.50362 0.4398 0.42822 0.78748 0.27564 0.70846 0.54834 0.24478 0.5874
Coordinate Ascent 0.40156 0.50668 0.44262 0.4522 0.77722 0.31892 0.74042 0.77236 0.31526 0.70222
LambdaMART 0.39996 0.5053 0.44776 0.41652 0.7775 0.2841 0.6955 0.62498 0.25028 0.50522
RankNET 0.19148 0.4839 0.42428 0.44138 0.76688 0.22008 0.6858 0.6632 0.25882 0.7223
Random Forest 0.39964 0.49676 0.43938 0.4377 0.79764 0.362 0.7548 0.6645 0.34918 0.63992
Linear Regression 0.36118 0.48712 0.41972 0.43024 0.55242 0.32034 0.61064 0.55558 0.27498 0.54092
RankGP 0.35368 0.44062 0.41546 0.41372 0.59298 0.2543 0.5859 0.66958 0.2726 0.71198
CoRR 0.35758 0.47406 0.42248 0.4243 0.56956 0.25054 0.55668 0.6589 0.2786 0.59868
LambdaRank 0.19592 0.3125 0.27558 0.28014 0.72216 0.15086 0.68602 0.2947 0.13016 0.53932
IGBRT 0.39424 0.51814 0.45722 0.4437 0.80816 0.3062 0.756326 NA NA NA
ES-Rank 0.38234 0.50656 0.45062 0.4461 0.82616 0.36244 0.753792 0.77784 0.35792 0.79224
IESR-Rank 0.41504 0.5169 0.45506 0.4544 0.82866 0.3761 0.75752 0.77806 0.3557 0.7899
Fig. 2: Illustrating the MAP performance for all LTR methods on the LETOR datasets.
Table 6: Algorithms Average Performance Applied on 10 Datasets Using P@10 Fitness Evaluation Metric
Algorithm MSLR-WEB10K MQ2008 MQ2007 Ohsumed HP2003 TD2003 NP2003 HP2004 TD2004 NP2004
RankBoost 0.58678 0.27376 0.37164 0.50412 0.10202 0.144 0.088 0.08334 0.23334 0.08534
SVMRank 0.40454 0.2501 0.33194 0.40128 0.06454 0.072 0.06758 0.05334 0.14816 0.05334
ListNET 0.43586 0.267 0.3582 0.46556 0.03334 0.068 0.03298 0.0242 0.112 0.02666
AdaRank 0.59416 0.24738 0.35558 0.49852 0.1 0.128 0.08532 0.08268 0.224 0.08934
MART 0.63118 0.27502 0.37872 0.47554 0.104 0.146 0.084 0.08198 0.23734 0.08136
Coordinate Ascent 0.62682 0.27328 0.37768 0.4831 0.10334 0.158 0.09162 0.09732 0.24932 0.092
LambdaMART 0.64484 0.27504 0.38378 0.47804 0.09598 0.156 0.08696 0.07866 0.22932 0.07468
RankNET 0.44282 0.26686 0.36182 0.49566 0.09734 0.148 0.08732 0.08464 0.21468 0.096
Random Forest 0.60724 0.27466 0.37824 0.49174 0.10536 0.194 0.09362 0.08666 0.26668 0.08798
Linear Regression 0.45732 0.2735 0.3724 0.48078 0.08666 0.18 0.08296 0.08002 0.22532 0.08134
RankGP 0.44742 0.24002 0.34394 0.4155 0.06734 0.10532 0.082 0.07332 0.1426 0.07334
CoRR 0.44112 0.24276 0.35456 0.41784 0.07734 0.08 0.068 0.05866 0.11114 0.05602
LambdaRank 0.43016 0.21268 0.29236 0.32832 0.05602 0.022 0.03248 0.02132 0.13202 0.04346
ES-Rank 0.63446 0.27018 0.37684 0.49358 0.09746 0.184 0.09564 0.09598 0.25732 0.09066
IESR-Rank 0.64338 0.2753 0.37208 0.4976 0.10406 0.19 0.08902 0.09874 0.25884 0.09066
[image:13.595.73.491.447.605.2]Fig. 3: Illustrating the NDCG@10 performance for all LTR methods on the LETOR datasets.
[image:14.595.114.517.411.660.2]Fig. 5: Illustrating the RR@10 performance for all LTR methods on the LETOR datasets.
[image:15.595.79.481.404.658.2]Table 7: Algorithms Average Performance Applied on 10 Datasets Using RR@10 Fitness Evalu-ation Metric
Algorithm MSLR-WEB10K MQ2008 MQ2007 Ohsumed HP2003 TD2003 NP2003 HP2004 TD2004 NP2004
RankBoost 0.77662 0.5331 0.5638 0.72272 0.72594 0.46966 0.64464 0.63994 0.49766 0.55688
SVMRank 0.50512 0.45052 0.48534 0.62528 0.40398 0.16098 0.42384 0.34858 0.35466 0.24216
ListNET 0.58142 0.51342 0.55174 0.66964 0.1545 0.16908 0.10356 0.09628 0.1631 0.2565
AdaRank 0.8025 0.53318 0.54832 0.73908 0.75232 0.41014 0.57586 0.6979 0.50998 0.5683
MART 0.80944 0.5295 0.5691 0.70606 0.79212 0.4297 0.66808 0.56728 0.42806 0.52258
Coordinate Ascent 0.77194 0.53348 0.55776 0.69728 0.7889 0.43212 0.67758 0.70362 0.52898 0.60846
LambdaMART 0.81202 0.52962 0.57028 0.73662 0.77454 0.39706 0.67244 0.56102 0.42394 0.48148
RankNET 0.62222 0.50464 0.55222 0.71924 0.76682 0.42584 0.63974 0.65254 0.4467 0.6554
Random Forest 0.81182 0.53046 0.5661 0.72284 0.7961 0.53858 0.7134 0.62522 0.65104 0.58924
Linear Regression 0.59422 0.51336 0.55044 0.74138 0.51912 0.47096 0.55356 0.50648 0.50404 0.46376
RankGP 0.57304 0.4832 0.5418 0.55918 0.58422 0.30924 0.46534 0.47744 0.47764 0.45378
CoRR 0.58562 0.45536 0.54334 0.54078 0.58076 0.29544 0.46624 0.4637 0.46058 0.4519
LambdaRank 0.58 0.42796 0.5001 0.602 0.75228 0.31154 0.61492 0.36758 0.36956 0.57872
ES-Rank 0.764114 0.53714 0.54626 0.72654 0.80106 0.5239 0.67388 0.72378 0.57316 0.6288
IESR-Rank 0.81912 0.5352 0.56856 0.72458 0.79182 0.50572 0.69022 0.72912 0.5701 0.6293
IESVM-Rank 0.5127 0.51288 0.55996 0.72912 0.7679 0.47424 0.6383 0.43534 0.45852 0.42166
Table 8: Algorithms Performance Applied on 10 Datasets Using RMSE Fitness Evaluation Metric
Algorithms MSLR-WEB10K MQ2008 MQ2007 Ohsumed HP2003 NP2003 TD2003 HP2004 NP2004 TD2004
RankBoost 0.2319 0.0973 0.1018 0.1905 0.0511 0.0409 0.0397 0.0409 0.0362 0.0496
SVMRank 0.1820 0.0795 0.0820 0.1536 0.0324 0.0282 0.0268 0.0434 0.1597 0.0667
ListNET 0.2735 0.0934 0.0985 0.1912 0.0183 0.0113 0.0128 0.0048 0.0124 0.0245
AdaRank 0.2127 0.0742 0.0755 0.1985 0.0402 0.0245 0.0301 0.0227 0.0184 0.0288
MART 0.2300 0.0980 0.1045 0.1959 0.0567 0.0420 0.0367 0.0297 0.0340 0.0459
Coordinate Ascent 0.2275 0.0975 0.1017 0.1987 0.0521 0.0423 0.0408 0.0457 0.0429 0.0554
LambdaMART 0.2400 0.0984 0.1044 0.1916 0.0512 0.0432 0.0344 0.0373 0.0300 0.0458
RankNET 0.2647 0.0931 0.0984 0.1884 0.0491 0.0404 0.0272 0.0418 0.0436 0.0451
Random Forest 0.2948 0.0964 0.1046 0.1937 0.0533 0.0446 0.0477 0.0409 0.0388 0.0633
Linear Regression 0.1653 0.0952 0.0994 0.1795 0.0340 0.0352 0.0428 0.0325 0.0297 0.0491
LambdaRank 0.2910 0.0718 0.0620 0.1237 0.0312 0.0167 0.0170 0.0119 0.0122 0.0188
IGBRT 0.3968 0.1833 0.1931 0.1622 0.0158 0.0138 0.0205 NA NA NA
ES-Rank 0.0953 0.0295 0.0282 0.0561 0.0012 0.0017 0.0028 0.0009 0.0000 0.0014
IESR-Rank 0.0681 0.0284 0.0292 0.0504 0.0003 0.0002 0.0019 0.0003 0.0026 0.0022
IESVM-Rank 0.1655 0.0260 0.0266 0.0580 0.0005 0.0001 0.0006 0.0010 0.0032 0.0050
initial parent. Then, the parent is evolved for a number of generations by the evolu-tionary strategy. The performance of the proposed approach was compared to fourteen other machine learning and computational intelligence approaches from the literature.
The metricsMean Average Precision (MAP),
Normalized Discounted Cumulative Gain (NDCG@10), Precision (P@10), Reciprocal Ranking (RR@10) and Root Mean Square Error (RMSE) were used as fitness functions within the proposed method and also for evaluating the performance of the LTR ap-proaches in the comparison. The benchmark
datasets used here are: MSLR-WEB10K
(Microsoft Bing ten thousand web queries)
dataset, LETOR 4 (MQ2008, MQ2007 TREC Million queries datasets for years 2008 and 2007) and LETOR 3 (Ohsumed and 6 .Gov datasets).
[image:16.595.111.525.326.473.2]Table 9: Average run-times of the five evaluation fitness metrics measured in seconds for the algorithms
Algorithm MSLR-WEB10K
MQ2008 MQ2007 Ohsumed HP2003 NP2003 TD2003 HP2004 NP2004 TD2004
RankBoost 3720 15 74 28 483 1153 460 493 597 604
SVMRank 32409 19 23 15 33 40 36 33 35 32
ListNET 18005 45 95 43 145 255 250 145 140 142
AdaRank 3600 11 20 16 228 453 486 227 123 240
MART 1200 8 11 12 12 23 11 13 15 19
CA 25200 37 240 28 580 940 396 460 480 460
LambdaMART 3720 9 11 8 24 89 21 23 25 27
RankNET 10800 33 96 98 55 119 130 110 117 298
RF 3660 27 55 17 72 168 71 72 70 80
LR 157 2 3 3 5 6 5 5 4 5
RankGP 26020 375 390 360 430 519 486 423 406 496
CoRR 10803 42 51 39 59 61 58 57 58 57
LambdaRank 18015 46 142 165 145 237 462 150 150 438
IGBRT 36750 274 253 197 393 389 386 NA NA NA
ES-Rank 1800 35 51 15 128 137 47 69 68 70
IESR-Rank 1957 37 54 18 133 143 52 74 72 75
IESVM-Rank 34209 54 74 30 161 177 83 102 103 102
initial weights to zero in the initial parent. Random Forest comes in the third posi-tion, IESVM-Rank showed the fourth best
performance followed by LambdaMART.
IGBRT and RankBoost are joint in the sixth position followed by RankBoost. Thus, the
proposed method combining evolutionary
computation with machine learning is a competitive approach to tackle the LTR problem in information retrieval. It is clear from the results in this paper that a hybrid LTR technique that combines optimisation
(an evolutionary strategy) with machine
learning (linear regression and support vector machines) strikes a good balance between
effectiveness and computational efficiency.
Despite the proposed IESR-Rank, ES-Rank and IESVM-Rank performing better overall against the default settings of the other fourteen techniques, it is unclear whether such performance will hold after sophisticated tun-ing of the other techniques. Future research should seek to develop enhanced versions of the proposed approach by investigating other optimisation methods besides evolutionary strategies. For example, other heuristic opti-misation paradigms like simulated annealing, late acceptance hill-climbing, great deluge
and others could be used in combination with linear regression. It is argued that the combination of optimisation and machine learning is a fertile ground for the develop-ment of high-performance LTR methods for information retrieval.
Compliance with ethical standards Conflict of interestThe authors declare that they have no conflict of interest.
References
Ricardo A. Baeza-Yates and Berthier A.
Ribeiro-Neto. Modern Information
Re-trieval - the concepts and technology behind search. Pearson Education Ltd., Harlow, England, 2nd edition edition, 2011.
Hans-George Beyer and Hans-Paul Schwefel. Evolution strategies - A comprehensive
in-troduction. Natural Computing, 1:3–52,
2002.
Leo Breiman. Random forests. Machine
doi: 10.1023/A:1010933404324. URLhttp: //dx.doi.org/10.1023/A:1010933404324.
Jason Brownlee. Overfitting and
un-derfitting with machine learning
algorithms, 2017. URL https:
//machinelearningmastery.com/ overfitting-and-underfitting-with-machine-learning-algorithms/.
Chris Burges, Tal Shaked, Erin Renshaw, Ari Lazier, Matt Deeds, Nicole Hamilton, and Greg Hullender. Learning to rank using gra-dient descent. InProceedings of the 22Nd In-ternational Conference on Machine
Learn-ing, ICML ’05, pages 89–96, New York, NY,
USA, 2005. ACM. ISBN 1-59593-180-5.
doi: 10.1145/1102351.1102363. URL http:
//doi.acm.org/10.1145/1102351.1102363.
Christopher J. C. Burges. From
RankNet to LambdaRank to
Lamb-daMART: An overview. Technical
re-port, Microsoft Research, 2010. URL
http://research.microsoft.com/en-us/ um/people/cburges/tech reports/MSR-TR-2010-82.pdf.
Zhe Cao, Tao Qin, Tie-Yan Liu, Ming-Feng Tsai, and Hang Li. Learning to rank: from pairwise approach to listwise approach. In
Proceedings of the 24th international con-ference on Machine learning, ICML ’07, pages 129–136, New York, NY, USA, 2007.
ACM. ISBN 978-1-59593-793-3. doi:
10.1145/1273496.1273513. URL http://
doi.acm.org/10.1145/1273496.1273513. Olivier Chapelle and Yi Chang. Yahoo!
learn-ing to rank challenge overview. In
Pro-ceedings of the Yahoo! Learning to Rank Challenge, held at ICML 2010, Haifa, Is-rael, June 25, 2010, pages 1–24, 2011. URL http://www.jmlr.org/proceedings/ papers/v14/chapelle11a.html.
Van Dang. RankLib,
http://www.cs.umass.edu/˜vdang/ranklib.html,
2016. URL http://www.cs.umass.edu/
~{}vdang/ranklib.html.
Pedro A Diaz-Gomez and Dean F Hougen. Initial population for genetic algorithms: A
metric approach. InProceedings of the 2007
International Conference on Genetic and Evolutionary Methods GEM, pages 43–49, 2007.
Yoav Freund, Raj Iyer, Robert E. Schapire, and Yoram Singer. An efficient boosting
al-gorithm for combining preferences. Journal
of Machine Learning Research, 4:933–969,
December 2003. ISSN 1532-4435. URL
http://dl.acm.org/citation.cfm?id= 945365.964285.
Jerome H. Friedman. Greedy function
ap-proximation: A gradient boosting machine.
The Annals of Statistics, 29(5):1189–1232,
2001. ISSN 00905364. URL http://
www.jstor.org/stable/2699986.
O. Ali Sadek Ibrahim and D. Landa-Silva. Term frequency with average term occur-rences for textual information retrieval.Soft Computing, 20(8):3045–3061, 2016. ISSN
1433-7479. doi: 10.1007/s00500-015-1935-7.
URLhttp://dx.doi.org/10. 1007/s00500-015-1935-7.
Osman Ali Sadek Ibrahim and Dario
Landa-Silva. Es-rank: Evolution strategy
learn-ing to rank approach. In Proceedings of
the Symposium on Applied Computing, SAC ’17, pages 944–950, New York, NY, USA, 2017. ACM. ISBN 978-1-4503-4486-9. doi:
10.1145/3019612.3019696. URL http://
doi.acm.org/10.1145/3019612.3019696. Mohammad Ashiful Islam. Rankgpes:
Learn-ing to rank for information retrieval usLearn-ing a hybrid genetic programming with evolution-ary strategies, 2013.
Thorsten Joachims. Support vector
machine for ranking, 2016a. URL
https://www.cs.cornell.edu/people/tj/ svm light/svm rank.html#References.
Thorsten Joachims. Svmlight:
Sup-port vector machine for
classifica-tion and ranking, 2016b. URL
http://svmlight.joachims.org/.
Hang Li. Learning to Rank for Information
J. Y. Lin, J. Y. Yeh, and Chao Chung Liu. Learning to rank for information re-trieval using layered multi-population
ge-netic programming. InComputational
Intel-ligence and Cybernetics (CyberneticsCom), 2012 IEEE International Conference on,
pages 45–49, July 2012. doi: 10.1109/
CyberneticsCom.2012.6381614.
Jung-Yi Lin, Hao-Ren Ke, Been-Chian Chien, and Wei-Pang Yang. Designing a classifier by a layered multi-population genetic
pro-gramming approach. Pattern Recognition,
40(8):2211–2225, 2007.
Tie-Yan Liu. Learning to rank for information
retrieval.Foundation Trends of Information
Retrieval, 3(3):225–331, March 2009. ISSN
1554-0669. doi: 10.1561/1500000016.
Tie-Yan Liu. Learning to Rank for
In-formation Retrieval, chapter The LETOR
Datasets, pages 133–143. Springer Berlin
Heidelberg, Berlin, Heidelberg, 2011. ISBN
978-3-642-14267-3. doi: 10.
1007/978-3-642-14267-3 10. URL http://dx.doi.org/
10.1007/978-3-642-14267-3 10.
Christopher D. Manning, Prabhakar
Ragha-van, and Hinrich Sch¨utze. Introduction to
Information Retrieval. Cambridge Univer-sity Press, New York, NY, USA, 2008. ISBN 0521865719, 9780521865715.
Donald Metzler and W. Bruce Croft.
Lin-ear feature-based models for information
retrieval. Information Retrieval, 10(3):
257–274, 2007. ISSN 1573-7659. doi:
10.1007/s10791-006-9019-z. URL http://
dx.doi.org/10.1007/s10791-006-9019-z.
Jung-Yi Lin Mick, 2016. URL http:
//people.cs.nctu.edu.tw/~jylin/lagep/
lagep.html.
Steven J. Miller. The method of
least squares, 2006. URL http:
//citeseerx.ist.psu.edu/viewdoc/ summary?doi=10.1.1.710.4069.
A. Mohan, Z. Chen, and K.Q. Weinberger. Web-search ranking with initialized
gradi-ent boosted regression trees. In Journal of
Machine Learning Research, Workshop and Conference Proceedings, volume 14, pages
77–89, 2011.
Tao Qin and Tie-Yan Liu.
Introduc-ing LETOR 4.0 datasets. CoRR,
abs/1306.2597, 2013. URL http:
//arxiv.org/abs/1306.2597.
Tao Qin, Tie-Yan Liu, Jun Xu, and Hang Li. Letor: A benchmark collection for research on learning to rank for information retrieval.
Information Retrieval, 13(4):346–374, 2010.
ISSN 1573-7659. doi: 10.
1007/s10791-009-9123-y. URLhttp://dx.doi.org/10.1007/
s10791-009-9123-y.
D. Sculley. Combined regression and ranking. In Proceedings of the 16th ACM SIGKDD International Conference on Knowledge Discovery and Data Mining, KDD ’10, pages 979–988, New York, NY, USA, 2010.
ACM. ISBN 978-1-4503-0055-1. doi:
10.1145/1835804.1835928. URL http://
doi.acm.org/10.1145/1835804.1835928. Alberto Tonon, Gianluca Demartini, and
Philippe Cudr-Mauroux. Pooling-based con-tinuous evaluation of information retrieval
systems. Information Retrieval Journal, 18
(5):445–472, 2015. ISSN 1386-4564. doi:
10.1007/s10791-015-9266-y.
Juli´an Urbano. Test collection reliability:
a study of bias and robustness to sta-tistical assumptions via stochastic
simula-tion. Information Retrieval Journal, 19
(3):313–350, 2016. ISSN 1573-7659. doi:
10.1007/s10791-015-9274-y. URL http://
dx.doi.org/10.1007/s10791-015-9274-y. Jun Xu and Hang Li. Adarank: A boosting
algorithm for information retrieval. In
Pro-ceedings of the 30th Annual International ACM SIGIR Conference on Research and Development in Information Retrieval, SI-GIR ’07, pages 391–398, New York, NY, USA, 2007. ACM. ISBN 978-1-59593-597-7.
doi: 10.1145/1277741.1277809. URL http:
//doi.acm.org/10.1145/1277741.1277809.
Xin Yan and Xiao Gang Su. Linear