A new macro-element model encapsulating the dynamic
moment-rotation behaviour of raft foundations
Author 1
Dr C.M. Heron, Assistant Professor
Department of Civil Engineering, University of Nottingham
Author 2
Dr S.K. Haigh, Senior Lecturer
Department of Engineering, University of Cambridge
Author 3
Professor S.P.G. Madabhushi, Professor
Department of Engineering, University of Cambridge
Abstract
The interaction of shallow foundations with the underlying soil during dynamic loading can have both positive and negative effects on the behaviour of the superstructure. Although the negative impacts are generally considered within design codes, seldom is design performed in such a way as to maximise the potential beneficial characteristics. This is, in part due to the complexity of
modelling the soil-structure interaction. Using the data from dynamic centrifuge testing of raft foundations on dry sand, a simple moment-rotation macro-element model has been developed which has been calibrated and validated against the experimental data. For the prototype tested, the model is capable of accurately predicting the underlying moment-rotation backbone shape and energy dissipation during cyclic loading. Utilising this model within a finite element model of the structure could potentially allow a coupled analysis of the full soil-foundation-structure system’s seismic response in a simplified manner compared to other methods proposed in literature. This permits the beneficial soil-structure interaction characteristics, such as the dissipation of seismic energy, to be reliably included in the design process resulting in more efficient, cost-effective and safe designs.
Nomenclature
G shear modulus
G0 small strain shear modulus
M moment
MS model parameter – moment scalar
R model parameter - shear stress scalar
RS model parameter – rotation scalar
S model parameter - shear strain scalar
a dimensionless parameter from Oztoprak and Bolton (2013)
b half footing width
f model parameter -vertical to shear stress ratio
g acceleration due to gravity (taken to be 9.81ms2)
p’ effective mean normal stress
r subgrade reaction modulus
β distance from centre of footing to uplift point
γ shear strain
γe strain parameter from Oztoprak and Bolton (2013)
γr strain parameter from Oztoprak and Bolton (2013)
γrep representative shear strain level within the soil deformation mechanism
δθ change in rotation
δM change in moment
θ rotation
σn nominal bearing pressure
τ shear stress
τrep representative shear stress level within the soil deformation mechanism
Introduction
Performance based seismic design, whereby a system is designed based on deformation limits rather than load limits, offers the potential for safe economical design in seismic engineering. Permitting a certain amount of ductility in a system minimises the cost of the structure when designing for extreme but infrequent load cases such as earthquakes. This in turn allows for a more efficient design and construction procedure. With the ability to accurately model the behaviour of
manufactured structural elements, this design philosophy has to date been utilised extensively in structural designs. Examples of such a method are the introduction of ductility in the design of beams and columns of a steel-frame structure or the use of unbonded tendons to give ductile behaviour of beam-column joints (Holden et al., 2003; Ou et al., 2010; Pampanin, 2005; Smith et al., 2011). With designs being led by structural engineers combined with a perceived or real lack of ability to characterise the seismic response of the soil, ductility has not been widely included into the design of the soil-foundation system. However, recent research (Gajan and Kutter, 2008;
Anastasopoulos et al., 2010; Gelagoti et al., 2012; Pender, 2010) has increasingly shown the potential merits of doing so. Utilising ductility within the underlying ground can potentially reduce the cost of the overall system and can provide significant levels of seismic protection. In order to optimise designs and provide quantitative assessments of the level of seismic protection, a comprehensive model of the soil-foundation interaction behaviour is required.
Previous researchers have investigated different methods of incorporating these beneficial characteristics into the design process. Ultimately all methods have to be incorporated into a
numerical model of the overall soil-foundation-structure system. This can be done either by detailed numerical simulations of the soil behaviour (Abate et al., 2010; Gelagoti et al., 2012), by equivalent simplified springs (Wotherspoon and Pender, 2010; Anastasopoulos and Kontoroupi, 2014;
paper. The use of a macro-element simplifies the modelling process by reducing the large number of elements and linear relationships (such as the elasto-plastic behaviour of the soil and non-elastic soil-structure interface movements) down to a single element which combines these nonlinearities into one constitutive law. In order for such a model to be accepted for use in design, it needs to be fully validated against physical modelling and/or field data. Despite soil-foundation interaction being capable of providing seismic protection to a variety of foundation types, this research focuses on shallow raft foundations located on dry sand beds.
Paolucci et al. (2007) made use of data from 1-g pseudo-dynamic tests and tests conducted on a large 1-g shaking table to compare against predictions from a macro-element model. The variations between the physical model and numerical analysis results are similar in both cases in that the numerical analysis over-predicts permanent rotations and under-predicts settlements compared to the physical model results. The authors note that the error in the numerical analysis increases with the magnitude of excitation. The results presented in their paper do, however, have one of the best correlations between experimental and numerical data presented in the literature.
Similarly, Grange et al. (2009) present a macro-element model which is validated against data from a large scale 1-g shaking table test. In this case, the model predicted the rotations of the structure relatively accurately; however it over-predicted settlement by approximately 50%. This is contrary to the results presented by Paolucci et al. (2007) where the model under-predicted the settlements.
The model presented by Gajan & Kutter (2009) tracks the geometry of the soil-foundation interface and determines the loading on the foundation, thus the moment, rotation and settlement are evaluated simultaneously. Six user-defined parameters are required as well as nine nonuser-defined parameters, these having been back-calibrated against centrifuge data. Gajan & Kutter present several comparisons between the predictions made by the contact interface model and
testing, the authors did not present any comparisons between the model predictions and this data – such a validation is vital in order for the model to be adopted. In addition, the large number of user and nonuser-defined parameters adds to the complexity of implementing this model for alternative prototype scenarios and reduces confidence that the prediction can be extrapolated beyond the precise situation studied - fifteen independent parameters allowing almost any behaviour to be replicated with appropriate values chosen.
Although there have been numerous other macro-elements presented in literature with varying degrees of validation and capabilities, the three outlined above are prominent in the field and exemplify the challenges of developing such models. The majority of published models have to be questioned due to them being calibrated using data from tests in which the soil stress-state and loading were not accurately replicated. Ideally a simple model, rigorously calibrated and validated using data from tests which represent the prototype stress-state would be available to practising engineers to use in the seismic design of foundations.
In this paper a simplified macro-element model developed based on fundamental geotechnical principles will be presented. The calibration and validation of the model against a collection of centrifuge data, collected from true-dynamic testing of a raft foundation located on dry sand, will also be shown concluding with a realistic appraisal of the new model, its capabilities and limitations. The model consists of two separate components; a backbone curve which forms the overall shape of the moment-rotation cycles and an energy dissipation component which converts the model
backbone into a fully development moment-rotation cycle. Prior to presentation of the model, the experimental programme used to derive and validate the model will be described.
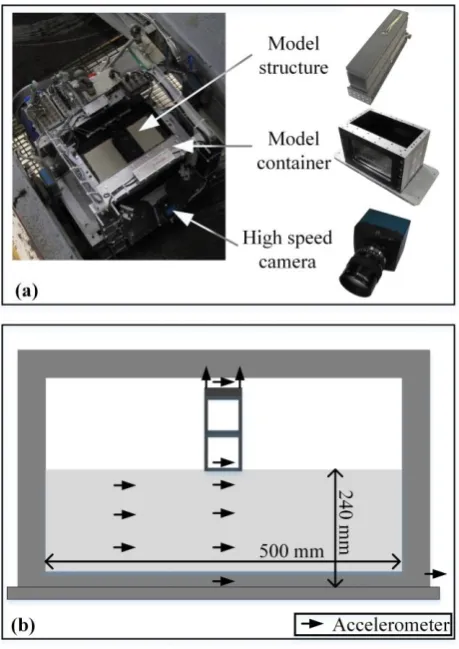
Data from two dynamic centrifuge tests, incorporating numerous excitations, were used to develop the model described in this paper. The tests were conducted using the ten metre diameter Turner beam centrifuge (Schofield, 1980) which was operated such that the g-level in the region of the foundation was 44-g. A stored angular momentum (SAM) actuator (Madabhushi et al., 1998) was used to either subject the models to constant frequency, constant amplitude sinusoidal ground motions or to subject them to a constant displacement and decreasing frequency ground motion (referred to as a sine-sweep). The amplitude, frequency and duration of each shake can be adjusted in-flight allowing a range of motions to be tested. Subjecting the models to constant frequency and amplitude motions has the advantage of allowing the response to simple motions to be analysed and understood prior to examining the behaviour when more complex earthquake traces are used. This does, however, limit the extent to which the model developed in this paper can be validated for use with real earthquake motions. The sand and foundations were contained within a rigid container with a Perspex window allowing the movements of the foundation and soil to be imaged at a high rate during the test. To reduce the effect of the rigid boundary conditions, a plastic material, Duxseal (Steedman and Madabhushi, 1991), was used to limit the amount of energy which was reflected from the container walls. In addition to high speed photography, an extensive instrumentation array, consisting of miniature piezoelectric accelerometers and micro-electro-mechanical system (MEMS) accelerometers, was used to monitor the response of the ground, foundation and superstructure.
Test details
foundation-soil interface (Davis & Booker, 1971) and a shape correction factor as detailed in Eurocode 7. The pseudo-dynamic factor of safety for each test is detailed in Table 2 and was
[image:9.595.161.436.206.460.2]calculated using the approach presented by Butterfield & Gottardi (1994) as previously implemented for a similar purpose by Loli et al. (2014).
Table 1. Details of model structure (model scale values in brackets).
Bearing pressure (kPa) 82 (82) Fixed base natural frequency (Hz) Stiff: >9 (>400)
Height of centre of gravity (m) 2.4 (0.054) Base width (m) 2.2 (0.050) Overall height (m) 4.0 (0.092)
Length (m) 9.4 (0.214)
[image:9.595.75.530.509.764.2]Construction material - (Steel) Static vertical factor of safety (loose soil) 7.2 Static vertical factor of safety (dense soil) 7.8
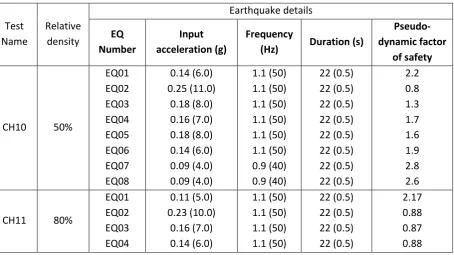
Table 2. Details of tests conducted (model scale values in brackets). * indicates sine-sweep motion.
Test Name Relative density Earthquake details EQ Number Input acceleration (g) Frequency
(Hz) Duration (s)
Pseudo-dynamic factor
of safety
CH10 50%
EQ01 EQ02 EQ03 EQ04 EQ05 EQ06 EQ07 EQ08 0.14 (6.0) 0.25 (11.0) 0.18 (8.0) 0.16 (7.0) 0.18 (8.0) 0.14 (6.0) 0.09 (4.0) 0.09 (4.0) 1.1 (50) 1.1 (50) 1.1 (50) 1.1 (50) 1.1 (50) 1.1 (50) 0.9 (40) 0.9 (40) 22 (0.5) 22 (0.5) 22 (0.5) 22 (0.5) 22 (0.5) 22 (0.5) 22 (0.5) 22 (0.5) 2.2 0.8 1.3 1.7 1.6 1.9 2.8 2.6
CH11 80%
EQ05 EQ06 EQ07 EQ08 EQ09 EQ10 0.14 (6.0) 0.11 (5.0) 0.11 (5.0) 0.11 (5.0) 0.11 (5.0) 0.36 (16.0) *
1.1 (50) 1.1 (50) 1.1 (50) 1.1 (50) 0.9 (40) 1.1 (60) *
22 (0.5) 22 (0.5) 22 (0.5) 22 (0.5) 22 (0.5) 440 (≈10) *
0.89 1.40 1.81 2.35 1.85 0.85 Data processing
The results presented in this paper are derived using data collected from the MEMS accelerometers located on the structure with quoted base input accelerations being determined from the
piezoelectric accelerometer attached to the outside base of the model container. The data was initially processed by filtering out high frequency noise using an 8th order Butterworth filter with a cut of frequency of 400 Hz. The MEMS accelerometers used have inbuilt filters at 400 Hz hence no data was eliminated. Although the fixed base natural frequency of the stiff structure exceeded 400 Hz, negligible internal deformation would have occurred during these tests due to the excitation frequency (50 Hz) being significantly below the natural frequency and therefore no information is lost by not examining frequencies above 400 Hz. To obtain the experimental moment-rotation behaviour, the acceleration data was double integrated and then high-pass filtered above 10 Hz in order to remove the accumulation of displacement error created by the integration process. These calculated displacements were validated against displacements obtained from imaging (PIV) techniques. The rotation was evaluated by the difference in displacement between the two vertical accelerometers on either side of the foundation divided by the distance between the instruments. The moment was taken as the overturning force provided by the inertial acceleration of the structure mass multiplied by the distance of between the base of the foundation and the centre of gravity of the structure. The moment contribution from the rotational inertial component was found to be negligible compared to the overturning moment and was therefore not included in the
Development of the backbone model
Fundamentally, the soil beneath the foundation is experiencing a load-unload cycle as the foundation rocks during seismic loading, with the load being provided by the moment loading transmitted to the ground by the foundation. It is intuitive therefore to initially consider an established model for the stress-strain behaviour of soil such as that developed by Oztoprak and Bolton (2013), (Equation 1). Utilising a mobilisable strength design framework, as proposed by Osman and Bolton (2005), the applied moment from the foundation can be considered to induce a representative shear stress in the deformation mechanism within the soil, τrep. The rotation can also
be shown to be compatible with a certain magnitude of shear strain in the mechanism, γrep. Equation
1 can then be used to link these representative stresses and strains and hence to link moments to rotations. If the stresses and strains are assumed to be proportional to the moments and rotations respectively, as shown in Equations 2 and 3, combining Equations 1, 2 & 3 allows the formulation of an overall relationship between moment and rotation, as shown in Equation 4. The choice of values for the R and S proportionality constants will be the main focus of this section.
𝐺 𝐺0=
1 1 + (𝛾 − 𝛾𝑒
𝛾𝑟 )
𝑎 (1)
𝜏𝑟𝑒𝑝 = 𝑅 × 𝑀 (2)
𝛾𝑟𝑒𝑝 = 𝑆 × 𝜃 (3)
𝑀 = 𝐺0∙ 𝑆 𝑅 ∙ 𝜃 1 + (𝑆 ∙ |𝜃| − 𝛾𝑒
𝛾𝑟 )
𝑎 (4)
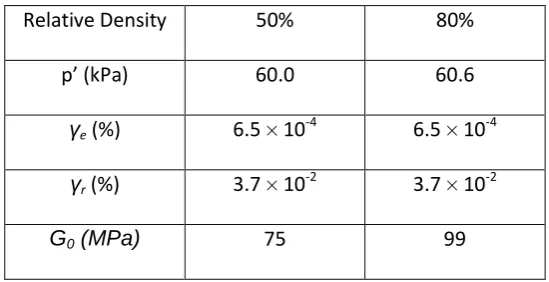
comment on the intrinsic parameters of the hyperbolic model proposed by Oztoprak and Bolton (2013). Although average values for the γe and γr parameters are proposed, relationships linking
their value to the confining stress are also presented. Similarly, parameter a is related to the
coefficient of uniformity of the sand. Values for parameters G0, a, γe and γr were hence calculated as
presented in Table 3. The confining stress was calculated at a depth of a quarter of the foundation width which, from image analysis of the deformation mechanism, appeared to be a sensible representative depth. The small change in confining stress with changing density did not vary the values calculated for γe and γr, as shown in Table 3, and hence a single value can be used in the
[image:12.595.160.435.354.495.2]subsequent analysis.
Table 3: Values taken for intrinsic model parameters
Relative Density 50% 80%
p’ (kPa) 60.0 60.6
γe(%) 6.5 × 10⁻⁴ 6.5 × 10⁻⁴
γr(%) 3.7 × 10⁻² 3.7 × 10⁻²
G0 (MPa) 75 99
It could be postulated that the strain in the mechanism would be directly proportional to foundation rotation and hence S might be constant. Conversely, the shear stress conversion parameter, R, would be anticipated to be a function of the rotation magnitude θ, as the mechanism changes size and shape. R will also depend on whether the foundation is in full contact with the ground (non-uplift – ‘NUL’) or has rotated sufficiently to form a gap between its bottom surface and the underlying sand (uplift – ‘UL’).
pressures is adopted, as shown in Figure 2. It may be postulated that a more complex pressure distribution, similar to that found under a static rigid shallow foundation, should be considered. Despite the static case being well documented, there is little information on the stress distribution under a foundation sited on sand being subjected to true dynamic loading, with the inertia of the foundation and soil both likely to affect the true distribution. Therefore in the lack of a proven alternative, a linear distribution is the most sensible choice. The vertical stress can be split into two components; a constant component across the entire base and a linear component which varies from zero at one end to a maximum at the other end of the foundation. It is this linear component which provides the restoring moment to the foundation. If the maximum difference in stress between the two edges of the foundation is 2rθb, where r is a scalar to convert displacement into vertical stress, (i.e. the subgrade reaction modulus), the moment about the centre of the foundation being provided by the stress distribution can be evaluated using Equation 5. A further conversion factor, f, is used to convert the peak gradient of the vertical stress into a representative shear stress, as shown by Equation 6. Combining Equations 2, 5 & 6, allows the parameter R to be evaluated as shown by Equation 7. This indicates that, at low rotation, before uplift has occurred, R is
independent of the rotation and peak normal stress, only being a function of the factor converting normal stress to shear stress, f. Further comments on the choice of parameter f will be made later.
𝑀 = 2𝑟𝜃𝑏3
3 (5)
𝜏𝑟𝑒𝑝 = 𝑓 × (2𝑟𝜃𝑏) (6)
𝑅(𝜃) = 𝜏 𝑀=
3𝑓
𝑏2 (7)
value of β can be determined by resolving forces vertically, as shown in Equation 8, which results in β being a function of the foundation width (b), the nominal bearing pressure (σn), the rotation (θ)
and the subgrade reaction modulus (r). By calculating the restoring moment about the centre of the foundation, the restoring moment can be evaluated as shown in Equation 9. Similarly to the NUL case, the representative shear stress is taken as a factor, f, times the variation in normal stress across the foundation (Equation 10). Combining Equations 2, 9 & 10 results in the formulation for parameter R shown in Equation 11. Unlike the NUL case, R is a function of r, θ and f.
⊥ : 𝛽 = (4𝑏𝜎𝑛 𝑟𝜃 )
0.5
− 𝑏 (8)
𝑀 = 2𝑏𝜎𝑛
3 ∙ (2𝑏 − 𝛽) (9)
𝜏𝑟𝑒𝑝 = 𝑓 × (𝑟𝜃 ∙ [𝑏 + 𝛽]) (10)
𝑅(𝜃) = 𝜏 𝑀=
𝑓 ∙ 𝑟 ∙ |𝜃| ∙ (4𝑏𝜎𝑛
𝑟 ∙ |𝜃|)
0.5
2𝑏𝜎𝑛
3 (3𝑏 − [𝑟 ∙ |𝜃|]4𝑏𝜎𝑛
0.5
)
(11)
The modified hyperbolic model parameter R can therefore be evaluated for different rotation
magnitudes if values of r and f are known. With reference to the f parameter it was found that when
different values were implemented in the optimisation code, the other model parameters, r and S,
countered the change resulting in approximately the same overall quality of fit between the model and
the data. Thus parameter f has been set to be equal to one in the following analysis as this was found
to result in the best fit after optimisation of the r and S parameters. This leaves the parameters r and S
to be determined by calibration of the model against the experimental data.
Choosing optimal model parameters
response to changes in the r and S parameters, it is not possible to simply determine the ideal parameter choices for each dataset and then take an average of the obtained values. Instead a least-squares analysis based on the error between the model prediction and the experimental moment backbone curve was performed and the best choice for the r and S parameters determined. The model assumes some uplift and hence only tests in which uplift was observed were taken for the back-calculation of the r and S parameters. It is noteworthy that the tests with evident uplift were only the ones with pseudo-dynamic factor of safety values of less than one (Table 2). Generalised parameter values for r and S of 4.3×10⁷ and 0.21 respectively were obtained from the back-calculation analysis.
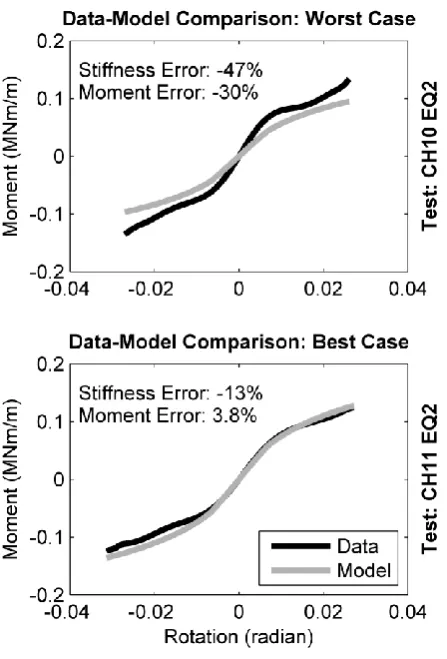
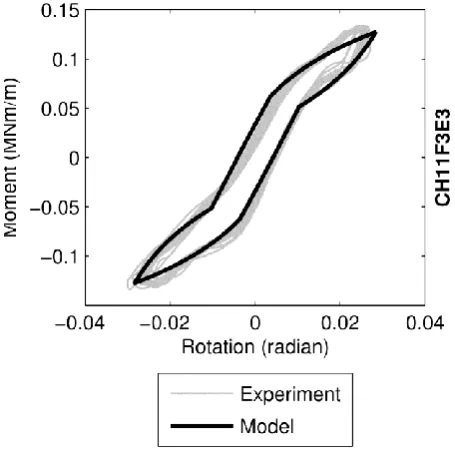
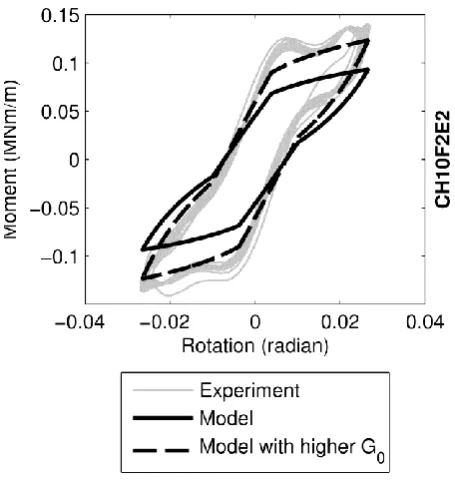
Figure 4 compares the data and model moment-rotation curves for two datasets; one with the greatest and one with the least error when using the generalised model parameters. Also quoted in the figure are the peak moment and small-rotation stiffness percentage errors. These two tests have different relative densities but the same magnitude of earthquake, with the good comparison being for dense sand. It is interesting to note that if the small strain shear modulus (G0) calculated for the
dense test was used for the loose test model then the model would predict the data more
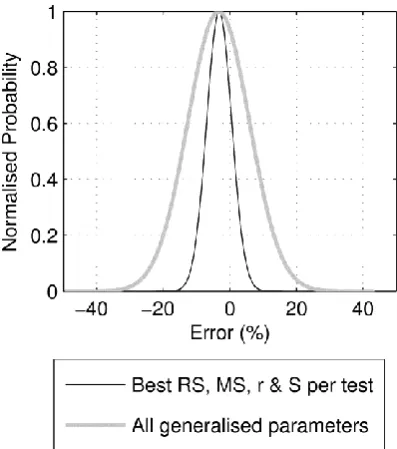
accurately. It could therefore be the case that the density was not achieved precisely for the loose test or the previously induced earthquake had caused sufficient densification as to increase the shear modulus towards the dense sand magnitude. Figure 5 shows the error distribution curves resulting from implementing the generalised parameters to model the tests used to obtain the parameters. Based on these distributions, with a 95% confidence level, the model predicts the peak moments to within 30% and the small-rotation stiffness to within 50%. The large stiffness error is likely to be a result of inaccurate values for the small-strain shear modulus. The model could be used to back calculate appropriate G0 values by using the generalised model parameters and determining
the best choice of G0 to best fit the model to the data. With a formulated, calibrated and validated
Development of energy dissipation model
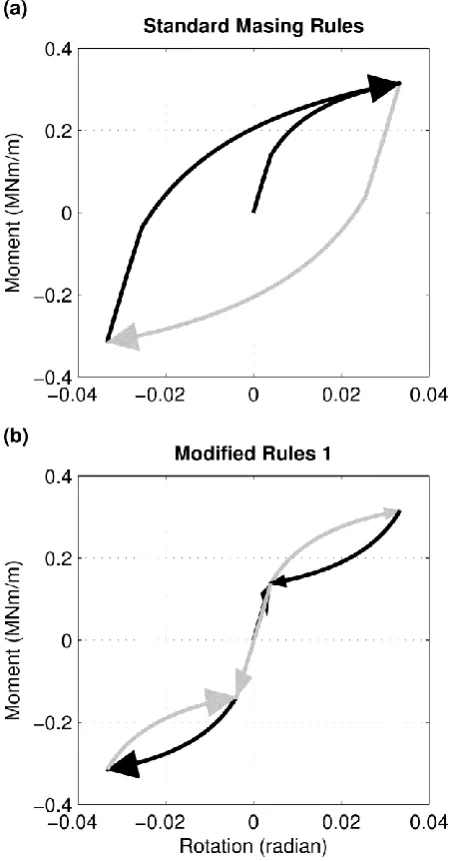
Damping in soils is known to be largely independent of loading frequency (Pyke, 1979) and therefore a hysteretic damping model is most suitable for including damping in the moment-rotation cycles. Hysteretic damping could be included within the model through a mathematical construct which includes a damping coefficient and an imaginary unit. The imaginary unit is required to synchronise the damping with the rotational velocity as opposed to the rotation. Alternatively the hysteretic damping can be included through a purely analytical method as proposed by Masing (1926) and Pyke (1979). Masing proposed a set of rules which use the initial backbone load-unload curve to develop a representation of the fully damped cyclic response. The rules proposed by Masing are outlined below and are shown diagrammatically in Figure 6 for a simple stress-strain cycle.
1) The shear modulus on each loading reversal assumes a value equal to the initial modulus for the initial loading curve.
2) The shape of the unloading or reloading curve is the same as that of the initial loading curve, except that the scale is enlarged by a factor of two in both the x and y directions.
load-unload cycle applied to a soil column, hence at all times during the loading and load-unloading cycle there will be a geometrically identical mechanism at work. As discussed previously, the moment-rotation loading consists of two mechanisms; pre-uplift and post-uplift. Hence the simple application of the Masing rules to the entire moment-rotation backbone curve does not result in a correct
representation of the energy dissipation.
As Masing rules apply to a scenario in which a consistent mechanism acts during loading and given the two mechanisms (non-uplift and uplift) at work during moment-rotation loading, modifications to the rules are required to allow them to accurately model the moment-rotation cycles. The initially proposed modifications involve splitting the backbone curves at the uplift point and thus having four separate sections instead of two; non-uplift loading and unloading, and uplift loading and unloading. The moment-rotation path would now follow the listed sequence of sections: loading uplift -
unloading uplift - double unloading uplift - unload uplift - loading uplift - double loading non-uplift (Figure 7b). This set of modified rules still results in the same change in moment and rotation as the original rules however the cycle still does not follow precisely the characteristic moment-rotation shape, as shown in Figure 7b.
The scaling of the sections that follow a load reversal is key in defining the cycle shape. Although scaling these legs by a factor of two for simple stress-strain cycles, as originally proposed by Masing, is applicable for those situations, the complex moment-rotation behaviour being modelled and the necessity to divide the backbone into two sections necessitates further modifications to the original rules. In order to obtain a moment-rotation model more representative of the true moment-rotation behaviour, the magnitude of the scaling applied to the section after a load reversal point requires further examination.
the cycles along the moment or rotation axis does not occur. A peak rotation which is the mean of the positive and negative experimental peak rotations was used for the analysis.
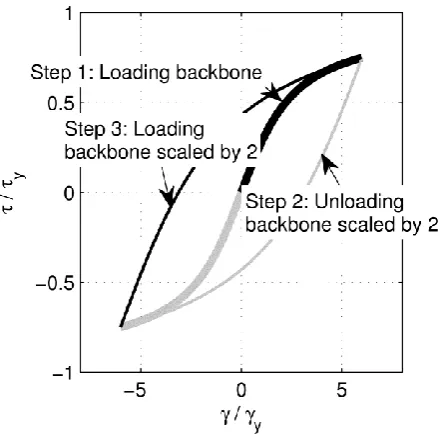
After thorough investigation it was found that bespoke scaling was required post load-reversal in order to model the true moment-rotation cycles with different scalars being applied in the rotation (RS) and moment (MS) directions, as shown in Figure 8. The magnitude of moment reduction post load reversal is the moment scalar, MS, times the moment change across the uplift backbone section, with the same rule being applied to the rotation magnitude. Following this initial scaled uplift reversal section a double non-uplift (NUL) section follows as this was found to successfully follow the pattern of the data. To ensure moment or rotation drift does not occur, the end point of the reversal path must coincide with the opposite end of the backbone curve. Therefore, the uplift section prior to the next reversal point is scaled by 2-RS and 2-MS. In this way, the same change in moment and rotation occurs as if the original Masing rules were followed. As can be observed in Figure 8, the shape formed following these rules now appears much more like the expected form of a moment-rotation cycle. Therefore this set of modified Masing rules has been adopted and the optimal RS and MS values can be determined by calibration against the experimental dataset.
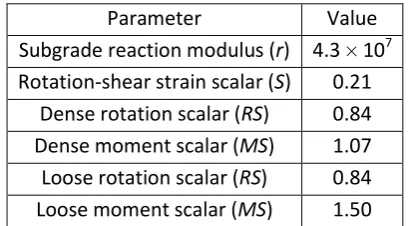
parameters. Values of 0.84 and 1.07 for RS and MS respectively were obtained for the dense sand tests, while for loose sand, values of 0.84 and 1.50 were obtained. This indicates that indeed there is an effect of relative density on the overall cycles beyond its influence on the backbone curve. A larger values for MS implies a larger area within the moment-rotation cycle indicating more energy dissipation – an expected characteristic for loose sand. Figure 9 shows the damping errors (between the model and the data) obtained for ‘optimal choice’ and generalised parameters with the dense sand tests. Further improvements to the accuracy of the model could be made with further experimental testing providing more data against which the model parameters can be calibrated.
Discussion and validation of model
Although Figures 5 & 9 give some indication of the success of the model, it is worthwhile to examine more closely the accuracy of the predictions made by the model. Using the generalised parameters, as summarised in Table 4, different measures of error between the model and the experimental data can be obtained as shown in Figure 10. It should be noted that the presented generalised
However, it must be remembered that several of the earthquakes fired during the tests were very small and hence uplift was minimal resulting in difficulty determining accurate values for the damping within the cycles. With further testing and an expansion of the useable dataset against which the model can be calibrated, the errors would be expected to reduce as anomaly tests would not bias the overall error statistics to the same degree. In fact, further testing was performed which included a further four centrifuge tests and forty-five dynamic excitations. Unfortunately during these tests an issue with the experimental setup resulted in some restriction being applied to the free-movement of the foundation hence this data has been excluded from the previous discussion. If an identical analysis procedure, as was described previously, is used with the data from these additional tests, the model is still shown to be effective at modelling the response albeit with different r and S parameter values (due to the experimental issue) and an increase in the standard deviation of the errors obtained (due to the inconsistency of the experimental issue). This does add further reassurance as to the validity of the proposed model. However, further testing is still
advisable, not only for the reasons outlined above but also testing a more diverse range of prototype scenarios would allow the model to be refined and validated for use in a wider range of design cases.
Table 4. Summary of generalised model parameters.
Parameter Value
Subgrade reaction modulus (r) 4.3 × 10⁷ Rotation-shear strain scalar (S) 0.21
[image:20.595.195.400.551.664.2]Dense rotation scalar (RS) 0.84 Dense moment scalar (MS) 1.07 Loose rotation scalar (RS) 0.84 Loose moment scalar (MS) 1.50
Table 5. Mean and standard deviation of errors.
Error Type Subset of 6 tests Subset of 10 tests
Mean (%) Standard deviation (%) Mean (%) Standard deviation (%)
Moment -7.4 12.7 -20.8 26.7
Damping -9.2 12.5 -33.7 41.2
It is also worthwhile to examine some comparisons between the model and experimental moment-rotation cycles. Figure 11 shows the results from the test with the minimum damping error, with an error of 3.5%.Figure 12 on the other hand shows the case resulting in the largest damping error (from within the subset of tests used to calibrate the model) between the model and experimental data – with an error of 23%. This is again the test shown in Figure 4 which showed the largest error with the generalised backbone parameters. It was however found that modifying the small-strain shear modulus to the value used for the dense tests corrected the error in the backbone. As shown in Figure 12, when the small-strain shear modulus is again increased to the same level as that used for the dense sand tests, the model very accurately predicts the peak moment and energy
dissipation. This highlights the importance of accurate evaluation of the small-strain shear modulus when implementing the model described in this paper.
(2011) develop a theoretically rigorous model and provide comparisons against numerical simulations, other proposed macro-element models and two different sets of data with generally favourable comparisons being presented. However, the datasets used for validation are again from testing in which the complicated nature of true-dynamic loading was not considered and hence the validation is thus far limited. A particular strength of this new model arises from the fact it was calibrated using true-dynamic centrifuge data and thus questions regarding differences between the model and the real design scenario are avoided. The data used for the comparisons presented in this paper has not been specially selected to show particularly favourable correlations; instead an open appraisal of the model has been presented, at least for the prototype examined. Errors such as those presented in Figure 10 might initially cause concern however it must be remembered that they were obtained from applying a model developed to capture uplift behaviour to experimental situations in which significant amounts of uplift did not always occur and hence increased comparative errors are inevitable. It has been shown however that further validation and calibration of the model,
especially regarding the selection of small-strain shear modulus, could lead to a rigorous and easily implementable model. The ability of the model presented in this paper to model the changing mechanism under the foundation in such a simple manner and yet still to accurately replicate experimental data acquired from true dynamic centrifuge testing thus presents a novel contribution to this field.
It should be noted that many proposed models, such as that those proposed by Gajan & Kutter (2009) and Chatzigogos et al. (2011), are capable of predicting the full moment-rotation-settlement behaviour whereas the model presented here predicts the moment-rotation behaviour only. However, this new model is comparatively simpler with significantly fewer user-defined input parameters required.
accuracy of the model. In addition, experimental data on the stress distribution under a rocking foundation would be useful to further refine the relationship between applied moment and representative shear stress.
Conclusions
In this paper a model for the moment-rotation behaviour of shallow raft foundations located on dry sand beds and subjected to medium sized seismic excitations has been developed and validated. This is intended to be included as a macro-element within an overall numerical model of the entire soil-foundation-structure system. Appropriate simplifying assumptions have been made such that the final model did not become overly complex, a key element in the novelty of this model. Even with these simplifying assumptions the model was found to be able to reliably predict the observed experimental behaviour obtained from centrifuge testing provided the small-strain shear modulus could be accurately determined. The peak moments and energy dissipated were replicated reliably with a maximum damping error of around 20%. The ability of such a simplified model to perform reliably potentially paves the way, following validation against a wider range of prototypes, for it to be included within an appropriate model of an overall soil-structure-foundation system.
Acknowledgements
The authors would like acknowledge the collaborative and financial support received through the European Community’s Seventh Framework programme (FP7/2007-2013) under grant agreement number 227887 (SERIES – Seismic Engineering Research Infrastructures for European Synergies). The support from the staff at the Schofield Centre, University of Cambridge is also gratefully
References
Abate, G., Massimino, M. R., Maugeri, M., & Muir Wood, D. (2010). Numerical Modelling of a Shaking Table Test for Soil-Foundation-Superstructure Interaction by Means of a Soil Constitutive Model Implemented in a FEM Code. Geotechnical and Geological Engineering, 28(1), 37–59.
Anastasopoulos, I., Gazetas, G., Loli, M., Apostolou, M., & Gerolymos, N. (2010). Soil failure can be used for seismic protection of structures. Bulletin of Earthquake Engineering, 8(2), 309–326.
Anastasopoulos, I., & Kontoroupi, T. (2014). Simplified approximate method for analysis of rocking systems accounting for soil inelasticity and foundation uplifting. Soil Dynamics and Earthquake Engineering, 56, 28–43.
Butterfield, R. & Gottardi, G. (1994). A complete three-dimensional failure envelope for shallow footings on sand. Geotechnique, 44(1), 181-184.
Chatzigogos, C., Figini, R., Pecker, A., & Salencon, J. (2011). A macroelement formulation for shallow foundations on cohesive and frictional soils. International Journal for Numerical and Analytical Methods in Geomechanics, 35(May), 902–931.
David, E.H. & Booker, J.R. (1971). The bearing capacity of strip footings from the standpoint of plasticity theory. In 1st Australian-New Zealand Conference in Geomechanics Melbourne (pp. 276-282).
Flavigny, E., Desrues, J., & Palayer, B. (1990). Le sable d’Hostun. Revue Française de Géotechnique,
53, 67–70.
Gajan, S., & Kutter, B. L. (2009). Contact interface model for shallow foundations subjected to combined cyclic loading. Journal of Geotechnical and Geoenvironmental Engineering, 135(3), 407– 419.
Gelagoti, F., Kourkoulis, R., Anastasopoulos, I., & Gazetas, G. (2012). Rocking isolation of low-rise frame structures founded on isolated footings. Earthquake Engineering & Structural Dynamics, 41(7), 1177–1197.
Grange, S., Kotronis, P., & Mazars, J. (2009). A macro-element to simulate dynamic soil-structure interaction. Engineering Structures, 31, 3034–3046.
Holden, T., Restrepo, J., & Mander, J. B. (2003). Seismic Performance of Precast Reinforced and Prestressed Concrete Walls. Journal of Structural Engineering, 129(3), 286–296.
Loli, M., Knappett, J.A., Brown, M.J., Anastasopoulos, I. & Gazetas, G. (2014). Centrifuge modeling of rocking-isolated inelastic RC bridge piers. Earthquake Engineering & Structural Dynamics, 43(15), 2341-2359.
Madabhushi, S. P. G., Schofield, A. N., & Lesley, S. (1998). A new stored angular momentum (SAM) based earthquake actuator. In Centrifuge ’98 (pp. 111–116).
Masing, G. (1926). Eigenspannungen und verfestigung beim messing. In Proceedings of the 2nd International Congress of Applied Mechanics (pp. 332–335).
Osman, A., & Bolton, M. (2005). Simple plasticity-based prediction of the undrained settlement of shallow circular foundations on clay. Geotechnique, 55(6), 435–447.
Ou, Y.-C., Wang, P.-H., Tsai, M.-S., Chang, K.-C., & Lee, G. C. (2010). Large-Scale Experimental Study of Precast Segmental Unbonded Posttensioned Concrete Bridge Columns for Seismic Regions.
Oztoprak, S., & Bolton, M. D. (2013). Stiffness of sands through a laboratory test database.
Géotechnique, 63(1), 54–70.
Paolucci, R., Prisco, C., & Vecchiotti, M. (2007). Seismic behaviour of shallow foundations: large scale experiments vs. numerical modelling and implications for performance based design. In 1st US-Italy Seismic Bridge Workshop.
Pampanin, S. (2005). Emerging Solutions for High Seismic Performance of Precast/Prestressed Concrete Buildings. Journal of Advanced Concrete Technology, 3(2), 207–223.
Pender, M. J. (2010). Integrated earthquake resistant design of structure-foundation systems. In 5th International Conference on Recent Advances in Geotechnical and Earthquake Engineering and Soil
Dynamics.
Pyke, R. M. (1979). Nonlinear soil models for irregular cyclic loadings. J. Geotechnical Engineering Division, ASCE, 105(6), 715–726.
Raychowdhury, P., & Hutchinson, T. (2009). Performance evaluation of a nonlinear Winkler‐based shallow foundation model using centrifuge test results. Earthquake Engineering & Structural Dynamics, 38(March), 679–698.
Schofield, A. N. (1980). Cambridge geotechnical centrifuge operations. Géotechnique, 30(3), 227– 268.
Smith, B. J., Kurama, Y. C., & McGinnis, M. J. (2011). Design and Measured Behavior of a Hybrid Precast Concrete Wall Specimen for Seismic Regions. Journal of Structural Engineering, 137(10), 1052–1062.
Wotherspoon, L., & Pender, M. (2010). Effect of uplift modelling on the seismic response of shallow foundations. In 5th International Conference on Recent Advances in Geotechnical and Earthquake Engineering and Soil Dynamics.
Figure 1. Model layout; (a) photograph of model set up on centrifuge, (b) schematic of instrument
and structure layout
[image:28.595.76.351.477.592.2]Figure 3. Assumed bearing pressure distribution under foundation for uplift case.
[image:29.595.73.297.241.571.2]Figure 5. Error distributions resulting from use of generalised model parameters.
[image:30.595.73.294.351.568.2]Figure 8. Proposed modifications to Masing rules involving situation dependent scaling.
Figure 9. Damping error distributions resulting from use of optimum and generalised backbone
[image:32.595.71.270.443.668.2]Figure 10. Error distributions according to different measures for; (a) a subset of tests and (b) for all
tests.
[image:33.595.70.298.463.692.2]