Classification Tree for Risk Assessment in Patients
Suffering From Congestive Heart Failure via
Long-Term Heart Rate Variability
Paolo Melillo, Member, IEEE, Nicola De Luca, Marcello Bracale, and Leandro Pecchia
Abstract—This study aims to develop an automatic classifier for
risk assessment in patients suffering from congestive heart failure (CHF). The proposed classifier separates lower risk patients from higher risk ones, using standard long-term heart rate variability (HRV) measures. Patients are labeled as lower or higher risk ac-cording to the New York Heart Association classification (NYHA). A retrospective analysis on two public Holter databases was per-formed, analyzing the data of 12 patients suffering from mild CHF (NYHA I and II), labeled as lower risk, and 32 suffering from severe CHF (NYHA III and IV), labeled as higher risk. Only pa-tients with a fraction of total heartbeats intervals (RR) classified as normal-to-normal (NN) intervals (NN/RR) higher than 80% were selected as eligible in order to have a satisfactory signal quality. Classification and regression tree (CART) was employed to de-velop the classifiers. A total of 30 higher risk and 11 lower risk patients were included in the analysis. The proposed classification trees achieved a sensitivity and a specificity rate of 93.3% and 63.6%, respectively, in identifying higher risk patients. Finally, the rules obtained by CART are comprehensible and consistent with the consensus showed by previous studies that depressed HRV is a useful tool for risk assessment in patients suffering from CHF.
Index Terms—Congestive heart failure (CHF), data mining,
decision tree, heart rate variability (HRV).
I. INTRODUCTION
C
ONGESTIVE heart failure (CHF) is a pathophysiological condition due to an abnormal cardiac function, which is responsible for the failure of the heart to pump blood asre-Manuscript received August 3, 2012; revised December 8, 2012; accepted January 23, 2013. Date of publication February 4, 2013; date of current version May 1, 2013. P. Melillo was supported by the Project Smart Health and Artifi-cial intelligence for Risk Estimation under Grant PON04a3_00139, funded in part by European Union, in the framework of 2007–2013 National Operational Programme for Research and Competitiveness. The work of L. Pecchia was supported by the MATCH Programme under EPSRC Grant EP/F063822/1.
P. Melillo is with the Dipartimento di Ingegneria dell’Energia Elettrica e dell’Informazione “Guglielmo Marconi” of the University of Bologna, Bologna 33-40126, Italy and also with the Dipartimento Multidisciplinare di Specialit`a Medico-Chirurgiche e Odontoiatriche of the Second University of Naples, Caserta 81100, Italy (e-mail: [email protected]).
N. De Luca is with the Department of Clinical Medicine, Cardiovascular and Immunological Sciences, Federico II University Hospital, Naples 80138, Italy (e-mail: [email protected]).
M. Bracale was with the Department of Biomedical, Electronic and Telecom-munication Engineering, University of Naples “Federico II,” Naples 80138, Italy (e-mail: [email protected]).
L. Pecchia is with the Department of Electrical and Electronic Engineer-ing, University of Nottingham, Nottingham NG72RD, U.K. (e-mail: Leandro. [email protected]).
Color versions of one or more of the figures in this paper are available online at http://ieeexplore.ieee.org.
Digital Object Identifier 10.1109/JBHI.2013.2244902
quired by the body. CHF severity can be measured with the symptomatic classification scale of the New York Heart Asso-ciation (NYHA) [1]. Classification via NYHA scale has been proved to be a risk factor for mortality [2], [3].
Heart rate variability (HRV) is the variation over time of the period between consecutive heartbeats (RR intervals) [4] and is usually extracted from electrocardiographic signal (ECG) recorded through a noninvasive technique. HRV is commonly used to assess the influence of the autonomic nervous system (ANS) on the heart [5]. HRV has been widely studied in patients suffering from CHF [6]–[19]. Many studies demonstrated that HRV is an effective means for the risk assessment of mortality [8], [10], [13]–[15], [17].
A number of studies [6], [7], [11], [12], [18] demonstrated the relationship of HRV measures and the NYHA classifica-tion scale. In our previous papers, we demonstrated that HRV might be used to detect CHF using short-term [20] or long-term measures [21]. Moreover, we proposed a classifier based on short-term HRV measures to individuate severity of CHF [22].
Over the past years, automatic classifiers, based on several clinical and instrumental parameters, have been proposed to sup-port CHF assessment [23]. However, to the best of the authors’ knowledge, these classifiers are not based on HRV features, ex-cept for those proposed by Yang et al. [24] who included HRV features but did not provide details about the related processing. In this study, we present a classifier, based on long-term HRV measures, for the individuation of high-risk conditions in CHF patients, estimated via NYHA scale. Patients where considered at higher risk if suffering from severe CHF (NYHA III or IV) and at lower risk if suffering from mild CHF (NYHA I or II).
The method we used to develop the classifier is classification and regression tree (CART). CART, developed by Breiman [25], has been used in several applications of pattern recognition es-pecially for medical diagnosis [26]. The CART algorithm itera-tively splits the dataset, according to a criterion that maximizes the separation of the data, producing a tree-like decision struc-ture [25]. CART was applied to HRV measures for other inves-tigations [27]. We adopted CART in previous studies [20], [28], in which a larger dataset was available to train the CART and/or the final classification of the patients was based on a combina-tion of trees. On the contrary, in this study, the selected dataset is small and unbalanced. A number of solutions to the class-imbalance problem were previously proposed at data, feature selection, and algorithmic levels [29]. At the data level, these solutions include many different forms of resampling. At the algorithmic level, solutions include adjusting the costs of the
various classes so as to counter the class imbalance, adjusting the probabilistic estimate at the tree leaf (when working with decision trees) and adjusting the decision threshold. As regards feature selection, Zheng et al. [30] proposed a framework to deal with imbalanced dataset, showing the importance of fea-ture selection methodology and performance measurement.
In this study, we adopted CART algorithms with a feature selection algorithm in order to handle a small and unbalanced dataset. We compared the performance of the proposed method with a standard data-level-based method to deal with imbalance that is the oversampling technique. We preferred a data-level solution as the benchmark since the algorithmic level solutions require the probability and the misclassification cost of the class that are difficult to estimate particularly in this case, as the rare class is also the milder one. Moreover, we compared the results of the proposed method with other classifiers based on decision trees, i.e., C4.5 [31] and random forest (RF) [32].
We implemented decision trees as they provide a classification model, i.e., “if. . .then” rules, which can be easy to read and interpret. This is crucial in medical applications [33] in which the physician is personally responsible of the diagnosis.
The HRV measures were extracted from two Holter monitor public databases [34] by using only open source and validated HRV toolkit software in order to allow other scientists to repro-duce our results.
II. METHODS
A. Data
We analyzed 44 nominal 24-h recordings from 12 lower risk patients (LRPs) suffering from mild CHF (NYHA Classes I and II) and 34 higher risk patients (HRPs) suffering from severe CHF (NYHA Classes III and IV). Only patients with a satisfactory signal quality, as described in the Section II-B, were selected as eligible. The data were retrieved from the Congestive Heart Fail-ure RR Interval Database [34] and from the BIDMC Congestive Heart Failure Database [34]. The former database includes RR intervals extracted from 24-h ECG-Holter recordings of 8 men, 2 women, and 19 unknown-gender subjects, aged 34–79 years (55±11 years). The original ECG recordings were digitized at 128 samples per second, and the beat annotations were obtained by automated analysis with manual review and correction. The latter database includes long-term ECG recordings from 11 men and 4 women, aged 22–71 years (56±11 years). The recordings were sampled at 250 samples per second and were automatically annotated. There were no significant differences between the two database in terms of age(t-testp-value: 0.85) and gender (exact Fisher’s testp-value: 0.83) profiles.
B. Long-Term HRV Measures
We performed standard long-term HRV analysis on nominal 24-h recordings according to International Guidelines [5]. The series of normal-to-normal (NN) beat intervals were obtained from the beat annotation files of the selected databases and the NN/RR ratio was computed as the fraction of total RR intervals classified as NN. This ratio has been used as a measure
of data reliability, excluding recordings with a ratio less than a threshold. We chose the threshold of 80% [34] as it was a satisfactory tradeoff between numbers of included subjects and quality of NN signals. Using this technique, 3 recordings were excluded (1 LRPs and 2 HRPs) and the final dataset consisted of 41 subjects: 11 LRP and 30 HRPs. There were no significant differences between the two subsamples (LRPs versus HRPs) in terms of age profile (t-testp-value: 0.11). Comparison of gender is not possible as this information is not available in the LRPs.
All the computed basic time- and frequency-domain HRV measures were widely used in literature as reported in Inter-national Guidelines [4] and in a recent review on HRV [5]. A number of standard statistical time-domain HRV measures were calculated: AVerage of all NN intervals (AVNN); standard de-viation of all NN intervals (SDNN); standard dede-viation of the averages of NN intervals in all 5-minute segments of a 24-h recording (SDANN); mean of the standard deviations of NN intervals in all 5-minute segments of a 24-h recording (SDNN IDX); square root of the mean of the sum of the squares of differences between adjacent NN intervals (RMSSD); and per-centage of differences between adjacent NN intervals that are longer than 50 ms (pNN50). Moreover, pNN10 (that is, percent-age of differences between adjacent NN intervals that are longer than 10 ms) was computed because Mietus et al. [7] showed that among the family of pNNx measures, pNN10 can provide the maximum separation.
The frequency-domain HRV measures rely on the estima-tion of power spectral density (PSD) computed in this work by Lomb–Scargle (LS) periodogram [35]. Fast implementa-tion and further detail of LS periodogram can be found else-where [35]–[37]. After PSD estimation, six standard frequency-domain HRV measures were calculated: total spectral power of all NN intervals up to 0.4 Hz (TOTPWR); between 0 and 0.003 Hz (ULF); between 0.003 and 0.04 Hz (VLF); between 0.04 and 0.15 Hz (LF); between 0.15 and 0.4 Hz (HF); and ratio of low- to high-frequency power (LF/HF).
C. Statistics
Since not all the HRV measures were normally distributed [38], the data were reported in terms of median, 25th and 75th percentiles, in order to describe distribution of measures in the two groups (LRPs versus HRPs) and univariate differences were assessed by Wilcoxon test.
D. Feature Selection
Even if CART implements a stepwise feature selection, it may happen that one feature is excluded because other vari-ables masked its effect. This could be particularly critical in small and unbalanced dataset. In order to deal with masking and to be sure that the tree included the best subset of features, we adopted the so-called exhaustive search method [39], inves-tigating all the possible combinations of kout of N features (withkfrom 1 toN). Since the number of featuresNis 13, we investigated 213=8092 subsets of features, training and testing
the misclassification error estimated by tenfold cross-validation approach, as described in the following paragraph. Even if the cross-validated estimate could provide limited information in small and imbalanced dataset, the feature selection improves the classification since it enables to consider combination ofn
feature withnsmaller than the size of available samples.
E. CART Method
The CART algorithm consists of two stages: tree growing and tree pruning [25]. In the former stage, the tree grows by selecting among all the possible splits, which generate the “purer” child nodes where the purest node is the one containing elements of only one class. The outcome of this step is further referred to as the large tree (LT). Among different functions that have been proposed for the measure of the impurity of each node “t” [25], we adopted the Gini index criterion [25], which for binary classification can be computed as follows:
Gini index(t) = 1−
n
i
n
2 −nj
n
2
(1)
where “t” is the considered node, “i” and “j” are the two class labels, “ni” and “nj” are the number of subject present at the
node belonging to the class “i” or “j,” respectively, and “n” is the number of subject present at the node.
In the latter stage, the LT is pruned according to a minimal cost-complexity function, which relies on the tree size and the misclassification error. The misclassification error is estimated by the inner tenfold cross-validation of the CART. The dataset is randomly divided into ten subsets. One of the subsets is used as independent testing dataset while the other nine subsets are used as training dataset. The tree-growing and pruning procedure is repeated ten times, each time with one of the ten different subsets used as a testing set. The misclassification error is calculated as the percentage of misclassified cases averaged over all the ten subsets.
This procedure is repeated pruning the tree, and for each subtree, the cost complexity function is computed as a linear combination of the number of nodes and of the cross-validated estimated of the misclassification error. The outcome of this stage is referred further to as the best subtree (BST), which is the subtree achieving the lowest value of the cost-complexity function. Further details about minimal cost-complexity pruning can be found in Breiman [25].
The most common measures for binary classification were es-timated by tenfold cross-validation, using the formulas reported in Table I, in particularF1 is one of the most suitable metric
for imbalanced class problem, as it is the harmonic mean of precision and sensitivity (recall).
F. Benchmarks
We compared the method proposed in this paper with a standard approach for class-imbalance problem based on over-sampling that is the synthetic minority overover-sampling technique (SMOTE). The rare class (mild CHF) was oversampled by cre-ating new synthetic rare class samples according to each rare class sample and itsknearest neighbors. Different values of the
TABLE I
BINARYCLASSIFICATIONPERFORMANCEMEASURES
parameterk (from 2 to 8) were tested and the value with the higherF1measure was selected. As classifiers, we also adopted
two other decision-tree-based methods: C4.5 [31] and RF [32].
G. Implementation Details
The HRV extraction and analysis was performed using Phys-ioNet’s HRV Toolkit [34]. We chose this toolkit as it is an open source and a rigorously validated package. In particular, the im-plementation of the LS periodogram adopted in this paper is the lomb.c program available from Physionet [36].
The feature selection and classification were performed by in-house software developed in MATLAB version R2009b (The MathWorks, Inc., Natick, MA, USA). In particular, CART was implemented by utilizing the methods and construction of the MATLAB class classregtree. The benchmark methods were im-plemented in Weka.
III. RESULTS
Table II shows the descriptive statistics of HRV measures in LRPs and HRPs. Among time-domain measures, SDNN, SDANN, SDNN IDX, and RMSSD were significantly reduced in HRPs. All the frequency-domain measures were significantly depressed in HRPs with the only exception of LF/HF.
The performance of the proposed method and benchmarks are reported in Table III. The proposed method achieved higher values ofF1 measure and accuracy than the benchmarks. The
higher performances were obtained by two different combina-tions of features: “TOTPWR, pNN10, pNN50, SDNNIDX” and “ULF, TOTPWR, pNN50.”
The selected BSTs are represented in Figs. 1 and 2. Each terminal node is the graphical representation of a set of “if. . .
then” rules. For instance, the terminal node 2 in the Fig. 1 can be read as: “if TOTPWR is lower than 11080.25 ms2, the subject
is classified as a higher risk patient.”
TABLE II
COMPARISON OFHRV BETWEEN THETWOGROUPS
TABLE III
CLASSIFICATIONPERFORMANCEMEASUREMENTS OF THESELECTEDCLASSIFIERESTIMATED BYTENFOLDCROSS-VALIDATION
TOTPWR is lower than 11080.25 ms2 were all correctly
classified as HRPs. CART selected pNN50 for the second node split. In this node split, the subjects whose pNN50 were lower than 1.22% were classified as LRPs. Otherwise, the following classification split was based on pNN10, that is, if it is lower than 36.093%, the subject was classified as HRP; otherwise, a final classification split is based on SDNNIDX with a threshold of 100.910 ms2.
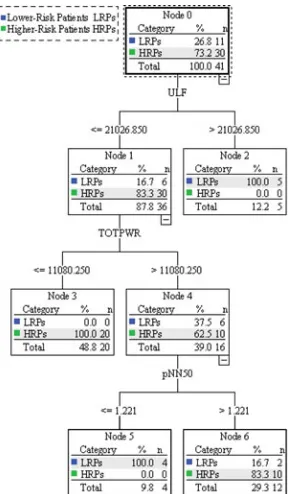
In the model shown in Fig. 2, the initial variable selected by CART (at node 1 split) was ULF. The subjects whose ULF is higher than 21026.850 ms2 were correctly classified
as LRPs. CART selected TOTPWR for the second node split. In this node split, the subjects whose TOTPWR were lower than 11080.250 ms2 were classified as HRPs. A final classification
split is based on pNN50, that is, if it is lower than 1.22%, the subject was classified as LRP, otherwise as HRP.
IV. DISCUSSION
In this study, we developed a classification tree based on standard long-term HRV for risk assessment in patients suffering from CHF.
The classifiers based on the combinations of standard long-term HRV measures “TOTPWR, pNN10, pNN50, SDNNIDX”
and “ULF, TOTPWR, PNN50” enable distinguishing HRPs from LRPs with an accuracy rate of 85.4%, a sensitivity rate of 93.3%, and a specificity rate of 63.6% (tenfold cross-validation estimates). The existence of these two best combinations can be explained by the high correlation between HRV measures [5], [38].
The selection of pNN10 in the best combination would con-firm its discrimination power proved by Mietus et al. [7], even if the differences in pNN10 values between the two groups were lower than those of other measures, as shown by the statistical analysis performed in the current study. As concerns pNN50, Mietus et al. [7] showed that pNN50 failed to distinguish the LRPs and HRPs, while pNN50 is used in the BSTs (see Fig. 1 node 2 and Fig. 2 node 4). This apparent inconsistency may be explained by considering that pNN50 could have a discrimina-tive power only for the subgroups of patients which had high value of TOTPWR (TOTPWR>11080.25 ms2), consistent with the absence of statically significant differences between the two patient groups.
Fig. 1. Final model tree for the combination of HRV features: TOTPWR, pNN50, pNN10, and SDNNIDX.
Fig. 2. Final model tree for the combination of HRV features: ULF, TOTPWR, and pNN50.
lower values of the splitting features for severe CHF patients (with the only exception of pNN50). This is coherent with the statistical analysis performed in the current study and with the results showed by Casolo et al. [18], Panina [6] and Arbolishvili [12]. It should be emphasized that the findings of Casolo et al. [18], Panina et al. [6], and Arbolishvili et al. [12] were obtained adopting different methods for PSD estimation. Several methods were proposed in literature in order to estimate PSD of RR intervals [4], [5]. Particularly, many PSD estimators are based on the hypothesis that the signal under examination is uniformly sampled [36]. In contrast, the RR series is unevenly sampled and requires resampling before PSD estimation. In this paper, LS periodogram [35] was chosen as it estimates PSD of unevenly sampled signals without the requisite of resampling and its estimation has been proven to be more accurate than fast Fourier transform (FFT)-based method for RR data [40].
In relation to the methodology, the exhaustive research for feature selection improved the classification performance com-pared to CART model obtained using all the features. More-over, as the study dataset is imbalanced, we compared the per-formance of the proposed method with SMOTE, an approach based on oversampling to handle the class-imbalance problem and with other two widely used decision-tree methods. The pro-posed method achieved the highest performance in terms of accuracy rate andF1, which is one of the most suitable metrics
for rare class problems [41]. Compared to our previous studies, based on short-term measures [22], the classifier proposed in the current studies achieved an higher accuracy and sensitivity (85.4% versus 79.3% and 93.3% versus 82.4%, respectively), even if with a lower specificity (75.0% versus 63.6%). This result leaded us to consider long-term HRV measures more effective for the individuation of higher risk patients than short-term ones. As regards the other classifier proposed in literature for CHF assessment, Guidi [23] compared different algorithms to auto-matically classify CHF patients in three groups (mild, moder-ate, and severe) and achieved an accuracy of 86% (indepen-dent set estimate; sensitivity and sensibility are not reported) by using neural network. Yang et al. [24] proposed a classifier based on support-vector machine, which achieved an accuracy of 74% (tenfold cross-validation estimate) in discriminating be-tween mild CHF (NYHA I) and moderate/severe CHF patients (NYHA II and III). We underline that the classifier proposed by Guidi [23] was based on anamnestic and instrumental data (not including HRV measures), and the one by Yang et al. [24] was based on 12 parameters, including LF/HF and other parameters from clinical tests (blood test, echocardiography test, electrocar-diography test, chest raelectrocar-diography test, and 6-min walk distance test). For that reason, some parameters needed by the automatic classifier proposed by Guidi [23] or Yang et al. [24] should be entered by physicians, while the adoption of only HRV mea-sures, as in the current study, enables a completely automatic assessment.
[image:5.594.92.237.460.707.2](for instance, some recordings were not manually reviewed and incorrect RR detections due to artifact may occur).
The small sample size could result in biased cross-validated performance estimates, even if we adopted strategies (feature selection and tree pruning) to avoid overfitting and to increase the generalization ability. A study with a larger dataset would be useful to confirm the generalization of our findings. Unfor-tunately, to the best of the authors’ knowledge, a larger public dataset is not available and the choice of only public databases (and freely available HRV software) enables other researchers to reproduce our results and compare different classification methods.
As regards the imbalanced dataset problem, we adopted a standard approach (oversampling) as a benchmark to compare the proposed method, as previously described.
As regards the sampling frequency of ECG, it should be re-membered that finite sampling frequency introduces an error in the RR interval measurement, as previously shown by Merri et al. [42]. However, a sampling rate of 128 Hz, which is the low-est sampling rate of the recordings used in this paper, has been found to be accurate enough to locate the R-peaks and, hence, compute HRV [5]. Finally, in order to handle unreliable RR interval measurements due to artifacts, following previous stud-ies, the automated outlier removal provided by the adopted soft-ware was performed and a measure of data reliability (NN/RR) was adopted to discard unreliable results, as described in Section II. In the future research, we are planning to develop a similar study on a larger (although nonpublic) dataset of ECG recordings digitalized at the same sampling frequency and an-notated with a stated procedure, i.e., the database of Regione Campania Network [43]. Moreover, nonlinear [44], [45] and/or point process time-frequency [46] analysis could provide addi-tional useful measures for automatic classification. Finally, the classification algorithms could be integrated in portable sensing devices [47]–[49].
We conclude that the long-term HRV measures enable higher risk patients to be distinguished from lower risk ones. The clas-sification trees developed achieved an accuracy rate of 85.4%, a sensitivity rate of 93.3% and a specificity rate of 63.6% (tenfold cross-validation estimates) using the combination of features “TOTPWR, pNN10, pNN50, SDNNIDX” and “ULF, TOTPWR, PNN50.” Finally, our results are consistent with the consensus that depressed HRV values are associated with higher cardiovascular risk.
ACKNOWLEDGMENT
The authors would like to thank Dr. D. Keane for the linguistic revision.
REFERENCES
[1] J. L. Fleg, I. L. Pina, G. J. Balady, B. R. Chaitman, B. Fletcher, C. Lavie, M. C. Limacher, R. A. Stein, M. Williams, and T. Bazzarre, “Assessment of functional capacity in clinical and research applications: An advisory from the committee on exercise, rehabilitation, and prevention, council on clinical cardiology, American heart association,” Circulation, vol. 102, no. 13, pp. 1591–1597, Sep. 26, 2000.
[2] M. M. Redfield, M. Senni, C. M. Tribouilloy, R. J. Rodeheffer, S. J. Jacobsen, J. M. Evans, and K. R. Bailey, “Congestive heart failure in the community—A study of all incident cases in Olmsted County, Minnesota, in 1991,” Circulation, vol. 98, no. 21, pp. 2282–2289, Nov. 24, 1998. [3] M. Gheorghiade, L. Klein, C. M. O’Connor, J. D. Leimberger, W.
Gattis-Stough, I. L. Pina, M. Felker, K. F. Adams, R. M. Califf, and O.-C. In-vestigators, “Lower serum sodium is associated with increased short-term mortality in hospitalized patients with worsening heart failure—Results from the Outcomes of a Prospective Trial of Intravenous Milrinone for Ex-acerbations of Chronic Heart Failure (OPTIME-CHF) study,” Circulation, vol. 111, no. 19, pp. 2454–2460, May 17, 2005.
[4] U. Rajendra Acharya, K. Paul Joseph, N. Kannathal, C. M. Lim, and J. S. Suri, “Heart rate variability: a review,” Med. Biol. Eng. Comput., vol. 44, no. 12, pp. 1031–1051, Dec. 2006.
[5] M. Malik, J. T. Bigger, A. J. Camm, R. E. Kleiger, A. Malliani, A. J. Moss, and P. J. Schwartz, “Heart rate variability: Standards of measurement, physiological interpretation, and clinical use,” Eur. Heart J., vol. 17, no. 3, pp. 354–381, Mar. 1, 1996.
[6] G. Panina, U. N. Khot, E. Nunziata, R. J. Cody, and P. F. Binkley, “Role of spectral measures of heart rate variability as markers of disease pro-gression in patients with chronic congestive heart failure not treated with angiotensin-converting enzyme inhibitors,” Amer. Heart J., vol. 131, no. 1, pp. 153–157, Jan. 1996.
[7] J. E. Mietus, C. K. Peng, I. Henry, R. L. Goldsmith, and A. L. Goldberger, “The pNNx files: Re-examining a widely used heart rate variability mea-sure,” Heart, vol. 88, no. 4, pp. 378–380, Oct. 2002.
[8] T. D. J. Smilde, D. J. van Veldhuisen, and M. P. van den Berg, “Prognostic value of heart rate variability and ventricular arrhythmias during 13-year follow-up in patients with mild to moderate heart failure,” Clin. Res. Cardiol., vol. 98, no. 4, pp. 233–239, Apr. 2009.
[9] J. T. Bigger, J. L. Fleiss, R. C. Steinman et al., “RR variability in healthy, middle-aged persons compared with patients with chronic coronary heart-disease or recent acute myocardial-infarction,” Circulation, vol. 91, no. 7, pp. 1936–1943, Apr. 1, 1995.
[10] S. Guzzetti, R. Magatelli, E. Borroni, and S. Mezzetti, “Heart rate variabil-ity in chronic heart failure,” Auton. Neurosci. Basic Clin., vol. 90, no. 1–2, pp. 102–105, Jul. 20, 2001.
[11] A. Musialik-Lydka, B. Sredniawa, and S. Pasyk, “Heart rate variability in heart failure,” Kardiol. Pol., vol. 58, no. 1, pp. 10–16, Jan. 2003. [12] G. N. Arbolishvili, V. Y. Mareev, Y. A. Orlova, and Y. N. Belenkov,
“Heart rate variability in chronic heart failure and its role in prognosis of the disease,” Kardiologiya, vol. 46, no. 12, pp. 4–11, 2006.
[13] C. Kruger, T. Lahm, C. Zugck, R. Kell, D. Schellberg, M. W. F. Schweizer, W. Kubler, and A. Haass, “Heart rate variability enhances the prognostic value of established parameters in patients with congestive heart failure,” Zeitschrift Fur Kardiol., vol. 91, no. 12, pp. 1003–1012, Dec. 2002. [14] M. T. La Rovere, G. D. Pinna, R. Maestri, A. Mortara, S. Capomolla, O.
Febo, R. Ferrari, M. Franchini, M. Gnemmi, C. Opasich, P. G. Riccardi, E. Traversi, and F. Cobelli, “Short-term heart rate variability strongly pre-dicts sudden cardiac death in chronic heart failure patients,” Circulation, vol. 107, no. 4, pp. 565–570, Feb. 4, 2003.
[15] D. Aronson, M. A. Mittleman, and A. J. Burger, “Measures of heart pe-riod variability as predictors of mortality in hospitalized patients with decompensated congestive heart failure,” Amer. J. Cardiol., vol. 93, no. 1, pp. 59–63, Jan. 1, 2004.
[16] Y. Isler and M. Kuntalp, “Combining classical HRV indices with wavelet entropy measures improves to performance in diagnosing congestive heart failure,” Comput. Biol. Med., vol. 37, no. 10, pp. 1502–1510, Oct. 2007.
[17] M. Hadase, A. Azuma, K. Zen, S. Asada, T. Kawasaki, T. Kamitani, S. Kawasaki, H. Sugihara, and H. Matsubara, “Very low frequency power of heart rate variability is a powerful predictor of clinical prognosis in patients with congestive heart failure,” Circ. J., vol. 68, no. 4, pp. 343–347, Apr. 2004.
[18] G. C. Casolo, P. Stroder, A. Sulla, A. Chelucci, A. Freni, and M. Zer-auschek, “Heart-rate-variability and functional severity of congestive-heart-failure secondary to coronary-artery disease,” Eur. Heart J., vol. 16, no. 3, pp. 360–367, Mar. 1995.
[19] S. N. Yu and M. Y. Lee, “Conditional mutual information-based feature selection for congestive heart failure recognition using heart rate variabil-ity,” Comput. Methods Programs Biomed., vol. 108, no. 1, pp. 299–309, Oct. 2012.
[21] P. Melillo, R. Fusco, M. Sansone, M. Bracale, and L. Pecchia, “Discrimina-tion power of long-term heart rate variability measures for chronic heart failure detection,” Med. Biol. Eng. Comput., vol. 49, no. 1, pp. 67–74, 2011.
[22] L. Pecchia, P. Melillo, and M. Bracale, “Remote health monitoring of heart failure with data mining via CART method on HRV features,” IEEE Trans. Biomed. Eng., vol. 58, no. 3, pp. 800–804, Mar. 2011.
[23] G. Guidi, E. Iadanza, M. Pettenati, M. Milli, F. Pavone, and G. Biffi Gen-tili, “Heart failure artificial intelligence-based computer aided diagnosis telecare system impact analysis of solutions for chronic disease prevention and management,” in Lecture Notes in Computer Science, M. Donnelly, C. Paggetti, C. Nugent, et al., Eds. Berlin/Heidelberg, Germany: Springer, 2012, pp. 278–281
[24] Y. Guiqiu, R. Yinzi, P. Qing, N. Gangmin, G. Shijin, C. Guolong, Z. Zhaocai, L. Li, and Y. Jing, “A heart failure diagnosis model based on support vector machine,” in Proc. 3rd Int. Conf. Biomed. Eng. Inf. (BMEI 2010), pp. 1105–1108.
[25] L. Breiman, Classification and Regression Trees. Belmont, CA, USA: Wadsworth International Group, 1984.
[26] F. Esposito, D. Malerba, and G. Semeraro, “A comparative analysis of methods for pruning decision trees,” IEEE Trans. Pattern Anal. Mach. Intell., vol. 19, no. 5, pp. 476–491, May 1997.
[27] F. Roche, J.-M. Gaspoz, I. Court-Fortune, P. Minini, V. Pichot, D. Duver-ney, F. Costes, J.-R. Lacour, and J.-C. Barthelemy, “Screening of obstruc-tive sleep apnea syndrome by heart rate variability analysis,” Circulation, vol. 100, no. 13, pp. 1411–1415, Sep. 28, 1999.
[28] L. Pecchia, P. Melillo, and M. Bracale, “Remote health monitoring of heart failure with data mining via CART method on HRV features,” IEEE Trans. Biomed. Eng., vol. 58, no. 3, pp. 800–804, Mar. 2011.
[29] K. Sotiris, K. Dimitris, and P. Panayiotis, “Handling imbalanced datasets: A review,” GESTS Int. Trans. Comput. Sci. Eng., vol. 30, no. 1, pp. 25–36, 2006.
[30] Z. Zheng, X. Wu, and R. Srihari, “Feature selection for text categorization on imbalanced data,” SIGKDD Explor. Newslett., vol. 6, no. 1, pp. 80–89, 2004.
[31] J. R. Quinlan, “Improved use of continuous attributes in C4.5,” J. Artif. Intell. Res., vol. 4, pp. 77–90, 1996.
[32] L. Breiman, “Random forests,” Mach. Learn., vol. 45, no. 1, pp. 5–32, 2001.
[33] K. J. Cios and G. W. Moore, “Uniqueness of medical data mining,” Artif. Intell. Med., vol. 26, no. 1–2, pp. 1–24, Sep./Oct. 2002.
[34] A. L. Goldberger, L. A. N. Amaral, L. Glass, J. M. Hausdorff, P. C. Ivanov, R. G. Mark, J. E. Mietus, G. B. Moody, C.-K. Peng, and H. E. Stanley, “PhysioBank, PhysioToolkit, and PhysioNet : Components of a new research resource for complex physiologic signals,” Circulation, vol. 101, no. 23, pp. e215–e220, Jun. 13, 2000.
[35] Lomb, “Least-squares frequency analysis of unequally spaced data (in astronomy),” Astrophys. Space Sci., vol. 39, pp. 447–462, 1976. [36] P. Laguna, G. B. Moody, and R. G. Mark, “Power spectral density of
unevenly sampled data by least-square analysis: Performance and appli-cation to heart rate signals,” IEEE Trans. Biomed. Eng., vol. 45, no. 6, pp. 698–715, Jun. 1998.
[37] W. H. Press and G. B. Rybicki, “Fast algorithm for spectral analysis of unevenly sampled data,” Astrophys. J., vol. 338, pp. 277–280, 1989. [38] J. T. Bigger, J. L. Fleiss, R. C. Steinman, L. M. Rolnitzky, R. E. Kleiger, and
J. N. Rottman, “Correlations among time and frequency-domain measures of heart period variability 2 weeks after acute myocardial-infarction,” Amer. J. Cardiol., vol. 69, no. 9, pp. 891–898, Apr. 1, 1992.
[39] A. K. Jain, R. P. W. Duin, and M. Jianchang, “Statistical pattern recogni-tion: a review,” IEEE Trans. Pattern Anal. Mach. Intell., vol. 22, no. 1, pp. 4–37, Jan. 2000.
[40] G. D. Clifford and L. Tarassenko, “Quantifying errors in spectral estimates of HRV due to beat, replacement and resampling,” IEEE Trans. Biomed. Eng., vol. 52, no. 4, pp. 630–638, Apr. 2005.
[41] H. Shuli, Y. Bo, and L. Wenhuang, “Rare class mining: progress and prospect.” pp. 1–5.
[42] M. Merri, D. C. Farden, J. G. Mottley, and E. L. Titlebaum, “Sampling frequency of the electrocardiogram for spectral analysis of the heart rate variability,” IEEE Trans. Biomed. Eng., vol. 37, no. 1, pp. 99–106, Jan. 1990.
[43] P. Melillo, R. Izzo, N. Luca, and L. Pecchia, “Heart rate variability and target organ damage in hypertensive patients,” BMC Cardiovasc. Disord., vol. 12, no. 1, p. 105, Nov. 15, 2012.
[44] P. Melillo, M. Bracale, and L. Pecchia, “Nonlinear Heart Rate Variability features for real-life stress detection. Case study: Students under stress
due to university examination,” Biomed. Eng. Online, vol. 10, no. 1, p. 96, Nov. 7, 2011.
[45] Y. L. Ho, C. Lin, Y. H. Lin, and M. T. Lo, “The prognostic value of non-linear analysis of heart rate variability in patients with congestive heart failure—A pilot study of multiscale entropy,” PLoS One, vol. 6, no. 4, p. e18699, 2011.
[46] S. Kodituwakku, S. Lazar, P. Indic et al., “Point process time–frequency analysis of dynamic respiratory patterns during meditation practice,” Med. Biol. Eng. Comput., vol. 50, no. 3, pp. 261–275, 2012.
[47] R. R. Fletcher, K. Dobson, M. S. Goodwin, H. Eydgahi, O. Wilder-Smith, D. Fernholz, Y. Kuboyama, E. B. Hedman, P. Ming-Zher, and R. W. Picard, “iCalm: Wearable sensor and network architecture for wirelessly communicating and logging autonomic activity,” IEEE Trans. Inf. Technol. Biomed., vol. 14, no. 2, pp. 215–223, Mar. 2010.
[48] A. M. Bianchi, M. O. Mendez, and S. Cerutti, “Processing of signals recorded through smart devices: Sleep-quality assessment,” IEEE Trans. Inf. Technol. Biomed., vol. 14, no. 3, pp. 741–747, May 2010.
[49] M. Peltokangas, J. Verho, and A. Vehkaoja, “Night-time EKG and HRV monitoring with bed sheet integrated textile electrodes,” IEEE Trans. Inf. Technol. Biomed., vol. 16, no. 5, pp. 935–942, Sep. 2012.
Paolo Melillo (M’12) was born in Naples, Italy, on
June 29, 1985. He received the M.Sc. degree (Hons.) in 2008 in biomedical engineering and the Ph.D. de-gree in 2012 from the University of Naples “Federico II,” Naples.
He is Research Fellow at the Dipartimento Mul-tidisciplinare di Specialit`a Medico-Chirurgiche e Odontoiatriche of the Second University of Naples, Naples, Italy. He has authored or coauthored about 30 journal and conference papers in the fields of data mining applied to health information, health manage-ment, telemedicine, and signal and image processing.
Dr. Melillo is a member of the IEEE Engineering in Medicine and Biology Society, the Italian Association of Medical and Biological Society, the Interna-tional Federation of Medical and Biological Society, and the Italian Mathemat-ical Union.
Nicola De Luca, photograph and biography not available at the time of publication.
Marcello Bracale, photograph and biography not available at the time of
publication.
Leandro Pecchia was born in Naples, Italy. He
re-ceived the Laurea degree in 2005 in electrical en-gineering and the Ph.D. degree in 2009 in health economy from the University of Naples “Federico II,” Naples.
He is Research Fellow at the Department of Elec-trical and Electronic Engineering, University of Not-tingham, NotNot-tingham, U.K. He has authored or coau-thored about 30 journal and conference papers in the fields of data mining, telemedicine, health technology assessment, and medical informatics. Since 2012, he has been the Treasurer of the Health Technology Assessment Division of the International Federation of Medical and Biological Engineering.