Prescription Side Effect Discovery
Jenna Reps, Student Member, IEEE,
A Novel Semi-Supervised Algorithm for Rare
Prescription Side Effect Discovery
Abstract
Drugs are frequently prescribed to patients with the aim of improving each patient’s medical state, but
an unfortunate consequence of most prescription drugs is the occurrence of undesirable side effects. Side
effects that occur in more than one in a thousand patients are likely to be signalled efficiently by current
drug surveillance methods, however, these same methods may take decades before generating signals for
rarer side effects, risking medical morbidity or mortality in patients prescribed the drug while the rare
side effect is undiscovered. In this paper we propose a novel computational meta-analysis framework for
signalling rare side effects that integrates existing methods, knowledge from the web, metric learning
and semi-supervised clustering. The novel framework was able to signal many known rare and serious
side effects for the selection of drugs investigated, such as tendon rupture when prescribed Ciprofloxacin
or Levofloxacin, renal failure with Naproxen and depression associated with Rimonabant. Furthermore,
for the majority of the drug investigated it generated signals for rare side effects at a more stringent
signalling threshold than existing methods and shows the potential to become a fundamental part of post
marketing surveillance to detect rare side effects.
Index Terms
A Novel Semi-Supervised Algorithm for Rare
Prescription Side Effect Discovery
I. INTRODUCTION
Negative side effects caused by prescribed medication currently present a huge burden for the healthcare
service in terms of causing both patient morbidity or mortality and costing large sums of money [1] [2]
[3]. Investigations have shown that the rate of unwanted side effects has been increasing annually [4] [5].
Possible reasons for this are an increase in the number of annual prescriptions due to an aging population
or an increase in polypharmacy, when numerous drugs are prescribed at the same time [6]. Although it is
common for a patient to develop side effects due to prescribed medication there is currently no efficient
means of identifying all the side effects of a drug. When the side effect is detrimental to the patient’s
quality of life, it is often referred to as an Adverse Drug Event (ADE) and when the drug causing the
ADE is known, it is termed an Adverse Drug Reaction (ADR). A study conducted in the UK between
November 2001 to April 2002 indicated that 6.5% of admissions to hospital were due to ADRs, with
the mortality rate for an ADR patient of 2.3% [7]. Interestingly, it was found that over 70% of these
ADRs were potentially avoidable. A more recent study in Brazil suggests ADRs may be the cause of
an even higher proportion of hospital admissions for the elderly as it showed that ADRs were the cause
of hospitalisation for over 50% of elderly patients [8]. It also highlighted that a significant factor for
developing an ADR was polypharmacy [8], when patients are prescribed multiple drugs.
Some obvious ADRs can be discovered during the experimental stages of a drug’s development, but
the occurrence of an ADR can depend on a magnitude of factors and it is impossible to investigate all
the possible situations that may occur when the drug is taken. For example, testing for ADRs that result
from polypharmacy would require clinical trials with millions of people to be able to investigate all the
different drug combinations and this is not possible. Due to the limitations of clinical trials, rare ADRs,
including fatal ones, are in most circumstances not discovered before a drug is marketed [9] [10]. As a
consequence, after a drug is approved and available to patients, possible ADRs are investigated during
the whole lifetime of a drug by a process known as post-marketing drug surveillance.
Post-marketing surveillance (such as doctors being vigilant and noticing possible drug and illness
associations) can identify common ADRs and in general the more common the ADR is, the fewer the
occur for drugs that are rarely prescribed or rare ADRs may go unnoticed by medical practitioners and
may cause morbidity or mortality in patients that could have been prevented with more efficient drug
surveillance methods. For example, it took 23 years before there was sufficient evidence that the drug
Tamoxifen used to treat breast cancer caused endometrial cancer in about 1 in 6000 patients [11] [12].
Current methods to discover rare ADRs often involve using a Spontaneous Reporting System (SRS)
database that contains a collection of voluntary suspected drug and ADR reports, such as the database
containing information from the UK yellow card scheme. The algorithms that signal ADRs by mining
SRS databases calculate a measure of how disproportionally more often the medical event is reported
with a specific drug of interest compared with any drug. The frequently implemented measures of
dispro-portionality involve using standard epidemiology measures [13], estimating the information component
using a neural network approach [14] or calculating a modified version of the relative risk by applying a
Bayesian model [15]. SRS databases combine reports of possible ADRs from a large population enabling
the identification of possible ADR signals more efficiently, but they are known to suffer from
under-reporting [16] and this causes a lag in the time it takes to confidently signal a potential ADR. The
under-reporting may also prevent the detection of rare ADRs, as these ADRs may never be suspected
and therefore never be reported to an SRS database.
A potential new way to detect the rare ADRs that cannot be identified by doctors or by current methods
applied to SRS databases is to use The Health Improvement Network (THIN) database
(www.thin-uk.co.uk), an Electronic Healthcare Database (EHD) containing complete UK General Practice records
for registered patients. The THIN database contains all medical events (such as illnesses, laboratory
results, signs and symptoms or administrative events) that a doctor is informed of for a patient as well
as their complete prescription histories. Therefore, any rare ADRs that are serious enough to be reported
to a doctor are more likely to be detected at an earlier point in time by applying a suitable data mining
method on the THIN database rather than mining the SRS databases.
Existing methods developed for the EHDs are often disproportionality based methods (methods that
contrast how often the event of interest occurs after the specified drug relative to how often the event
of interest occurs after any drug) similar to the SRS methods [17] [18] [19] or association rule mining
methods [20] [21] [22]. As EHDs do not contain links between drugs and suspected ADRs these are often
inferred by investigating medical events that occur within some time period around a drug, but many of
these medical events are linked to the cause of taking the drug and these ‘therapeutically related’ medical
events present a major issue with the majority of the existing methods. It has been demonstrated that
ADRs that are unlikely to be detected by mining SRS databases, due to under-reporting, so developing
an algorithm that can signal rare ADRs using the THIN database would be beneficial.
In this paper we develop a novel computational meta-analysis framework that integrates the existing
methods (MUTARA, HUNT, OE ratio, see section III-A) and uses information obtained from the internet
to efficiently and accurately identify rare ADRs that occur immediately or shortly after a drug is
prescribed. The framework uses the dependency measures obtained from some of the existing electronic
healthcare based methods and novel values of interest as attributes for each medical event that occurs
within a 30 day period after the drug of interest is prescribed for any patient. After the attributes are
generated for each medical event we label some of the medical events by extracting information from the
internet informing us of the indicator events and known ADRs for the drug of interest. The unlabelled
medical events then have labels assigned by applying metric learning and semi-supervised clustering.
Finally using the labels we develop a novel filter that removes medical events labelled as indicator events
and then return the remaining medical events ordered by how often they occurred unpredictably within
30 days after the drug being investigated multiplied by weights based on their assigned labels.
The continuation of this paper is as follows, section II contains the background information on the
THIN database and section III describes the problem formulation. This is followed by the description of
the novel methodology we developed that is able to identify rare ADRs in section IV. Section V contains
the results of comparing our novel algorithm with a section of existing methods for the detection of
known rare ADRs and the discussion of these results is contained in section VI. The paper finishes with
the conclusion and future work suggestions in section VII.
II. THIN DATABASE
The THIN database contains complete medical and prescription records for registered patients at
participating general practices within the UK. The medical information is recorded into the THIN database
by Read Codes that correspond to illnesses, so each Read Code is paired with the illness description.
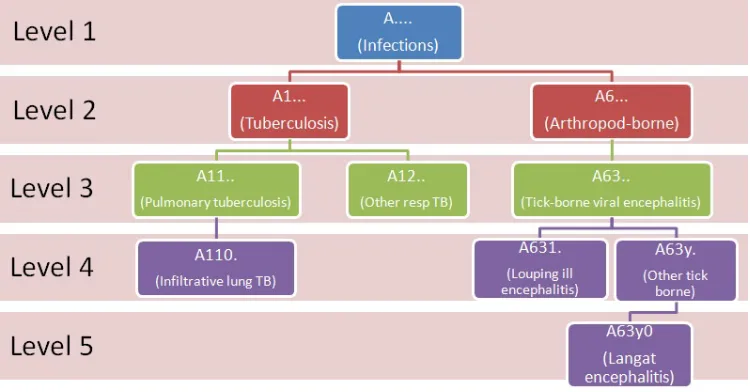
Each Read Code is five elements long and the Read Codes have a tree structure. A level one Read Code
has ‘.’ as it’s second element and corresponds to a very general description of an illness, for example
‘A....’ is a level one Read Code that corresponds to ‘Infections’. A level two Read Code has ‘.’ for it’s
third element but not for it’s second element, an example is ‘A1...’ corresponding to ‘Tuberculosis’. A
level two Read Code is the child of the level one Read Code with a matching first element, so ‘A1...’ is
Fig. 1: Example of a branch in the Read Codes tree.
version of it’s parent’s illness. Fig (1) shows examples of different branches of the Read Code tree with
the illness becoming more specific as the Read Code level increases.
Each drug is recorded into the THIN database by a drugcode (sometimes called the multilexeid) that
is paired to the generic name. The drugcode consists of nine numbers and does not have a structure we
use but the drugcode does specify the way the drug is ingested and the dosage. Each entry also includes
the date that a Read Code or drugcode is recorded but does not contain the time. In this paper we
used a subset of the THIN database containing records from 495 general practices. The subset contained
approximately four million patients, over 358 million prescription entries and over 233 million medical
event entries.
Patients can register at a new practice at any point over their lifetime and it has been shown that
statistical studies using the THIN database will be biased if records from the first year after registration
for a patient are included in the study [24]. The reason for this is that newly registered patients will need
to inform their new doctor of any chronic illnesses they have, but these illnesses will be recorded on
the day they inform the doctor of them rather than the actual day they were discovered. To prevent bias
in this study we do not include the first year of a patient’s medical records since registration. We also
ignore the last 30 days of prescription records for each patient to reduce potential under reporting that
may occur by including patients with less than 30 days of medical records after the first prescription of
TABLE I: Examples of both a medical table and prescription table containing the patients records. The
column patID is a unique reference corresponding to a patient, the age is the patient’s age in days when
the entry was recorded and the Read Code/drugcode is the reference to the specific medical event or
prescription respectively.
Drug Table Medical Table
patID age drugcode patID age Read Code
jj3 10000 979596759 jj3 9999 A123.
jj3 20000 969686881 jj3 10000 F1...
jj3 20001 969686881 jj3 10000 C1...
jj3 20001 912314611 jj3 10001 A123.
aa2 15001 912314611 jj3 10013 D25..
aa2 15031 912314611 jj3 18020 C12..
aa2 15061 912314611 jj3 20001 C121.
aa2 25304 912314611 aa2 15001 B21..
bb8 10000 979596759 bb8 9078 A123.
bb8 10000 F12..
bb8 10000 A123.
bb8 10010 D25..
bb8 27002 C11..
III. PROBLEM FORMULATION
The focus of this paper is to develop a method for detecting rare ADRs that occur shortly after
prescription, so we can restrict our attention to the medical events that occur around the time of the drug
prescription. In this paper we consider the natural numbers Nto include 0and use the interval [a...b]to
be the interval of natural numbers from ato b({n∈N:a≤n≤b}).
If we let M denote the set of Read Codes, D denote the set of drugcodes and Ω denote the set of
patients in the THIN database then the sequence of Read Codes or the sequence of drugcodes for a
patient can be represented as two discrete functions. The discrete function representing a patient’s Read
Code sequence is a mapping fM : N×Ω → P(M);fM(t, ω) → eω,t where t is the age in days of
the patient ω and eω,t is the set of Read Codes that are recorded into the THIN database for patient
ω when they are t days old. Similarly, the discrete function representing a patient’s drugcode sequence
is fD : N×Ω → P(D);fD(t, ω) → dω,t where dω,t is the set of drugcodes recorded in THIN for the
Using the example THIN database entries shown in Table I, we have,
M ={A123., B21., C1..., C11.., C12.., C121., D25.., F1..., F12..}
D={979596759,969686881,912314611}
Ω ={jj3, aa2, bb8}
(1)
The set of Read Codes that patient jj3 has recorded when he is 9999, 10000 and 10002 days old are
fM(9999, jj3) ={A123.},fM(10000, jj3) ={F1..., C1...}andfM(10002, jj3) ={}=∅respectively.
The reason fM(10002, jj3) ={}=∅ is that patient jj3 does not have a Read Code recorded when he
is 10002 days old. Similarly, the set of drugcodes that patient jj3 has recorded when he is 10000 and
10002 days old arefD(10000, jj3) ={979596759} andfD(10002, jj3) ={}=∅ respectively.
The set consisting of every age in days where patient ω has a drugcode recorded into the THIN
database is,
AD(ω) ={t|fD(t, ω)6=∅} (2)
The set of all drugs that are prescribed for patientω is the finite union of the set of drugcodes recorded
daily for the patient while they are active in the THIN database, ∪fD(t, ω) t∈AD(ω)
, so to determine the age that
patientω is first prescribed the drug of interest d∗ ∈D we first find the set of ages that the patient was
prescribed the drug,
α(ω, d∗) ={t∈AD(ω)|d∗∈fD(t, ω)} (3)
and then define a new function α1 : Ω×D→N∪ {−1}:
α1(ω, d∗) =
min(α(ω, d∗)) if d∗ ∈ ∪
t∈AD(ω)
fD(t, ω)
−1 else
(4)
that finds the minimum age that the patient is prescribed the drug or returns−1 if the patient has never
been prescribed the drug. The set of patient’s ages where the drug is prescribed for the first time in 13
months is determined by the function αˆ: Ω×D→ P(N∪ {−1}),
ˆ
α(ω, d∗) ={t∈α(ω, d∗)|(t−s∗)≥386, s∗ = argmin
s∈α(ω,d∗)
s<t
(t−s)} ∪α1(ω, d∗) (5)
If a patient is not prescribed the drug then the function returns−1otherwise it returns the set of ages in
days that the patient took the drug and had a minimum of 386 days between previously taking the drug.
For the example entries in Table I, the set of ages in days that patient jj3 is prescribed any drugs
specific drugs 979596759 and 969686881 is α(jj3,979596759) = {10000} and α(jj3,969686881) =
{20000,20001}respectively. The minimum age that patientjj3is prescribed969686881isα1(jj3,969686881) =
20000but as the patientaa2is never prescribed the drug969686881,α1(aa2,969686881) =−1. The
pa-tientaa2is prescribed the drug912314611four times (α(aa2,912314611) ={15001,15031,15061,25304})
with the first prescription occurring at 15001 days old (α1(aa2,912314611) = 15001) but the drug was
then repeated monthly two times and then the patient had a10243day break before being prescribed the
drug for the final time, therefore the set of ages in days that patient aa2 is prescribed drug912314611
for the first time in 13 months is α(aa2,ˆ 912314611) ={15001,25304} as the instances when the drug
was repeated after30 days are not included.
In the continuation of this paper we will use α(ω, d∗)ˆ k to refer to thekth time patient ω is prescribed
drug d∗ for the first time in 13 months, so α(ω, d∗)ˆ 1 < α(ω, d∗)ˆ 2 < ... < α(ω, d∗)ˆ n−1 < α(ω, d∗)ˆ n,
wherenis the total number of times patient ωis prescribed drugd∗ for the first time in 13 months (n=
|ˆα(ω, d∗)|). Following on with our example, α(aa2,ˆ 912314611)1 = 15001 and α(aa2,ˆ 912314611)2 =
25304.
This then enables us to define a interval of interest around each time the patient is prescribed a drug
for the first time in 13 months, for each K≤ |α(ω, d∗)|,ˆ
T(ω, d∗, t1, t2)K =
[( ˆα(ω, d∗)K+t1)...( ˆα(ω, d∗)K+t2)] ifα(ω, d∗)ˆ K 6=−1
∅ else
(6)
Equation (6) is defining a time interval centred around the Kthtime drugd∗is prescribed for the first time in 13 months for patientω determine by the integerst1 andt2. For example, if we wanted to investigate
the 30 days after a prescription we would use t1 = 1 and t2 = 30 and the time period around the first
prescriptions in 13 months of drug 912314611 for patient aa2 would be T(aa2,912314611,1,30)1 =
[( ˆα(aa2,912314611)1+1)...( ˆα(aa2,912314611)1+30)] = [(15001+1)...(15001+30)] = [(15002)...(15031)]
andT(aa2,912314611,1,30)2 = [( ˆα(aa2,912314611)2+ 1)...( ˆα(aa2,912314611)2+ 30)] = [(25304 +
1)...(25304 + 30)] = [(25305)...(25334)]. If the patient is never prescribed the drug then the time period
of interest is the empty set, for example T(aa2,979596759,1,30)1 =∅.
As the function fM(t, ω) returns a set of Read Codes that are recorded into the THIN database for
patient ω when they are t days old, we can find the set of ages in days that ω has any Read Code
recorded,
and the finite union over each t∈AM(ω), ∪fM(t, ω) t∈AM(ω)
, is the set of all Read Codes that are recorded into
the THIN database for the patient ω. It follows that ∪fM(t, ω)
t∈T(ω,d∗,t1,t2)K
is the set of all Read Codes that are
recorded into the THIN database for the patient ω during the period of interest determined by t1 andt2
around the Kth prescription of drugd∗. The function h:M×D×Ω×Z2 → {0,1},
h(ei, d∗, ω, t1, t2) =1{ei∈ ∪ t∈T(ω,d∗,t1,t2)1
fM(t, ω)} (8)
is one if the patientω has the Read Codeei recorded within the time period of interest around the first
prescription of drugd∗ and zero otherwise. To determine the number of times the drug d∗ is prescribed
to patient ω for the first time in 13 months and the Read Codeei is recorded within the time period of
interest we define another function ˆh:M×D×Ω×Z2 → N,
ˆ
h(ei, d∗, ω, t1, t2) =
X
K≤|αˆ(ω,d∗)|
1{ei∈ ∪
t∈T(ω,d∗,t1,t2)K
fM(t, ω)} (9)
The total number of patients in the THIN database that have Read Code ei recorded within the time
period of interest centred around the first prescription of drug d∗ is then,
X
ω∈Ω
h(ei, d∗, ω, t1, t2) (10)
and the total number of first times prescriptions of drug d∗ in 13 months where the Read Code ei is
recorded within the time period centred around the prescription determined by t1 andt2 is,
X
ω∈Ω
ˆ
h(ei, d∗, ω, t1, t2) (11)
A. Existing Algorithms
The observed to expected (OE) ratio [17] calculates the information component (IC) that looks at the
disproportionality between how often a Read Code is recorded within some time period after the first
prescription in 13 months of the drug of interest compared to how often it is recorded within the same
time period after the first prescription in 13 months of any drug but also adds a bias lowering the IC
value if the Read Code or drug is rare.
The function used to test if a set of medical events is empty is, Hˆ :P(M)→ {0,1},
ˆ H[B] =
0 ifB =∅
1 else
using the above function, we define the following values,
nd∗ei(t1, t2) = X
ω∈Ω
ˆ
h(ei, d∗, ω, t1, t2)
n•ei(t1, t2) = X
d∈D
X
ω∈Ω
ˆ
h(ei, d, ω, t1, t2)
nd∗•(t1, t2) = X
ω∈Ω
|αˆ(ω,d∗)| X
K=1
ˆ
H[M∩( ∪fM(t, ω) t∈T(ω,d∗,t1,t2)K
)]
n••(t1, t2) = X
d∈D
X
ω∈Ω
|αˆ(ω,d)|
X
K=1
ˆ
H[M∩ ∪fM(t, ω)
t∈T(ω,d,t1,t2)K
]
(13)
Wherend∗ei(0,30)is the number of times that event ei occurs in the month after a first prescriptions in
13 months of drug d∗, n.ei(0,30) is the number of times that event ei occurs in the month after a first
prescriptions in 13 months of any drug, nd∗.(0,30) is the number of times a drug d∗ is prescribed for
the first time in 13 months and has any follow up in the month after the prescription and n..(0,30) is
the number of times any drug is prescribed for the first time in 13 months and has any follow up in the
month after the prescription.
The expected number of first time prescriptions of drug d∗ in 13 months that have the Read Code ei
occur within the time period defined byt1 and t2 if the Read Code occurs independently of the drug is,
Ed∗ei(t1, t2) =
nd∗•(t1, t2)n•ei(t1, t2)
n••(t1, t2)
(14)
and theIC(t1, t2, ei, d∗) value calculates how many first prescription in 13 months of drug d∗ have the
Read Code ei occurring between t1 and t2 days after divided by the expected value if the Read Code
and drug occur independently,
IC(t1, t2, ei, d∗) = log2(
nd∗ei(t1, t2) + 1/2
Ed∗ei(t1, t2) + 1/2
) (15)
The value of a half added to both the numerator and denominator in theIC(t1, t2, ei, d∗)value calculation
creates a bias that causes theIC(t1, t2, ei, d∗) value to tend to zero when the Read Code or drug occurs
rarely.
TheIC∆is a measure that compares theIC(0,30, ei, d∗)corresponding to the time period of a month
after the first prescription in 13 months compared to theIC(−810,−630, ei, d∗) corresponding to a time
period between 27 and 21 months prior to the prescription.
IC∆(ei, d∗) = log2(
nd∗ei(0,30) + 1/2
Ed∗
∗ei(0,30) + 1/2
where,
Ed∗∗,ei(0,30) = nd∗ei(−810,−630)Ed∗ei(0,30)
Ed∗ei(−810,−630)
When investigating possible ADRs for drug d∗ the authors use a filter to remove any Read Codes ei
if the IC(−30,−1, ei, d∗) > IC(0,30, ei, d∗) or IC(0,0, ei, d∗) > IC(0,30, ei, d∗), these correspond
to the IC value the month prior to the prescription being higher than the month after prescription, or
the IC value on the day of prescription being higher than a month after. In this paper we will use the
IC∆(ei, d∗) as described above as an attribute for each possible drug and Read Code combination and
use the Heaviside step functionH :R→ {0,1},
H[n] =
0 if n≤0
1 if n >0
to define the filter functions,
ζ1(ei, d∗) =H[IC(−30,−1, ei, d∗)−IC(0,30, ei, d∗)]
ζ2(ei, d∗) =H[IC(0,0, ei, d∗)−IC(0,30, ei, d∗)]
(17)
as two addition binary attributes.
The algorithm Mining Unexpected Temporary Association Rules given the Antecedent (MUTARA)
[21] applies a case control approach that estimates the background rate that the Read Code is recorded
into the THIN database by finding out how many patients who have not been prescribed the drug of
interest have the Read Code recorded during a random time interval. MUTARA aims to find Unexpected
Temporary Association Rules (UTARs) by investigating how many patients have a specific Read Code
unexpectedly recorded within a period of interest centred on the first prescriptions of the drug being
studied. The algorithm Highlighting UTARs Negating TARs (HUNT) [22] was developed by the same
authors as MUTARA and applies a similar method but is less prone to ranking therapeutic failure Read
Codes (Read Codes linked to the cause of taking the drug) above Read Codes corresponding to ADRs.
MUTARA and HUNT both investigate the Read Codes that occur during the month after the drug being
studied is first prescribed to a patient or the union of the month after the first and second prescriptions
of the drug if it is repeated within a month of the first prescription. Previously we defined α(ω, d∗) to
be the ages in days that patient ω is prescribed the drug d∗ and α1(ω, d∗)) to be the age in days that
patient ω is first prescribed the drug d∗, so the set α(ω, d∗)\α1(ω, d∗) contains the ages that patientω
is prescribed drug d∗ except the age when they are first prescribe the drug. Using this we define a new
this is within a month of the first prescription or the patient’s age in days for the first time the drug is
prescribed if the second prescription is not within a month of the first.
α2(ω, d∗) =
min{s∈α(ω, d∗)\α1(ω, d∗)} if ∃t∈α(ω, d∗)\α1(ω, d∗) s.t |t−α1(ω, d∗)|<30
α1(ω, d∗) else
(18)
MUTARA uses patients that have not been prescribed the drug (so α1(ω, d∗) =−1) to estimate the
background rate that the Read Code is prescribed into the THIN database. For each patient that has
never been prescribed the drug d∗, a random time interval is chosen within the age that the patient
first has any Read Code recorded and the age that a Read Code is last recorded, min(AM(ω)) and
max(AM(ω)) respectively, where we defined AM(ω) previously to be the set of ages that patient ω
has a Read Code recorded into the THIN database. If a patient has never had a Read Code recorded
into the THIN database (AM(ω) = ∅) or only had Read Codes recorded for the short period of time
(max(AM(ω))−min(AM(ω)) < |t2−t1|) then the patient is not used in this study as they are not
an active patient and may bias results. The time interval of length |t2−t1|is chosen uniformly within
[min(AM(ω))...max(AM(ω))].
Putting this all together, the time interval of interest around the first prescription of drugd∗ for patients
prescribed the drug or the time interval chosen at random for patients who have never been prescribed
the drug used by MUTARA is,
TM(ω, d∗, t1, t2) =
[(α1(ω, d∗) +t1)...(α2(ω, d∗) +t2)] if α1(ω, d∗)6=−1
[(min(AM(ω)) +r)...(min(AM(ω)) +r+|t2−t1|)] else
(19)
where,
r ∼U(0,max(AM(ω))−min(AM(ω))− |t2−t1|) (20)
For patients who are prescribed the drug d∗ a filter is applied to ignore any ‘expected’ Read Codes
that are recorded within the time interval of interest after the first prescription of the drug. A Read Code
is ‘expected’ for the patient during the time interval of interest after the drug is prescribe if the patient
also had the Read Code recorded withint3 ∈N days prior to drug being prescribed. We define this time
interval prior to the prescription as,
Tf ilt(ω, d∗, t3) =
[(α1(ω, d∗)−t3)...(α1(ω, d∗)−1)] ifα1(ω, d∗)6=−1
∅ else
We then find how many patients have each Read Code recorded ‘unexpectedly’ during the time interval
of interest after the drug by,
h∗(ei, d∗, ω, t1, t2, t3) =1{ei ∈ ∪fM(t, ω) t∈TM(ω,d∗,t1,t2)
}(1−1{ei∈ ∪fM(t, ω) t∈Tf ilt(ω,d∗,t3)
}) (22)
The Heaviside step function applied to α1(ω, d∗) returns1 if patient ω has been prescribed the drugd∗,
as in that caseα1(ω, d∗)>0 or returns0 if patientω has never been prescribed the drugd∗. MUTARA
then calculates the unexpected-leverage as,
uL(ei, d∗) =
P
ω∈Ω[h
∗(e
i, d∗, ω, t1, t2, t3)×H[α1(ω, d∗)]]
|Ω| −
P
ω∈ΩH[α1(ω, d∗)]
|Ω|
P
ω∈Ωh
∗(e
i, d∗, ω, t1, t2, t3)
|Ω|
(23)
where the fraction of patients in the database who have the drug multiplied by the fraction of patients
who have the Read Code recorded during their interval of interest is subtracted from the fraction of
patients in the database who have the Read Code recorded within a month of the first time the drug is
prescribed (or up to a month after the second prescription if the drug is repeated within a month).
HUNT calculates a similar value to the unexpected-leverage known as the leverage that does not include
a filter to remove ’expected’ Read codes based on a patient’s history,
h∗∗(ei, d∗, ω, t1, t2) =1{ei∈ ∪ t∈TM(ω,d∗,t1,t2)
fM(t, ω)} (24)
and
L(ei, d∗) =
P
ω∈Ω[h
∗∗(e
i, d∗, ω, , t1, t2)×H[α1(ω, d∗)]]
|Ω| −
P
ω∈ΩH[α1(ω, d∗)]
|Ω|
P
ω∈Ωh
∗∗(e
i, d∗, ω, , t1, t2)
|Ω|
(25)
HUNT then ranks the Read Codes in descending order of the leverage to attain the leverage rank and in
descending order of the unexpected-leverage to attain the unexpected-leverage rank and then calculates
the rank ratio between the leverage rank and unexpected-leverage rank. Finally, HUNT returns the Read
codes in descending order of this rank ratio.
B. Novel Algorithm Attributes
The attributes of interest for detecting ADRs are how many patients have the Read Code recorded a
month prior to the first prescription compared with how many patients have it recorded a month after,
ABratio30(ei, d∗) =
P
ω∈Ωh(ei, d∗, ω,1,30)
P
ω∈Ωh(ei, d∗, ω,−30,−1)
a similar attribute considers the ratio between the number of patients who have the Read Code recorded
a year after compared to a year before,
ABratio365(ei, d∗) =
P
ω∈Ωh(ei, d∗, ω,1,365) P
ω∈Ωh(ei, d∗, ω,−365,−1)
(27)
As the THIN database does not record the time that a Read Code or drugcode is recorded, Read
Codes that are recorded on the same day as the drugcode could correspond to a serious ADR that occurs
immediately or an indicator, this is why the day of prescription is not included in the above ABratios
and instead is used as another attribute,
DOP(ei, d∗) =
P
ω∈Ωh(ei, d∗, ω,0,0) P
ω∈Ωh(ei, d∗, ω,−365,−1)
(28)
In previous methods there has been a patient level filter that removes medical events from a patient’s
sequence that occur 30 days after the drug if the patient also had the medical event shortly prior to the
drug [20]. The justification for this is, if a patient had an illness shortly before the drug then having the
illness repeated after the drug is unlikely to be an ADR. This inspires the third attribute that is based on
the number of patients who have the Read Code recorded in the month after and also have it recorded
during the month prior to the first prescription,
expect(ei, d∗) =
P
ω∈Ω[h(ei, d∗, ω,1,30)×h(ei, d∗, ω,−30,−1)] P
ω∈Ωh(ei, d∗, ω,1,30)
(29)
The final attributes of interest make use of the Read Code tree structure. When a patient first has an
illness it is likely that not much detail is known, so a low level Read Code will probably be recorded into
the THIN database, over time more information may be discovered about a patient’s illness possibly due
to laboratory results and this may then result in a more specified higher level Read Code being entered
(a child of the original less detailed Read Code). As a consequence, it is common for higher level Read
Codes related to the cause of taking the drug to only be recorded after the drug, so to help distinguish
between these and ADRs we calculate the Read Code after and before ratio when only considering the
first two or three elements of a Read Code. For example, considering the first three elements of the
Read Code, the Read Code A11ab becomes A11 and the ABratiolev3 is the number of patients that
have a Read Code starting with A11 within the month after the first prescription of the drug divided
by the number of patients that have a Read Code starting with A11 within the month prior to the first
prescription of the drug. Similarly, theABratiolev2 for a Read Code is the number of patients who have
a Read Code with the same first two elements within a month after the first prescription divided by the
number of patients who have a Read Code with the same first two elements within a month prior to the
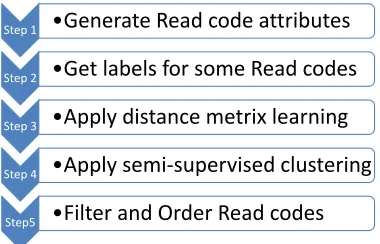
Step 1 •Generate Read code attributes
Step 2 •Get labels for some Read codes
Step 3 •Apply distance metrix learning
Step 4 •Apply semi-supervised clustering
[image:16.612.209.399.85.207.2]Step5 •Filter and Order Read codes
Fig. 2: A summary of the five steps applied in the DRESS algorithm.
To calculate these attributes we first define an equivalence relationship, ei n
∼ej if the firstn elements
of the Read Codes of ei and ej are the same. The number of patients who have Read Codes equivalent
to ei recorded a month after the first prescription of d∗ is,
X
ω∈Ω
H[X
e∼nei
h(e, d∗, ω,1,30)]
similary, the number of patients who have Read Codes equivalent toei recorded during the month prior
to the prescription is,
X
ω∈Ω
H[X
e∼nei
h(e, d∗, ω,−30,−1)]
It follows that the ABratiolev3 and ABratiolev2 are calculated by,
ABratiolev3(ei, d∗) =
P
ω∈ΩH[ P
e∼3eih(e, d∗, ω,1,30)] P
ω∈ΩH[ P
e∼3eih(e, d∗, ω,
−30,−1)] (30)
ABratiolev3(ei, d∗) =
P
ω∈ΩH[ P
e∼2eih(e, d∗, ω,1,30)] P
ω∈ΩH[ P
e∼2eih(e, d∗, ω,
−30,−1)] (31)
IV. DRESS ALGORITHM
The Detecting Rare Events Semi-Supervised (DRESS) algorithm comprises of five steps, see Fig (2).
The DRESS algorithm requires the user to input the drug of interest (d∗) and returns a ranked list of
Read Codes in descending order of how likely they are to be ADRs. Tentative ADR signals can then
be determined by the DRESS algorithm by considering the topk ranked Read codes to be signalled as
ADRs. The value of k will determine the filtering threshold and in this paper we consider the top 100
A. Step 1
The first step of the DRESS algorithm is the generation of attributes for any Read Code that could
be an ADR. This is accomplished by initially finding the set of all the Read Codes that are recorded
within a month of the first prescription of d∗ for any patient, we denote this set of Read Codes by G.
Then, for every Read Code ei ∈ G the DRESS algorithm generates the attributes ABratio30(ei, d∗),
ABratio365(ei, d∗), DOP(ei, d∗), expect(ei, d∗), ABratiolev3(ei, d∗), ABratiolev2(ei, d∗) (Eq’s
(26)-(31)) and the OE ratio values the IC∆(ei, d∗), ζ1(ei, d∗) and ζ2(ei, d∗) (Eq’s (16)-(17)). The data point
for each ei∈G is denoted by xi∈R9 and is a vector corresponding to the attribute values. The set of
data points is denoted by X={x1,x2, ...,xn}, where the cardinality of the set G isn (|G|=n).
B. Step 2
As we are applying a semi-supervised approach, we need labels for some of the Read Codes. We
have decided to have three different labels for each Read Code, one label representing Read Codes that
are ADRs (known ADR), another label representing Read Codes that cause the drug to be taken by the
patients (indicator) and the final label representing Read Codes that are not linked to the drug but just
occur by chance (noise). The reason for choosing three labels is because there is information available
to enable us to determine the labels for a sufficient number of Read Codes when using three labels.
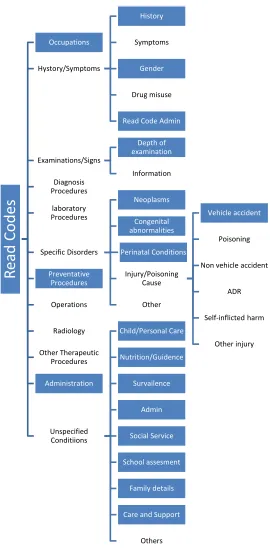
We determined the Read Codes that are labelled as noise by using the hierarchal structure of the Read
Code tree. We determined branches that are not related to immediately occurring ADRs by manually
investigating the Read Code tree and found the set of irrelevant Read Codes, Mirrel. Examples of Read
Codes in Mirrel that cannot correspond to immediately occurring ADRs are those related to cancer,
occupations or family history. Fig (3) illustrates the Read Code tree and the Read Code branches
considered to be noise are shaded in, whereas the Read Code branches that are possible ADRs are
unshaded. Using the set Mirrel, the DRESS algorithm labels any Read Codeei ∈G∩Mirrel as noise.
To determine the labels of some of the Read Codes corresponding to known ADRs or indicators
we mined data from the internet. The Read Codes labelled as indicators are found by first extracting
the strings listed as indicators on the netdoctor website [25], then finding the set of Read Codes with
descriptions containing any one of these strings and finally validating these are indicators by ignoring
indicator Read Codes that do not have an ABratio30 < 1. The Read Codes labelled as known ADRs
are found similarly, by first extracting the strings listed as side effects on the netdoctor website, then
finding the set of Read Codes with descriptions containing any one of these strings and validating these
corresponding to the netdoctor listed side effects, Read Codes with a description containing the drug
name and the term ‘adverse’ are also labelled as known ADRs.
C. Step 3
After labelling some of the Read Codes we then applied the metric learning algorithm detailed in
[26]. Letting S denote the set of all index pairs for Read Codes with the same label (e.g. if Read Codes
corresponding to the data pointsx1 andx2 are both labelled as noise then(1,2)∈S),Ddenote the set
of all index pairs for Read Codes with a different label (e.g. if the Read code corresponding to data point
x1 is labelled as noise but the Read code corresponding to the data pointx5 is labelled as an indicator
then (1,5)∈D) and the inner product of two d×n real valued matrices, X, Y ∈Rd×n, is denoted by
hX, Yi :=Tr(XTY), where Tr(A) means the trace of the matrix A. The cone of positive semidefinite matrices is denoted by S+d.
Given a pair of Read Code data points xi and xj generated in step 1, we calculate the matrix Xij =
(xi−xj)(xi−xj)T. If τ = (i, j) is an index pair, then Xτ ≡Xij. The matrix XS is defined byXS =
P
(i,j)∈SXij and
∼
Xτ =XS−1/2XτXS−1/2. The authors calculated that ∇fµ(Stµ) =
P τ∈De
−hXτ ,Si/µ∼ X∼ τ P
τ∈De−h ∼ Xτ ,Si/µ .
Algorithm 1 The distance metric learning algorithm from [26]
Input :
• smoothing parameterµ >0 (e.g., 10−5)
• tolerance value tol(e.g., 10−5)
• step sized{αt∈(0,1) :t∈N} Output:d×dmatrix Stµ∈S+d
Initialization: S1µ∈S+d with Tr(S1µ)= 1
fort= 1,2,3, ... do
Ztµ=argmax{fµ(Stµ) +hZ,∇fµ(Stµ)i : Z ∈ Sd+, Tr(Z)=1 }, that is, Ztµ = ννT where ν is the maximal eigenvector of the matrix ∇fµ(Stµ)
Stµ+1= (1−αt)Stµ+αtZtµ
if |fµ(Stµ+1)−fµ(Stµ)|< tol then break
end
When applied in the DRESS algorithm, the distance metric algorithm described in algorithm 1 finds
minimises the distance between two Read Codes with the same label and maximises the distance between
two Read Codes with different labels. The mapping is, f :R9 → R9;f(xi) = xiTStµ, where S µ t is the
9×9 learned distance metric matrix,
D. Step 4
The constrained K-means algorithm [27] is applied to the Read Codes on their corresponding
trans-formed data points determined by the distance metric learning algorithm above. The constrained
K-means algorithm is a semi-supervised algorithm that fixes the class of the labelled Read Codes and uses
these labelled Read Codes to calculate the initial cluster centres then iteratively assigns the non-fixed
Read Codes into the cluster with the closest mean, with the means iteratively being recalculated until
convergence.
When the DRESS algorithm is implemented, the set of data points input into the Constrained
K-means algorithm is the set {f(x1), f(x2), ..., f(xn)}, the value ofK input is3 and the initial seeds are
S1 ={xi :xi is labelled as a known ADR}, S2 ={xi : xi is labelled as an indicator} and S3 ={xi :
xi is labelled as noise}.
Algorithm 2 The Constrained K-means algorithm developed in [27]
Input : Set of data points X ={x1,x2, ...,xn}, xi∈Rd, number of clusters K, the set S =∪Kl=1Sl
of initial seeds.
Output: Disjoint K partitioning{Xl}kl=1 ofX such that the KMeans objective function is optimised.
Initialization: µ(0)h ← |S1
h| P
x∈Shx, for h= 1, ..., K;t←0
repeat
For x∈ S, if x ∈Sh assign x to the cluster h (i.e., set Xht+1). For x6∈S, assign x to the cluster
h∗ (i.e., setXht+1∗ ), for h∗ =argmin
h
kx−µ(ht)k2
µ(ht+1) ← 1
|X(ht+1)| P
x∈Xh(t+1)x
t←(t+ 1)
until convergence;
Read Codes in the same cluster as the Read Codes that were originally labelled as known ADRs are
referred to as being in the ADR cluster, Read Codes in the same cluster as the Read Codes that were
same cluster as the Read Codes that were originally labelled as noise are referred to as being in the noise
cluster.
E. Step 5
The last step involved applying two additional filters and then used the Read Code attributes and
clustering to order the Read Codes by how likely they are to be ADRs. The first filter removed all the
Read Codes (ei’s) that were in the indicator cluster or where(1−expect(ei, d∗))×ABratio30(ei, d∗)<1
. The second filter is a filter that we have developed for post processing with any algorithm that detects
ADRs by mining the THIN database. This filter removes all the Read Codes that are irrelevant for ADR
detection such as Read Codes corresponding to administrative events. Finally Read Codes were ordered
in descending order of (1−expect(ei, d∗))×ABratio30(ei, d∗)×β1, where β = 1 for Read Codes in
the ADR cluster andβ = 3 for Read Codes in the noise cluster.
In summary, the DRESS algorithm uses the semi-supervised clustering to filter Read Codes that have
attributes that make them unlikely to be ADRs and then orders the remaining Read Codes by how often
they occurred unexpectedly after the first prescription of the drug being investigated but also adds a
weight so that Read Codes that have attributes similar to known ADRs are ranked higher.
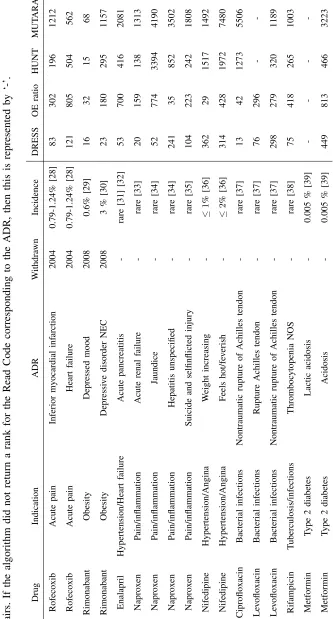
V. RESULTS
We applied the DRESS algorithm to a range of drugs, some of which have been withdrawn from
the market due to serious ADRs. Table II shows the rank that each data mining algorithm assigns for
a known rare and serious drug and ADR pair. The table also states the cause for taking the drug (the
indication), the year the drug was withdrawn and approximately how commonly the ADR occurs for
patients prescribed the drug. In some cases the rare and serious ADR being investigated was listed as
an ADR on the netdoctor website and to prevent any bias in the results for the DRESS algorithm, any
labels for the Read Codes corresponding to the ADR being investigated were removed at the end of step
2, prior to the semi-supervised steps. So the Read Codes corresponding to the ADR being investigated
were always unlabelled in the DRESS algorithm.
The DRESS algorithm had an average rank over the drug and ADR pairs of 143.75 and had the
highest rank compared to all the other algorithms for 12 of the 16 drug and ADR pairs investigated. It
was able to return a rank under 100 for 56.25% of the ADRs and all the ADRs had a rank below 500. In
and MUTARA respectively. The OE ratio only returned a rank under 100 for 25% of the ADRs and only
6.25% of ADRs ranked by MUTARA and HUNT had a rank under 100.
VI. DISCUSSION
The existing methods for detecting ADRs using EHDs do not currently definitively detect ADRs, but
rather, they can be considered to generate tentative ADR signals for the top k ranked medical events in
their returned list. This is effectively filtering out all the medical events that are unlikely to be ADRs or
the medical events without sufficient evidence (number of patients experiencing the event after the drug)
of being an ADR. The medical events with a rank greater thankare ignored and the medical events with
a rank less thank(the signalled medical events) are investigated further to confirm if they are true ADRs.
Therefore, for an unknown ADR to be detected by these existing methods it needs to be signalled by
being ranked in the top kmedical events returned and the closer that the rank is to the value1, the more
likely it will be investigated further, even when low values of kare used. The results of this paper show
that the existing methods are not able to rank the known rare and serious ADRs highly, so they would
be unlikely to signal these for further investigation, but the DRESS algorithm was able to rank over 50%
of these rare ADRs within the top 100 and would most likely signal these for further investigation. This
implies that the DRESS algorithm is more suitable than existing methods for detecting rare ADRs and
has the potential to discover many unknown rare ADRs.
The DRESS algorithm was unable to rank ‘Naproxen and Hepatitis’ and ‘Nifedipine and weight
increase’ higher than the OE ratio, one reason for this is that the DRESS algorithm does not perform as
well for medical events that have a high background rate as medical events that are common will have
a greater number of patients experiencing the medical event in the month before the prescription and
if the ADR is rare only one or two patients extra will have the medical event in the month after the
prescription, so the ABratio will be close to one, but on the other hand, the OE ratio performs better
for medical events with a high background rate as the bias in the IC calculation will have less impact.
It might be better to have two ADR clusters, one for the medical events that occur at a low background
rate and another for the medical events that occur at a high background rate, but this may cause issue if
there is not a sufficient number of Read Codes corresponding to known side effects, as if there are only
a few Read Codes for the known side effects there may only be one to two labelled Read Codes in each
cluster and this will be deleterious for the semi-supervised methods.
It may be argued that the DRESS algorithm can only be applied after many ADRs are known and this
generally need three of more ADR cases before there is satisfactory evidence to confirm the ADR and this
requires thousands of patients having the drug. DRESS can be implemented after a few hundred patients
have taken a drug as the obvious side effects will be known, so the constraint of requiring known ADRs
will not reduce the efficiency of DRESS. It is worth noting that the current implementation of DRESS
will not be as effective if a drug is generally safe and does not have many side effects, but this is not
common and DRESS could be modified to use the positive effects of the drug as labelled medical events
as the positive effects and side effects have similar attribute values as both should increase after the drug
is taken.
The DRESS algorithm still highly ranks medical events related to the cause of the drug and removing
these medical events would greatly improve the ability to detect rare ADRs with DRESS. The expect
attribute has limitations as it only indicates if the patient had a repeat of a medical event and does not
make use of the medical event relations within the THIN database to determine if a medical event is
expected based on related medical events. For example, if a patient has ‘a cold’ then they are likely to
experience ‘a cough’ if the illness progresses, but theexpectattribute only says ‘a cough’ is expected if
the patient has had ‘a cough’ shortly before and not if a predecessor medical event has occurred before.
To reduce the rank of medical events related to the cause of the drug a new attribute that uses sequential
patterns to determine the expectedness of each medical event that occurs after the description could be
used.
VII. CONCLUSION
In this paper we have described a novel methodology to detect rare ADRs that incorporates some
existing methods (Observe Expected ratio, MUTARA and HUNT), information retrieval from the web,
metric learning and semi-supervised clustering. The results suggest this methodology is able to detect
rare and serious ADRs for the range of drugs chosen in the investigation and has the potential to help
detect many currently unknown ADRs. The method is not able to remove all medical events related to
the cause of taking the drug and future work should aim to prevent generating signals for these medical
events by adding an additional attribute to the clustering that determines the expectedness of each medical
event based on sequential patterns that can be mined from the whole database. Further work could also
investigate different metric learning and semi-supervised clustering techniques.
REFERENCES
[2] K. Patal, M. Kedia, D. Bajpai, S. Mehta, N. Kshirsagar, and N. Gogtay, “Evaluation of the prevalence and economic burden
of adverse drug reactions presenting to the medical emergency department of a tertiary referral centre:a prospective study,”
BMC Clinical Pharmacology, vol. 7:8, 2007.
[3] E. C. Davies, C. F. Green, S. Taylor, P. R. Williamson, D. R. Mottram, and M. Pirmohamed, “Adverse drug
reactions in hostpitals in-patients: A prospectve analysis of 3695 patient-episodes,” [PL]o[S] ONE, vol. 4(2), p.
e4439.doi:10.1371/journal.pone.0004439, 2009.
[4] K. A. Hartholt, N. van der Velde, C. W. N. Looman, M. J. M. Panneman, and E. F. van Beeck, “Adverse drug reactions
related hostpital admissions in persons aged 60 years and over, thenetherlans, 1981-2007: Less rapid increase, different
drugs,”PLoS ONE, vol. 5(11), p. e13977. doi:10.1371/journal.pone.0013977, 2010.
[5] G. Shepherd, P. Mohorn, K. Yacoub, and D. May, “Adverse drug reaction deaths reported in united sates vital statistics,
1999-2006,”Ann Pharmacother, vol. 46(2), pp. 169–75, 2012.
[6] T. M. Betteridge, C. M. Frampton, and D. L. Jardine, “Polypharmacy - we make it worse! a cross-sectional study from
an acute admissions unit,”Internal Medicine Journal, vol. 42(2), pp. 208–211, 2012.
[7] M. Pirmohamed, “Adverse drug reactions as cause of admission to hospital: prospective analysis of 18 820 patients,”BMJ,
vol. 329, pp. 15–19, 2004.
[8] F. R. Varallo, M. F. R. Lima, J. C. F. Galduroz, and P. C. Mastroianni, “Adverse drug reactions as cause of hospital
admission of elderly people: a pilot study,”Latin American Journal of Pharmacy, vol. 30(2), pp. 347–353, 2011.
[9] J. A. Berlin, S. C. Glasser, and S. S. Ellenberg, “Adverse event detection in drug development: Recommendations and
obligations beyond phase 3,”Am J Public Health, vol. 98(8), pp. 1336–1371, 2008.
[10] B. Seruga, L. Sterling, L. Wang, and I. F. Tannock, “Reporting of serious adverse drug reactions of targeted anticancer
agents in pivotal phass iii clinical trials,”JCO, vol. 29(2), pp. 174–185, 2011.
[11] L. Bergman, M. L. Beelen, M. P. Gallee, H. Hollema, J. Benraadt, and F. E. van Leeuwen, “Risk and prognosis of
endometrial cancer after tamoxifen from breath cancer. comprehensive cancer centers’ ALERT group. assessment of liver
and endometrical cancer risk following tamoxifen.”Lancet, vol. 356(9233), pp. 881–887, 2000.
[12] L. A. Ladewski, S. M. Belknap, J. R. Nebeker, O. Sartor, E. A. Lyons, T. C. Kuzel, M. S. Tallman, D. W. Raisch, A. R.
Auerbach, G. T. Schumock, H. C. Kwaan, and C. L. Bennett, “Dissemination of information on potentially fatal adverse
drug reactions for cancer drugs from 2000 to 2002: First results from the research on adverse drug events and reports
project,”J Clin Oncol, vol. 21, pp. 3859–3866, 2003.
[13] S. J. W. Evans, P. C. Waller, and S. Davis, “Use of proportional reporting ratios (PRRs) for signal generation from
spontaneous adverse drug reaction reports,”Pharmacoepidemiology and Drug Safety, vol. 10(6), pp. 483–486, 2001.
[14] A. Bate, M. Lindquist, I. R. Edwards, S. Olsson, R. Orre, A. Lansner, and R. M. D. Freitas, “A bayesian neural network
method for adverse drug reaction signal generation,”European Journal of Clinical Pharmacol, vol. 54, pp. 315–321, 1998.
[15] W. DuMouchel, “Bayesian data mining in large frequency tables, with an application to the fda spontaneous reporting
system,”American Statistician, vol. 1999, pp. 177–190, 53.
[16] L. Hazell and S. A. W. Shakir, “Under-reporting of adverse drug reactions: A systematic review,”Drug Safety, vol. 29(5),
pp. 385–396, 2006.
[17] G. M. Noren, J. Hopstadius, A. Bate, K. Star, and I. R. Edwards, “Temportal pattern deiscovery in longitudinal electronic
patients records,”Data Mining and Knowledge Discovery, vol. 2010, pp. 361–387, 20.
[18] M. J. Schuemie, “Methods for drug safety signal detection in longitudinal observational databases: LGPS and LEOPARD,”
[19] I. Zorych, D. Madigan, P. Ryan, and A. Bate, “Disproportionality methods for pharmacovigilance in longitudinal
observational databases.”Stat Methods Med Res, vol. 0(0), pp. 1–18, 2011.
[20] H. Jin, J. Chen, C. Kelman, H. He, D. McAullay, and C. M. O’Keefe, “Mining unexpected associations for signalling
potential adverse drug reactions from administrative health databases,”PAKDD, pp. 867–876, 2006.
[21] H. W. Jin, J. Chen, H. He, C. Kelman, D. McAullay, and C. M. Okeefe, “Signaling potential adverse drug reactions from
administrative health databases,”IEEE Transactions on knowledge and data engineering, vol. 22(6), pp. 839–853, 2010.
[22] Y. Ji, H. Y. anf John Tran, P. Dews, A. Mansour, and R. M. Massanari, “A method for mining infrequent causal associations
and its application in finding adverse drug reaction signal pairs,”IEEE Transactions on knowledge and data engineering,
2012.
[23] J. Reps, J. M. Garibaldi, U. Aickelin, D. Soria, J. E. Gibson, and R. B. Hubbard, “Comparing data-mining algorithms
developed for longitudinal observational databases.” inComputational Intelligence (UKCI), 2012 12th UK Workshop on.
Edinburgh: Heriot-Watt University, Sept. 2012, pp. 1–8.
[24] J. D. Lewis, W. B. Bilker, R. B. Weinstein, and B. L. Strom, “The relationship between time since registration and measured
incidence rates in the general practice research database,”Pharmacoepidemiol Drug Saf, vol. 14(7), pp. 443–451, 2005.
[25] netdoctor. (2012) Netdoctor.co.uk - the uk’s leading independent health website. online (accessed 09/08/2012). NetDoctor.
[Online]. Available: http://www.netdoctor.co.uk
[26] Y. Ying and P. Li, “Distance metric learning with eigenvalue optimization,”JMLR, vol. 13, pp. 1–26, 2012.
[27] S. Basu, A. Banerjee, and R. Mooney, “Semi-supervised clustering by seeding,”Proceedings of the 19th International
Conference on Machine Learning (ICML-2002), Sydney, Australia, pp. 19–26, 2002.
[28] D. J. Graham, D. Campen, R. Hui, M. Spence, C. Cheetham, G. Levy, S. S, and W. A. Ray, “Risk of acute myocardial
infarction and sudden cardiac death in patients treated with cyclo-oxygenase 2 selective and nonselective nonsteroidal
anti-inflammatory drugs: nested case control study,”Lancet, vol. 365(9458), pp. 475–81, 2005.
[29] J. P. Desprs, A. Golay, and L. S. L, “Effects of rimonabant on metabolic risk factors in overweight patients with
dyslipidemia.”N Engl J Med, vol. 353(20), pp. 2121–2134, 2005.
[30] R. Christensen, P. K. Kristensen, E. M. Bartels, H. Bliddal, and A. Astrup, “Efficacy and safety of the weight-loss drug
rimonabant: a meta-analysis of randomised trials,”Lancet, vol. 370(9600), pp. 1706–1713, 2007.
[31] A. Carnovale, P. Esposito, P. Bassano, L. Russo, and G. Uomo, “Enalapril-induced acute recurrent pancreatitis,”Digestive
and Liver Disease, vol. 35(1), pp. 55–57, 2003.
[32] A. R. Balani and J. H. Grendell, “Drug-induced pancreatitis: Incidence, management and prevention,” Drug Safety, vol.
31(10), pp. 823–837, 2008.
[33] S. Harirforoosh and F. Jamali, “Renal adverse effects of nonsteroidal anti-inflammatory drugs.”Expert Opin Drug Saf, vol.
8(6), pp. 669–681, 2009.
[34] S. Ali, J. D. Pimentel, and C. Ma, “Naproxen-induced liver injury.”Hepatobiliary Pancreat Dis Int, vol. 10(5), pp. 552–556,
2011.
[35] G. Onder, F. Pellicciotti, G. Gambassi, and R. Bernabei, “Nsaid-related psychiatric adverse events: Who is at risk?”Drugs,
vol. 64(23), pp. 2619–2627, 2004.
[36] Drugs.com. (2012) Nifedipine side effects from drugs.com; [accessed:13/12/2012 ]. [Online]. Available:
http://www.drugs.com/sfx/nifedipine-side-effects.html
[37] P. D. van der Linden, M. C. J. M. Sturkenboom, R. M. C. Herings, H. G. M. Leufkens, and B. H. C. Stricker,
[38] C. H. Lee and C. J. Lee, “Thrombocytopenia – a rare but potentially serious side effect of initial daily and interrupted use
of rifampicin,”CHEST, vol. 96(1), pp. 202–203, 1989.
[39] N. N. Chan, H. P. S. Brian, and M. D. Feher, “Metformin-associated lactic acidosis: a rare or very rare clinical entity?”
R
ead C
odes
Occupations
Hystory/Symptoms
History
Symptoms
Gender
Drug misuse
Read Code Admin
Examinations/Signs
Depth of examination
Information Diagnosis
Procedures
laboratory Procedures
Specific Disorders
Neoplasms
Congenital abnormalities
PerinatalConditions
Injury/Poisoning Cause
Vehicle accident
Poisoning
Non vehicle accident
ADR
Self-inflicted harm
Other injury Other
Preventative Procedures
Operations
Radiology
Other Therapeutic Procedures
Administration
Unspecified Conditiions
Child/Personal Care
Nutrition/Guidence
Survailence
Admin
Social Service
School assesment
Family details
Care and Support
[image:27.612.164.434.92.645.2]Others
Fig. 3: The Read Codes categories labelled as noise are in the shaded boxes. Read Codes for