Spatial inhomogeneity of the superconducting gap and order parameter in FeSe
0.4Te
0.6U. R. Singh,1S. C. White,1S. Schmaus,1V. Tsurkan,2,3A. Loidl,2J. Deisenhofer,2and P. Wahl1,4,* 1Max-Planck-Institut f¨ur Festk¨orperforschung, Heisenbergstrasse 1, D-70569 Stuttgart, Germany
2Center for Electronic Correlations and Magnetism, Experimental Physics V, University of Augsburg, D-86159 Augsburg, Germany
3Institute of Applied Physics, Academy of Sciences of Moldova, MD-2028, Chisinau, Republic of Moldova
4SUPA, School of Physics and Astronomy, University of St. Andrews, North Haugh, St. Andrews, Fife KY16 9SS, United Kingdom
(Received 13 March 2013; revised manuscript received 4 August 2013; published 21 October 2013) We have performed a low-temperature scanning tunneling microscopy and spectroscopy study of the iron chalcogenide superconductor FeSe0.4Te0.6 with TC≈14 K. Spatially resolved measurements of the superconducting gap reveal substantial inhomogeneity on a nanometer length scale. Analysis of the structure of the gap seen in tunneling spectra by comparison with calculated spectra for different superconducting order parameters (s-wave,d-wave, and anisotropics-wave) yields the best agreement for an order parameter with anisotropics-wave symmetry with an anisotropy of∼40%. The temperature dependence of the superconducting gap observed in places with large and small gap size indicates that it is indeed the superconducting transition temperature which is inhomogeneous. The temperature dependence of the gap size has been found to differ from the one predicted by BCS theory. An analysis of the local gap size in relation to the local chemical composition shows almost no correlation with the local concentration of Se/Te atoms at the surface.
DOI:10.1103/PhysRevB.88.155124 PACS number(s): 74.55.+v, 74.62.Dh, 74.70.Xa, 74.81.−g
I. INTRODUCTION
The recently discovered iron-based superconductors have sparked hope that a detailed understanding of superconduc-tivity in these materials might finally help to establish an understanding of the pairing mechanism in high-temperature superconductors.1–3 The observation of magnetic resonance modes at the nesting vector of different Fermi surface sheets indicates that spin fluctuations play an important role for superconductivity in these materials.4–6However, despite these successes, there are still open questions to be resolved. The symmetry of the superconducting order parameter has not been unambiguously determined so far; also, a predictive theory of superconductivity in iron-based superconductors is still missing. Matters are complicated by a complex band structure with up to five bands derived from the Fe 3dorbitals crossing the Fermi level.2 In the iron chalcogenide superconductor Fe1+δSe1−xTex it appears that the superconducting gap ob-served in tunneling spectra near optimal doping (x≈0.6) is nodeless,7whereas in thin films of FeSe grown by molecular beam epitaxy, it appears to have nodes.8 An anisotropy of the superconducting gap has been observed in studies of LiFeAs by scanning tunneling microscopy (STM)9 and angle-resolved photoemission spectroscopy (ARPES).10In the case of Fe1+δSe1−xTex, results from ARPES experiments have been inconclusive: both isotropic gaps on the holelike and electronlike sheets of the Fermi surface, though of different magnitude,11as well as anisotropic gaps12have been reported. The latter is consistent with angle-resolved specific heat mea-surements which show evidence for an anisotropic gap in this sample.13A quasiparticle interference study by STM indicates that the order parameter reverses sign between different sheets of the Fermi surface, supporting an interpretation in terms of an s± order parameter.7 The superconducting gap has been found to be inhomogeneous in iron pnictide superconductors of the 122 family.14,15However, in the 122 materials, cleaving usually creates a disordered surface, so this inhomogeneity is likely not representative of the bulk.
In this paper, we report a study of the spatial inhomogeneity and structure of the superconducting gap in FeSe0.4Te0.6 by STM. The temperature dependence of the gap shows that the inhomogeneity and spatial variations of the transition temperature are closely related to each other. A comparison of the local variation of the superconducting gap size with the anion height reveals almost no correlation, indicating that interlayer coupling is not negligible.
The 11 iron chalcogenide superconductors have the sim-plest crystal structure of the iron-based superconductors, consisting of planar iron layers with chalcogenide (Se, Te) anions above and below. The crystal structure provides a well-defined and nonpolar cleavage plane between the chalcogenide layers. Low-energy electron diffraction and STM studies show no indication of a surface reconstruction.16,17
II. EXPERIMENTAL METHODS
We have carried out STM measurements on a single crystal of FeSe1−xTex withx=0.61 [determined by energy-dispersive x-ray (EDX) measurements] and a superconducting transition temperatureTC≈14 K.18 We have used a home-built low-temperature STM which allows forin situsample transfer and cleavage.19 Differential tunneling conductance dI /dV is measured through a lock-in amplifier with a modulation of 600μVRMS. Bias voltages are applied to the sample, with the tip at virtual ground. Tunneling spectra are acquired with an open feedback loop. Sample cleaving was performed at temperatures around 20 K.
-12 -9 -6 -30 0 3 6 9 12 0.5
1 1.5
Bias (mV)
dI/dV
(norm.)
16 K 12 K 8 K 4.2 K 2.1 K
3 nm
(b)
-90 60 pm
(a)
80x80 nm2
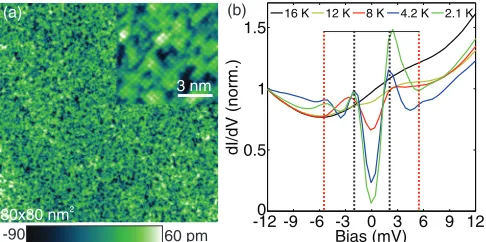
FIG. 1. (Color online) (a) Atomically resolved topography of FeSe0.4Te0.6 (80×80 nm2), taken at 2.1 K (V =90 mV, I= 0.2 nA). Inset in (a) shows a magnified image of the atomic lattice, which contains Se and Te atoms. (b) Temperature-dependent spectra (4096 single spectra) averaged over an area of size 20×20 nm2 (stabilization condition:V =40 mV,I=0.5 nA).
x =0.63±0.04, consistent with EDX measurements. We de-tect almost no excess iron impurities. Temperature-dependent spatially averaged dI /dV spectra from spectroscopic maps are depicted in Fig. 1(b), showing a superconducting gap similar to the one observed previously by Hanaguri et al.7 The superconducting gap is found to disappear roughly atTC. We note a pronounced asymmetry in the spectra, with different amplitudes of the coherence peaks at positive and negative bias voltages. The asymmetry is position dependent. In addition to the dominant coherence peaks at±2.1 mV (marked by dashed black lines), additional features can been seen outside the gap around±5.5 mV (dashed red lines). These outer features are less reproducible than the inner coherence peaks, possibly because the orbital character of the associated bands couples only weakly to the tip of the STM. We can only speculate that they are likely due to a second, larger superconducting gap; however, they are not exactly symmetric with respect to the Fermi energy. Therefore, we concentrate on the lower-energy peaks in the following analysis.
For the investigation of the spatial variation of the size of the superconducting gap, spectra in the map are fitted for one polarity with a Dynes gap function,
dI dV(V)=
Re
eV −i
(eV −i)2−2
, (1)
where and represent the size of the superconducting gap and quasiparticle-lifetime broadening, respectively. A spatial map of the local gap size obtained at positive polarity is presented in Fig. 2(a). (The one obtained for negative polarity shows the same qualitative behavior.) It can clearly be seen that the size of the superconducting gap is spatially inhomogeneous with a characteristic length scale on the order of one nanometer and varies between 0.25 and 2.2 meV [see Fig.2(b)]. In Fig.2(c), a series of spectra obtained along the line shown in Fig. 2(a)shows the coherence peaks at ±2.1 meV evolving from large gap (bottom) to small gap (top), where the coherence peaks almost disappear and rather only a depletion in the differential conductance is visible. A similar type of gap inhomogeneity has been found in the iron arsenide compound BaFe1.8Co0.2As2and has been explained by
impu-0.0 0.5 1.0 1.5 2.0 2.5
0 50 100 150 200 250
Co
u
n
ts
G ap (meV)
low high
2
4
1 5
3 (a)
(b)
(d)
(c)
(e)
Bias (mV)-2 2 4 6 -6 -4 0
2.1 K
4 nm 0 meV 2.2 meV
2.1 K
7.5 nm 0 2 4 6 8 10
0 5 10 15x 10
-4
Distance (nm)
Aut
o
c
o
rr
e
la
tio
n
Radial line cut
Fitted withξ= 1.30 nm
dI/dV (a. u.
)
FIG. 2. (Color online) (a) Gap map of FeSe0.4Te0.6 taken in an area of 20×20 nm2obtained from a spectroscopic map taken with a tunneling set point ofV =40 mV andI=0.5 nA before switching off the feedback loop. Over this area we have acquired temperature-dependent spectroscopic maps with 64×64 points. (b) Histogram of the gap distribution. (c) Raw spectra along the line cut shown in (a). (d) Autocorrelation of the gap map taken over a large field of view (38×38 nm2). (e) Radial line cut around the center of the autocorrelation shown in (d) obtained by averaging azimuthally (blue); the solid red line represents a fit of an exponential decay to the radial line cut.
rity scattering.14 We detected very few impurities; therefore, it is unlikely that this is the main cause of inhomogeneity in our measurements. Thus, the main source of inhomogeneity in our sample has to be the disorder of Se/Te ions. However, in contrast to high-temperature cuprate superconductors where the inhomogeneity arises due to disorder of the dopant atoms,21 here the substitution of Se by Te atoms is isoelectronic, so the mechanism linking the inhomogeneity to the local variation in the size of the superconducting gap has to be different.
[image:2.608.52.295.71.192.2] [image:2.608.316.556.72.376.2]IV. SUPERCONDUCTING GAP AND ANISOTROPY OF THE ORDER PARAMETER
For a detailed analysis of the gap size as a function of temperature, we have compared our spectra with fits for different order parameters in order to determine which yields the best description. To this end, we have introduced different angular-dependent order parameters (θ) into Eq. (1). We have considered the cases of pure s-wave [(θ)=0], anisotropic s-wave [(θ)=0+1cos 4θ], and d-wave [(θ)=0cos 4θ] order parameters. Furthermore, to de-scribe the temperature dependence of the spectra, we have accounted for the thermal broadening of the Fermi function.
The differential conductance dI /dV measured by STM can be considered proportional to the density of states of the sample, where the proportionality constant depends on the tip height and details of the tip apex.24To eliminate these effects and contributions from the normal-state density of states in our spectra taken belowTC, we have divided them by spectra acquired with the same tunneling parameters in the normal state atT > TC.
Figure3shows a spatially averaged spectrum taken at 2.1 K, normalized and symmetrized around zero bias (symbols). The solid lines show Dynes equation [Eq. (1)] fits with different order parameters(θ). The best fit is obtained for the anisotropic s-wave scenario; pure s-wave and d-wave scenarios do not give the same level of agreement. The extracted gap size is 0=1.42 meV—close to the results obtained from previous STM measurement showing coherence peaks in the tunneling spectra at ±1.7 meV (Ref. 7) and ARPES,11 and somewhat smaller than what has been seen by optical spectroscopy (2.5 meV).25 For the anisotropy we obtain 1=0.60 meV. While we do fit the anisotropy by considering a cos 4θ term, we cannot exclude that the anisotropy is governed, e.g., by a cos 2θ term, because the resulting spectrum remains the same for any integer multiple ofθ.
-5 -4 -3 -2 -1 0 1 2 3 4 5 0
0.2 0.4 0.6 0.8 1 1.2 1.4
Bias (mV)
dI/d
V
(norm.
)
data s-wave anisotropic s-wave d-wave
FIG. 3. (Color online) The black symbols represent a spectrum extracted from a spatial average of the map shown in Fig.2(a)at 2.1 K. The spectrum has been symmetrized and normalized as discussed in the text. Blue, red, and green solid lines are fitted curves using Eq.(1)
withs-wave [(θ)=0], anisotropics-wave (0+1cos 4θ), and
d-wave (0cos 2θ) gap functions, respectively.
The anisotropy which we obtain is ∼40% of the gap magnitude, consistent with angle-resolved specific heat ex-periments for samples of slightly different composition (FeSe0.45Te0.55),13 for which an anisotropy of ≈50% was found. Recently, from measurements by laser ARPES an anisotropy of 25% has been reported with a superconducting gap of0=1.63 meV at 2.5 K;12 both are quite close to the values extracted from our fits.
V. TEMPERATURE DEPENDENCE OF THE SUPERCONDUCTING GAP
In order to explore the evolution of the superconducting gap with temperature we have acquired spectroscopic maps at temperatures between 2.1 and 12 K in the same area of the sample as shown in Fig.2(a). The temperature-dependent spectra taken in regions with large and small local gap size [see Figs.4(a) and 4(b) reveal that in different regions the superconducting gap disappears at different temperatures. For example, spectra taken at 12 K in a region with a large local gap size [Fig.4(a)] still show a slight dip near zero-bias voltage which is absent in spectra taken in a region with a small gap size [Fig.4(b)] at the same temperature.
We can determine local transition temperaturesTCby fitting Eq. (1) with the anisotropics-wave gap function to spectra averaged over regions with similar local gap size. In Figs.4(c) and4(d)we show symmetrized and normalized spectra from regions with large and small local gap size taken at different temperatures. [Note that some spectra show spurious features which are tip related; see, e.g., spectra taken at 5 K in Figs.4(c)and4(d)near±5 mV). The values of the gap size
-5 -4 -3 -2 -1 0 1 2 3 4 5 0
0.5 1 1.5 2 2.5 3 3.5 4
d
I/
d
V
(norm.)
Bias (mV)
-5 -4 -3 -2 -1 0 1 2 3 4 5 0
0.5 1 1.5 2 2.5 3 3.5 4
dI/d
V
(n
o
rm
.)
Bias (mV)
5 K
2.1 K 8 K 12 K
4.2 K
(c) (d)
-9 -6 -3 0 3 6 9
0 0.02 0.04 0.06 0.08 0.1 0.12
Bias (mV)
dI/d
V
(a
.u
.)
12 K 8 K 4.2 K 2.1 K
-9 -6 -3 0 3 6 9
0 0.02 0.04 0.06 0.08 0.1 0.12
Bias (mV)
dI/d
V
(a.
u.
)
12 K 8 K 4.2 K 2.1 K
(a) (b)
1
5 1
5
[image:3.608.90.257.515.679.2]-10 -8 -6 -4 -2 0 2 4 6 8 100 0.3
0.6 0.9 1.2 1.5 1.8
Bias (mV)
d
I/
d
V
(norm.
)
-33...-16 pm -15...-6 pm -5...4 pm 5...14 pm 15...27 pm
0 2 4 6 8 10 12 14 0
0.5 1 1.5 2
T (K)
Ga
p
s
iz
e
Δ0
(meV
)
1 2 3 4 5
(b)
(a) Se
Te
-8 -4 0 4 8
0 0.3 0.6 0.9
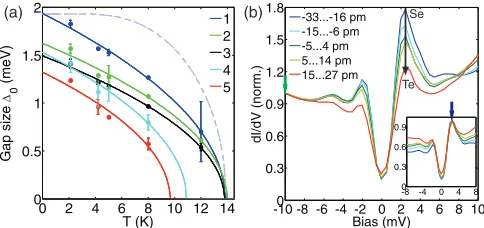
FIG. 5. (Color online) (a) Gap size0 as a function ofT for different gap regions [marked in Fig.2(a)], showing local differences in the temperature at which the gap is completely closed. Solid lines are fits of a√1−T /TCbehavior for the temperature dependence of the gap size. The dashed light blue line is the temperature dependence of the superconducting gap as it would be expected from BCS theory for ans-wave gap [assuming the sameTC and 0(0) as obtained from the fit of the dark blue line for region 1]. (b) Tunneling spectra from a spectroscopic map averaged for different ranges of relative topographic heights and normalized atV = −10 mV (marked by the green arrow). Inset: The same spectra as in the main graph normalized at the energy of the coherence peak (marked by the blue arrow).
0 obtained from the fits show a monotonic decrease with increasing temperature as shown in Fig.5(a); they follow a
√
1−T /TC behavior. Their temperature dependence differs from that expected from BCS theory for a weak-coupling superconductor, especially at low temperaturesT < TC, where the gap size becomes almost independent of temperature according to BCS theory.26 The critical temperatures which we obtain from regions of different gap size range from 10 to 14 K. Thus, it is really the superconducting transition temperature which is spatially inhomogeneous in FeSe0.4Te0.6. Furthermore, also the temperature dependence itself shows some spatial variation as can be seen from comparing the curves in Fig. 5(a). From the fits, the gap size 0(0) in the limit of low temperature can be extracted, yielding a ratio 20(0)/kBTC in a range from 2.5 to 3.2. This value is somewhat smaller than what would be expected from weak-coupling BCS theory, which gives 20(0)=3.52kBTC.
VI. DISCUSSION
Having established the relation between local gap size and transition temperature, we can compare the local supercon-ducting gap size with the local chemical composition. As confirmed by x-ray diffraction, the chalcogen height of Se and Te atoms above the iron layer differs substantially.27 We can extract a measure of the local chalcogen height from the apparent height in the topographic image acquired simultaneously with the map. In Fig.5(b), tunneling spectra extracted from a map are averaged for different relative topographic heights, revealing that the height of the coherence
peak decreases with the increase in the chalcogen height but the change in the superconducting gap size is very small. From spectra normalized at the coherence peak energy [see inset of Fig.5(b)] it can be seen that the gap size is almost independent of anion height. The influence of the anion height on electronic, superconducting, and magnetic properties of iron-based superconductors and their parent compounds has been widely discussed in the literature.28–30 Details of the Fermi surface depend on the pnictogen/chalcogen height; for iron calcogenides, it has been shown that different magnetic orders are stabilized depending on the chalcogen height.30 Also its influence on superconductivity has been investigated,29showing that even a change in the symmetry of the superconducting order parameter can occur as a function of anion height. This sensitivity stems from the chemical bond between iron d orbitals and the chalcogen or pnictogen p orbitals, whose strength depends strongly on the bond angle. The lack of a clear correlation between the local anion height and the size of the superconducting gap in our measurements indicates that there is substantial interlayer coupling and the superconducting properties are not only governed by the chemistry within one iron chalcogenide layer. Density functional theory calculations comparing the band structures between FeSe and FeTe show that indeed in FeTe there are bands at the Fermi energy with a strong dispersion in the direction perpendicular to the iron chalcogenide planes,31 suggesting substantial interlayer coupling, which plays a smaller role in FeSe. Our data suggest that at the doping of our sample the superconducting properties are already substantially influenced by coupling between the layers.
VII. CONCLUSION
In conclusion, we have studied the spatial inhomogeneity and temperature dependence of the superconducting gap of FeSe1−xTex with x=0.6. We find that the spectra are best described by an anisotropic s-wave gap function with an anisotropy of∼40%. Temperature-dependent spectra acquired with an atomic registry show that the local variation in gap size is directly linked to a local variation in the superconducting transition temperature. The correlation with the local concen-tration of selenium and tellurium atoms shows no clear trend. Our data indicate that the local superconducting gap size is not only determined by the chemical composition within the topmost iron chalcogenide layer, but it is also influenced by deeper layers.
ACKNOWLEDGMENTS
U.R.S. acknowledges support by the Alexander-von-Humboldt Foundation; furthermore, we acknowledge support by SPP1458 of the DFG through Projects No. WA2510/1-1 and No. DE1762/1-1.
1G. R. Stewart,Rev. Mod. Phys.83, 1589 (2011).
2P. J. Hirschfeld, M. M. Korshunov, and I. I. Mazin,Rep. Prog. Phys.
[image:4.608.52.294.71.185.2]3A. Chubukov,Annu. Rev. Condens. Matter Phys.3, 57 (2012). 4Y. Qiu, W. Bao, Y. Zhao, C. Broholm, V. Stanev, Z. Tesanovic,
Y. C. Gasparovic, S. Chang, J. Hu, B. Qian, M. Fang, and Z. Mao,
Phys. Rev. Lett.103, 067008 (2009).
5D. S. Inosov, J. T. Park, P. Bourges, D. L. Sun, Y. Sidis, A. Schneidewind, K. Hradil, D. Haug, C. T. Lin, B. Keimer, and V. Hinkov,Nat. Phys.6, 178 (2010).
6I. I. Mazin, D. J. Singh, M. D. Johannes, and M. H. Du,Phys. Rev.
Lett.101, 057003 (2008).
7T. Hanaguri, S. Niitaka, K. Kuroki, and H. Takagi,Science328,
474 (2010).
8C.-L. Song, Y.-L. Wang, P. Cheng, Y.-P. Jiang, W. Li, T. Zhang, Z. Li, K. He, L. Wang, J.-F. Jia, H.-H. Hung, C. Wu, X. Ma, X. Chen, and Q.-K. Xue,Science332, 1410 (2011).
9M. P. Allan, A. W. Rost, A. P. Mackenzie, Yang Xie, J. C. Davis, K. Kihou, C. H. Lee, A. Iyo, H. Eisaki, and T.-M. Chuang,Science
336, 563 (2012).
10K. Umezawa, Y. Li, H. Miao, K. Nakayama, Z.-H. Liu, P. Richard, T. Sato, J. B. He, D.-M. Wang, G. F. Chen, H. Ding, T. Takahashi, and S.-C. Wang,Phys. Rev. Lett.108, 037002 (2012).
11H. Miao, P. Richard, Y. Tanaka, K. Nakayama, T. Qian, K. Umezawa, T. Sato, Y.-M. Xu, Y. B. Shi, N. Xu, X.-P. Wang, P. Zhang, H.-B. Yang, Z.-J. Xu, J. S. Wen, G.-D. Gu, X. Dai, J.-P. Hu, T. Takahashi, and H. Ding,Phys. Rev. B85, 094506 (2012).
12K. Okazaki, Y. Ito, Y. Ota, Y. Kotani, T. Shimojima, T. Kiss, S. Watanabe, C.-T. Chen, S. Niitaka, T. Hanaguri, H. Takagi, A. Chainani, and S. Shin,Phys. Rev. Lett.109, 237011 (2012).
13B. Zeng, G. Mu, H. Q. Luo, T. Xiang, I. I. Mazin, H. Yang, L. Shan, C. Ren, P. C. Dai, and H.-H. Wen,Nat. Commun.1, 157 (2010).
14Y. Yin, M. Zech, T. L. Williams, X. F. Wang, G. Wu, X. H. Chen, and J. E. Hoffman,Phys. Rev. Lett.102, 097002 (2009).
15L. Shan, Y.-L. Wang, B. Shen, B. Zeng, Y. Huang, A. Li, D. Wang, H. Yang, C. Ren, Q.-H. Wang, S. H. Pan, and H.-H. Wen,Nat. Phys.
7, 325 (2011).
16A. Tamai, A. Y. Ganin, E. Rozbicki, J. Bacsa, W. Meevasana, P. D. C. King, M. Caffio, R. Schaub, S. Margadonna, K. Prassides,
M. J. Rosseinsky, and F. Baumberger,Phys. Rev. Lett.104, 097002 (2010).
17F. Massee, S. de Jong, Y. Huang, J. Kaas, E. van Heumen, J. B. Goedkoop, and M. S. Golden,Phys. Rev. B80, 140507(R) (2009).
18V. Tsurkan, J. Deisenhofer, A. Guenther, C. Kant, H.-A. Krug von Nidda, F. Schrettle, and A. Loidl,Eur. Phys. J. B79, 289 (2011).
19S. White, U. R. Singh, and P. Wahl,Rev. Sci. Instrum.82, 113708
(2011).
20X. B. He, G. R. Li, J. D. Zhang, A. B. Karki, R. Y. Jin, B. C. Sales, A. S. Sefat, M. A. McGuire, D. Mandrus, and E. W. Plummer,Phys. Rev. B83, 220502 (2011).
21S. H. Pan, J. P. O’Neal, R. L. Badzey, C. Chamon, H. Ding, J. R. Engelbrecht, Z. Wang, H. Eisaki, S. Uchida, A. K. Gupta, K.-W. Ng, E. W. Hudson, K. M. Lang, and J. C. Davis,Nature (London)
413, 282 (2001);K. M. Lang, V. Madhavan, J. E. Hoffman, E. W. Hudson, H. Eisaki, S. Uchida, and J. C. Davis,ibid.415, 412 (2002).
22U. R. Singh, S. C. White, S. Schmaus, V. Tsurkan, A. Loidl, J. Deisenhofer, and P. Wahl,arXiv:1309.5210.
23T. Klein, D. Braithwaite, A. Demuer, W. Knafo, G. Lapertot, C. Marcenat, P. Rodi`ere, I. Sheikin, P. Strobel, A. Sulpice, and P. Toulemonde,Phys. Rev. B82, 184506 (2010).
24J. Bardeen,Phys. Rev. Lett.6, 57 (1961);C. J. Chen,Introduction to
Scanning Tunneling Microscopy, 2nd ed. (Oxford University Press, New York, 2008).
25C. C. Homes, A. Akrap, J. S. Wen, Z. J. Xu, Z. W. Lin, Q. Li, and G. D. Gu,Phys. Rev. B81, 180508(R) (2010).
26M. Tinkham, Introduction to Superconductivity, 2nd ed. (Dover, New York, 2004).
27M. Tegel, C. L¨ohnert, and D. Johrendt,Solid State Commun.150,
383 (2010).
28D. J. Singh and M. H. Du,Phys. Rev. Lett.100, 237003 (2008). 29K. Kuroki, H. Usui, S. Onari, R. Arita, and H. Aoki,Phys. Rev. B
79, 224511 (2009).
30C.-Y. Moon and H. J. Choi, Phys. Rev. Lett. 104, 057003
(2010).
31A. Subedi, L. Zhang, D. J. Singh, and M. H. Du,Phys. Rev. B78,