Accelerating electrostatic pair methods on
graphical processing units to study
molecules in supercritical carbon dioxide
†
John A. Baker and Jonathan. D. Hirst*
Received 14th February 2014, Accepted 5th March 2014 DOI: 10.1039/c4fd00012a
Traditionally, electrostatic interactions are modelled using Ewald techniques, which provide a good approximation, but are poorly suited to GPU architectures. We use the GPU versions of the LAMMPS MD package to implement and assess the Wolf summation method. We compute transport and structural properties of pure carbon dioxide and mixtures of carbon dioxide with either methane or difluoromethane. The diffusion of pure carbon dioxide is indistinguishable when using the Wolf summation method instead of PPPM on GPUs. The optimum value of the potential damping parameter,a, is 0.075. We observe a decrease in accuracy when the system polarity increases, yet the method is robust for mildly polar systems. We anticipate the method can be used for a number of techniques, and applied to a variety of systems. Substitution of PPPM can yield a two-fold decrease in the wall-clock time.
1.
Introduction
GPU architectures and their use in molecular dynamics (MD) simulations have attracted much recent attention.1–4 Maximizing computational throughput on graphical processing units (GPUs)/hybrid architectures is of great interest. Decreasing the wall-clock time for each MD time step allows longer timescales to be sampled, giving greater condence in the convergence of ensemble averages. GPUs have been widely adopted in various computational disciplines, due to the highly parallel design, low power consumption (FLOPS/Watt) and commodity cost (£/FLOPs). The GPU architecture is optimised for processing massive amounts of parallel calculations, and so has many more cores than a CPU, but at the sacrice of memory capabilities.
Electrostatic interactions can be divided into rst-order effects, which comprise point charge interactions decaying reciprocally with respect to inter-molecular distance and higher-order interactions that decay more rapidly.
School of Chemistry, University of Nottingham, University Park, Nottingham, NG7 2RD, UK. E-mail: Jonathan. [email protected]; Fax: +44 1159 513562; Tel: +44 1159 513478
†Electronic Supplementary Information (ESI) available: See DOI: 10.1039/c4fd00012a
Faraday Discussions
Cite this:Faraday Discuss., 2014,169, 343
PAPER
Open Access Article. Published on 05 March 2014. Downloaded on 24/10/2014 09:16:06.
This article is licensed under a
Creative Commons Attribution 3.0 Unported Licence.
Electrostatic interactions can be modelled explicitly by various methods, including: cut-offtruncation,5–7switched/shied cut-offtruncation,8Ewald9and its mesh derivatives, particle mesh Ewald (PME),10particle–particle particle mesh (PPPM)11and smoothed particle mesh Ewald (SPME).12The Ewald summation provides a good approximation for the electrostatic energy, as the algorithm accounts for periodicity of the simulation domain, but it scales asO(N3/2). An
approximation that is frequently adopted is PPPM, due to its superior scaling, O(NlogN), over the Ewald summation. SPME,13PPPM14and multi-level summa-tion15have been implemented on the GPU, yet the requirement for fast Fourier transforms (FFTs) intrinsic to Ewald methods, like SPME and PPPM, reduces the parallelism14and leads to poor scaling on GPUs. Pair-wise algorithms derived from cut-offtechniques show superior scalingO(N) and greater effectiveness on GPUs.
Cut-offtechniques can reproduce experimental quantities, for instance, the Madelung constant. Wolf et al.16 reported that the electrostatic (Coulombic) potential for condensed systems was effectively short-ranged, and the energies are in agreement with Ewald methods when the cut-offsphere reached neutrality. This was observed whilst calculating the Madelung constant for rocksalt (NaCl), where the relationship between truncation distance and electrostatic energy was investigated. When the cut-off sphere was truncated at a distance to achieve charge neutrality, the electrostatic energy was signicantly closer to the Madelung energy. The repeating lattice structure of NaCl is well-suited for treatment with the Wolf method, but the supercritical phase of polar solutes can be more difficult to model as the atomic partial charges within the cut-offsphere are dynamic. The resulting shied Coulomb potential achieves charge neutrality by projecting each atom charge,qj, fromqionto the edge of the solvation sphere. Therefore, everyjth
atom in the solvation sphere of atomihas a charge of equal but opposite sign set at the cut-off(Rc). This results in an articially neutral solvation sphere for every ith atom, which effectively makes the system charge neutral.
EWolf¼1 2
XN
i¼1
X
jðiÞ rij\Rc
"
qiqjerfcarij
rij rijlim/Rc q
iqjerfcðaRcÞ
Rc
!#
erfcðaRcÞ 2Rc þ
affiffiffiffi p p XN
i¼1
q2 i
whereqiandqjare point charges,rijis the intermolecular distance between atoms iandj,ais the damping coefficient inA˚1andRcis the cut-offdistance. To obtain
accurate electrostatic contributions, a damping function is applied. The electro-static energy decay oscillates around a rate of 1/Rc. Introducing the damping
function quickly attens the oscillations as the cut-off increases, effectively determining how fast the complementary error function falls from unity atrij¼0,
to zero at the cut-off.16The damping function adopted is the complementary error function, as it has a close connection to the Ewald sum.17The coefficient of the error function,a, denotes the rate at which convergence is achieved. A largea value will converge the energy rapidly using a short cut-off, but the errors can be larger. A smalleraleads to less contamination of the potential, but the sum will uctuate more rapidly. Assigning a value of 0 toa, results in the truncated shi ed-force (SF) potential. This SF calculation is faster than the Wolf method, but the
Faraday Discussions Paper
Open Access Article. Published on 05 March 2014. Downloaded on 24/10/2014 09:16:06.
This article is licensed under a
selection ofacan enhance the accuracy of electrostatic forces and energies by optimizing agreement to Ewald methods.18
Simple cut-offbased methods are unreliable for computing the forces, as the potential truncates abruptly at the cut-off, which causes forces to be undened if the molecule lies at the cut-off boundary. The reliance upon Ewald methods instead of efficient cut-offmethods has been discussed by Fennel and Gezelter,17 who compared the accuracy of damped shied-force (DSF) and shied potential cut-offmethods for water, argon in water, and NaCl. Benchmarking and valida-tion of the DSF potential was applied to polyelectrolyte brushes on GPUs; speedups were achieved of a factor between 1.1 and 3.9, depending on the system and size of the cut-offwith respect to PPPM.19Group based cut-offs, where the cut-offis dynamically allocated to ensure entire molecules are within the solvation shell, were investigated,17 but the energies deviated signicantly from those obtained using PME.
In this work we assess the applicability of the Wolf method to model electro-static interactions for various systems in the supercritical region of carbon dioxide. Supercritical carbon dioxide (scCO2) is an attractive‘green solvent’used
in many industrial processes, such as caffeine extraction,20polymer solvation21 and synthesis,22,23enzyme catalysis24,25and stabilization26,27and transition metal catalysis.28,29Although carbon dioxide does not possess a dipole, it has a signi -cant quadrupole30(13.41040Cm2), which means that electrostatic interactions
are an important component of interactions involving scCO2. Su and Maroncelli31
observed that neglecting electrostatic interactions,i.e., considering only Lennard-Jones interactions, led to a systematic 14% error in the solvation free energies of polymer-scCO2systems. This observation is attributed to quadrupole–dipole and
quadrupole–quadrupole interactions,31which are inherently modelled in all point charge models. A nonpolaruid should be well suited for treatment using the Wolf method, as quadrupolar interactions decay more rapidly than dipolar ones. This bodes well for the efficient electrostatic treatment of systems solvated by carbon dioxide by utilizing the Wolf method on GPU architectures. We also investigate the computational cost of the DSF method, with respect to the Wolf method.
Fluorous polymers are well known to dissolve in scCO2,32,33which has been
partially explained by 19F-NMR experiments, which suggested a number of specic interactions between carbon dioxide and theuorous solute that increase the solubility.34Many biomolecular systems are stable in the presence of scCO
2,
but this is dependent on the species, the water content, and experimental conditions.24Protein stability can be observed when scCO
2solvates the
hydro-phobic residues, and water solvates the polar/hydrophilic residues.26 Water possesses a strong dipole moment, which will make it less amenable to treatment with the Wolf method. We aim to follow this work with an investigation for protein systems solvated by water and carbon dioxide.
To assess the applicability of the Wolf method to systems containing carbon dioxide, important physical quantities, such as PVT relationships and diffusion coefficients, can be calculated and compared with the values calculated using PPPM. The applicability of the Wolf method to study methane plus carbon dioxide gas hydrates has been reported, and the results show good agreement between lattice sum and reactioneld methods.35Analysis of the convergence behaviour of the Wolf method by Angoshtari and Yavari36shows the method to be
Paper Faraday Discussions
Open Access Article. Published on 05 March 2014. Downloaded on 24/10/2014 09:16:06.
This article is licensed under a
robust, but convergence can be problematic if poor choices are made for the cut-offoravalues. In our study, we investigate the effect of increasing the polarity of theuid by incorporating diuoromethane molecules, which possess a strong dipole. For low polarity systems the Wolf method should be well suited, but as the polarity increases the effect of long-range dipole interactions will become important and we assess the point where Ewald techniques will become necessary.
2.
Method
[image:4.442.63.381.515.613.2]LAMMPS is a multi-purpose MD code,37 which is widely used in the elds of atomistic, coarse-grained and mesoscopic simulations. The code can process massive numbers of particles per simulation, which it achieves using an opti-mized spatial decomposition technique. The GPU optiopti-mized version, written in CUDA C, can run over multiple GPUs, either in conjunction with the CPU or entirely on the GPU. We have implemented the Wolf method into LAMMPS-CUDA the GPU-exclusive version of LAMMPS and LAMMPS-GPU the CPU/GPU imple-mentation, as a new potential incorporating Lennard-Jones and electrostatic interactions. LAMMPS-CUDA was written exclusively for use with CUDA, but LAMMPS-GPU can be compiled and run on AMD GPUs and other applicable accelerators using OpenCL. The new pair style is implemented as a double potential function in LAMMPS as lj/charmm/coul/wolf for CPU, lj/charm/coul/ wolf/cuda for LAMMPS-CUDA and lj/charm/coul/wolf/gpu for LAMMPS-GPU. The LAMMPS-CUDA version is solely GPU based, with the exception ofle I/O and pre/ post simulation setup. The GPU version of LAMMPS utilizes the GPU for the force and/or neighbour list generation, whilst all other operations and I/O are per-formed on the CPU. The GPU version allows fornCPUs to be used per GPU, whilst the LAMMPS-CUDA version only allows for one CPU per GPU. An important difference between packages is that the GPU version on LAMMPS uses the CPU to calculate FFTs for PPPM, whilst the LAMMPS-CUDA version performs the calcu-lation on the GPU. We have also implemented the DSF implementations, lj/ charm/coul/dsf/cuda and lj/charm/coul/dsf/gpu, for benchmarking purposes. We used the CHARMM38Lennard-Jones potential in the AB form with a switching function in conjunction with the Wolf method. A cut-offof 2.5swas used for the Lennard-Jones potential, and tapered to zero at 2.65s, wheres was calculated
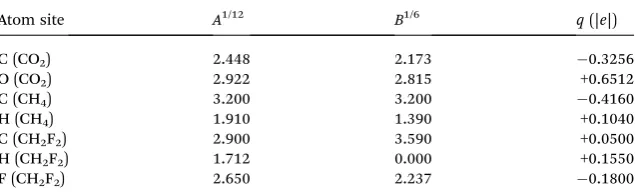
Table 1 EPM2 force field parameters for carbon dioxide39 and Palmer and Anchell
parameters for methane and difluoromethane.40(
A1/12) and (B1/6) have units ((kcal mol)1/12 ˚
A) and ((kcal mol)1/6˚A) respectively
Atom site A1/12 B1/6 q(|e|)
C (CO2) 2.448 2.173 0.3256
O (CO2) 2.922 2.815 +0.6512
C (CH4) 3.200 3.200 0.4160
H (CH4) 1.910 1.390 +0.1040
C (CH2F2) 2.900 3.590 +0.0500
H (CH2F2) 1.712 0.000 +0.1550
F (CH2F2) 2.650 2.237 0.1800
Faraday Discussions Paper
Open Access Article. Published on 05 March 2014. Downloaded on 24/10/2014 09:16:06.
This article is licensed under a
from A1/12in Table 1. We used the rigid EPM2 atomistic forceeld39to represent carbon dioxide and parameters derived by Palmer and Anchell40 to represent Lennard-Jones and charge interactions for methane and diuoromethane.
We utilized the LAMMPS soware to simulate scCO2 at several densities,
comparing the results obtained by using PPPM or the Wolf method. We selected a tolerance setting of 0.0001 for the calculations involving PPPM that enables the root mean square error to be within a factor of 10 000 of the reference force, which is calculated analytically for short-range interactions41 and in k-space.42 The optimum value ofawas investigated for binary mixtures of carbon dioxide and methane or diuoromethane. The criterion for selectingais the level of agree-ment between the Coulombic energies computed by PPPM and Wolf. To consider the effects of neglecting only the periodic long-range Coulombic effects, we treat the cut-offas being half the length of the simulation box. We also investigate the level of approximation that arises from use of a quarter box cut-offin conjunction with the Wolf method.
2.1 Benchmarking GPU electrostatics
Two boxes of 10 000 and 50 000 carbon dioxide molecules were constructed with a molar density of 0.01 mol cm3 and minimized for 1000 iterations using the
conjugate gradient method, to an energy tolerance of 1 106kcal mol1. Both
systems were heated from 0 K to 308.2 K using the Nos`e–Hoover thermostat43with a damping time of 500 fs for 2 ns, followed by 5 ns of equilibration at 308.2 K. We evaluated the performance of the Wolf method on two GPU architectures, Tesla (Tesla C1060) and Kepler (Tesla K10). The K10, released in 2012, is designed for high throughput calculations performed in single precision. The number of giga oating-point operations per second (GFLOPs) is 4577 in single precision, compared to 933 for the C1060. This improvement was achieved in part by increasing the number of cores in the streaming multiprocessor from 8 (Tesla), 32 (Fermi) to 192 (Kepler). Memory bandwidth on the GPU to global memory is 103 GB s1for the C1060, but 320 GB s1for Kepler K10. We include an eight core Intel Xeon (E5-2609) CPU for benchmarking purposes that has an approximate 77 GFLOPs with 34 GB s1 bandwidth to RAM. Calculations were performed using single-precision on two separate nodes, both comprise an eight core Xeon CPU and either a Kepler K10 or two Tesla C1060. Multiple GPU tests were only carried out using the C1060, which yielded an almost two-fold increase in performance, which corresponds well to the linear dependency. We use the FFTW 3.3.1 library in single-precision for allk-space calculations of PPPM. We considered two modes for calculations using LAMMPS-GPU, one where all force and neighbour calculations are performed on the LAMMPS-GPU, and the other where the force and neighbour calculations are dynamically assigned between CPU and GPU. We used the CUDA 5.0 Tokito (GPU driver v. 304.54), which has produced a noticeable improvement in performance over CUDA 4.0. A new feature, CUDA dynamic parallelism, allows kernels running on the GPU to spawn more grids and to continue to generate work depending on the calculation.44This feature has not been incorporated in our study.
2.2 Pure carbon dioxide
The 10 000 carbon dioxide molecule system was used to generate densities (box lengths) of 0.001 (255.1 A), 0.002 (202.5˚ ˚A), 0.004 (160.72 A), 0.005 (149.2˚ ˚A),
Paper Faraday Discussions
Open Access Article. Published on 05 March 2014. Downloaded on 24/10/2014 09:16:06.
This article is licensed under a
0.01 (118.42˚A) and 0.02 (94.0A) mol cm˚ 3, all within the supercritical region at 308.2 K. Each box was minimized for 1000 iterations using the conjugate gradient method, with an energy tolerance of 1106kcal mol1. The system was heated in the NVT ensemble using the Nos`e–Hoover thermostat43 with cubic periodic boundary conditions from 0 K to 308.2 K for 1 ns using a 1 fs time step. This was followed by 1 ns of equilibration. Integration was performed using the time-reversible velocity Verlet algorithm.45The procedure was repeated nine times to generate different equilibrated congurations for the purposes of error analysis, and the resulting standard deviation is noted in the error bars. The mean square displacement (MSD) of the centre of mass of carbon dioxide was obtained by calculating the gradient of the linear portion of the relationship between MSD and lag time over 10 ns production dynamics in the NVT ensemble. The pressures were obtained every 50 fs, and averaged over 10 ns to calculate the PVT relationship.
2.3 Carbon dioxide and solute
To study the effects of polar and non-polar solutes, we considered different quan-tities of methane and diuoromethane molecules. Five boxes of 10 000 carbon dioxide molecules were constructed with mole fractionsc(solute) ¼0.0001, 0.001,
0.01, 0.09 and 0.5, where the solute was either methane or diuoromethane. These systems correspond to box lengths (A) of 95.01, 95.99, 97.49, 99.27 and 125.31 for˚ CH4/CO2and 81.64, 81.78, 81.83, 84.44 and 105.16 for CH2F2/CO2. Each system was
minimized and heated to 308.2 K using the same procedure as above. The pressure was equilibrated to 80 atmospheres (corresponding to a molar density of0.02 mol cm3), using the Berendsen barostat46with a 1 ps damping time for 20 ns with a 1 fs time step. The procedure was repeated nine times to generate different equilibrated congurations for the purposes of error analysis, and the resulting standard devi-ation is noted in the error bars. The MSDs of carbon dioxide and solutes were obtained from the linear portion of the relationship over a production run of 10 ns. We compare the errors in Coulombic energy with respect toaforc(solute)¼ 0.09
with PPPM and Wolf, which we performed by decomposing the energy into group contributions. We investigate the relationship between system polarity and diff u-sion coefficients, and the total Coulombic energy.
One method of quantifying the transport properties of a system is the MSD, and thus the diffusion coefficient using the Einstein relationship.
D¼ lim
t/tlag 1 6t
D
½riðtÞ rið0Þ2
E
whereDis the macroscopic diffusion coefficient,ri(t) is the position of the centre
of mass at timet,ri(0) is the initial position of the centre of mass,tlagis the lag
time, andh[ri(t)ri(0)]2iis the ensemble averaged MSD. The diffusion coefficient
is calculated from the slope of the MSD against lag time,47which is a measure of the atomic displacements through time.
The pressure of a system can be calculated using the virial equation (below), and the PVT relationship has an inuence on the diffusion coefficients.48The long-range part of PPPM has a different contribution to the pressure.49
PV¼NkBTþ1
x
* XN
i¼1 ri:Fi
+
Faraday Discussions Paper
Open Access Article. Published on 05 March 2014. Downloaded on 24/10/2014 09:16:06.
This article is licensed under a
whereP is the pressure of the system, V is the volume,N is the number of particles,xis the dimensionality,KBis the Boltzmann constant and the term in
brackets is the total intermolecular force multiplied by the interaction distances.
3.
Results
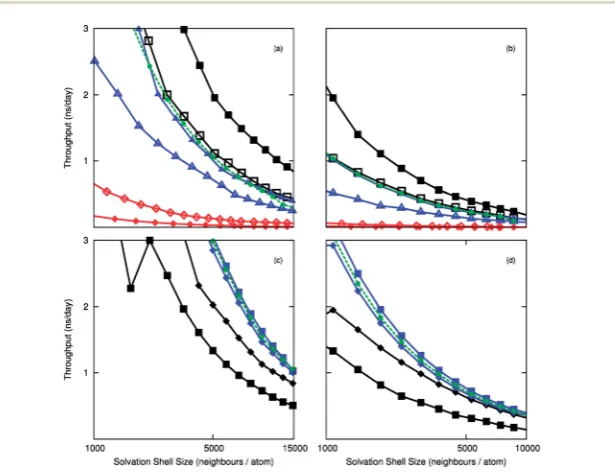
3.1 BenchmarkingTo compare the efficiency of the Wolf method, we measured the computational throughput of the electrostatic routines using the 10 000 and 50 000 molecule systems. The timings of the implementations are calculated with respect to the number of neighbours in the cut-off sphere. Fig. 1(a) and 1(b) compare the throughput for different architectures, and show the acceleration gained when substituting PPPM for Wolf using LAMMPS-CUDA. The computational throughput is almost twice as high with the Wolf treatment than with PPPM. The Wolf method is slower than PPPM on the CPU, which is unexpected, but the CPU is well suited to handle FFTs that feature in PPPM. This is due to faster memory accesses between cache and compute cores, and the less parallel nature of the algorithm. The DSF method is marginally slower than PPPM in LAMMPS-CUDA, but is marginally faster than the Wolf method for the LAMMPS-GPU
Fig. 1 Computational throughput as a function of number of neighbours for (a,c) 10 000 CO2molecules (B-D) 50 000 CO2molecules. Fig. (a) and (B) were calculated using the
LAMMPS-CUDA package, and (c) and (d) were calculated using the LAMMPS-GPU package. In (a) and (B), three electrostatic treatments were considered, Wolf (filled shapes), PPPM (unfilled shapes) and DSF (green circles) for different architectures. (Triangles ¼ Tesla C1060, squares¼Kepler K10, diamonds¼eight core Intel Xeon). Infigures (c) and (d) the force/neighbour implementation is shown where the GPU is used exclusively (dia-monds) and dynamically assigned between CPU/GPU (squares). PPPM is shown in black, the Wolf method is shown in blue, and the DSF force/neigh exclusively GPU is shown in green.
Paper Faraday Discussions
Open Access Article. Published on 05 March 2014. Downloaded on 24/10/2014 09:16:06.
This article is licensed under a
[image:7.442.70.378.272.508.2]implementation. The difference between pair styles using LAMMPS-GPU is much less pronounced than LAMMPS-CUDA, where the acceleration gained by using the Wolf or DSF method is approximately 1.5 times faster. The difference between dynamic partitioning and exclusive GPU computation is small for the cut-off methods, and the dynamic mode is marginally quicker. For PPPM the opposite is observed, which could be due to the CPU already being used for the k-space calculations. The Kepler K10 GPU shows the greatest acceleration, which bodes well for future GPU releases.
3.2 Optimum alpha and cut-offparameters
We considerrst the accuracy of the electrostatic energy and its convergence as a function ofaand cut-offdistance. We then turn to the properties computed from the simulation, considering structural, dynamic and thermodynamic aspects. The simulations have all been executed in the supercritical region of carbon dioxide, and therefore each molecule has a large number of neighbours in the solvation sphere. We compare the effects of selecting avalues between zero and 0.3 in intervals of 0.025. We decompose the energy interactions into pairwise group contributions to the total Coulombic energy for CH4in carbon dioxide, and CH2F2
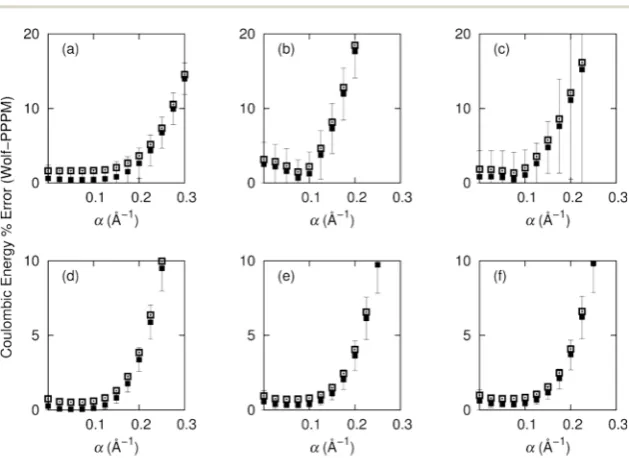
in carbon dioxide. The relationship between a and the accuracy of the Wolf summation method is shown in Fig. 2.
We observe for half box cut-offs the best agreement for Wolf is at low values of a, where for both the polar and non-polar systems the optimum value forais
Fig. 2 Percentage error in Coulombic energy between PPPM and Wolf with respect toa for CH4/CO2and CH2F2/CO2binary mixtures forc(solute)¼0.1 at 308.2 K, 80
atmo-spheres. The results are decomposed into (a) (CH2F2) CO2–CO2pair errors (B) (CH2F2)
CH2F2–CH2F2pair errors, (c) (CH2F2) CO2–CH2F2pair errors, (d) (CH4) CO2–CO2pair
errors, (e) (CH4) CH4–CH4pair errors and (f) (CH4) CO2–CH4pair errors. The black squares
and error bars indicate the average error and uncertainty for a half box cut-off, whilst the empty squares show the average error for a quarter box cut-off.
Faraday Discussions Paper
Open Access Article. Published on 05 March 2014. Downloaded on 24/10/2014 09:16:06.
This article is licensed under a
[image:8.442.64.379.308.537.2]0.075. For non-polar systems increasingabeyond 0.2 results in an2–3% error (with respect to the PPPM Coulombic energy), whilst for the polar system the average error is 20%. The non-polar CH4/CO2 system resulted in the lowest
average errors of 0.05% for CO2–CO2interactions, 0.39% for CO2–CH4and 0.34%
for CH4–CH4. We observe a similar trend for the polar system of CO2/CH2F2with
increased average errors of 0.44% for CO2–CO2, 0.47% for CO2–CH2F2and 0.67%
for CH2F2–CH2F2. Ata¼0.075 the greatest variance in the non-polar system iss2 ¼0.2 for CH4–CH4, and for the polar system the maximum variance iss2¼2.94
for CH2F2–CH2F2.
A quarter box cut-off gives greater errors in the Coulombic energies, but follows the same trends as the half box cut-off. For the non-polar system the optimum value forais 0.05, which is seen for all pair interactions of methane and carbon dioxide.
The average error increases to 0.5% for CO2–CO2and to0.75% for energies
involving interactions with methane. The errors vary more when used with the polar system over a wide range ofa, but ata¼0.075 the error for all interactions is below 2%. The error increases sharply for the polar system with varyinga. For interactions between CH2F2–CH2F2 the variance is higher than for methane,
which can be attributed to the high polarity of both substituents.
3.3 Pure carbon dioxide
Diffusion coefficients of scCO2calculated from MD simulations using the Ewald
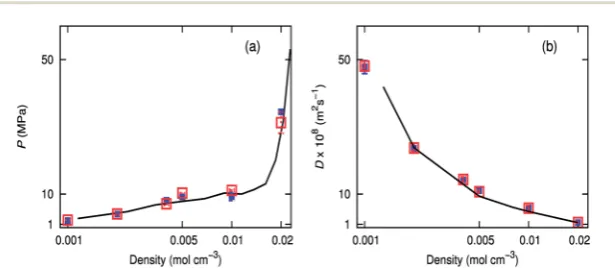
sum50have been previously compared with experimental results.51Our simula-tions show that the Wolf method gives diffusion coefficients comparable to that of PPPM (Fig. 3b). Calculations were concurrently run on the CPU using the Wolf method, and the energies were within three decimal places. Simulations were also performed at 323.2 K, which show good agreement between PPPM and the Wolf method.†Low density boxes using the Wolf method show the best agreement, but all the densities investigated are within the bounds of error of PPPM. Pressures obtained over a range of densities coincide well with an equation of state,52for both the Wolf and PPPM implementations (Fig. 3a). Both electrostatic methods
Fig. 3 (a) Diffusion coefficients for pure carbon dioxide obtained for PPPM (empty red squares) and Wolf (filled blue squares), compared with experimental (black line) at 308.2 K. b) PVT relationship of pure carbon dioxide simulated using PPPM (empty red squares) or the Wolf method (filled blue squares) compared with experimental (black line) at 308.2 K.
Paper Faraday Discussions
Open Access Article. Published on 05 March 2014. Downloaded on 24/10/2014 09:16:06.
This article is licensed under a
[image:9.442.69.377.432.566.2]capture the PVT relationship properties at high and low densities, for both temperatures studied.
3.4 Binary mixture of carbon dioxide with diuoromethane or methane
The Coulombic energy for the polar systems is compared for different mole fractions of diuoromethane using the Wolf method and PPPM. As the system becomes more polar, the error of the Wolf method with respect to the PPPM value becomes greater. Fig. 4 shows the total PPPM Coulombic energy, and results fora ¼0.2 anda¼0.075. For the system containing 100 diuoromethane molecules, the error is within 0.2% and 1.8% fora¼0.075 anda¼0.2 respectively. As the composition tends towards a 1 : 1 ratio, the errors increase, which indicates, as anticipated, that the Wolf approach is not suitable when the system becomes highly polar. The errors fora¼0.075 are reasonable (0.9%) but fora¼0.2 the errors are 3%. We observe better agreement for methane. For the 1 : 1 binary mixture, the error ina¼0.2 is 1.8% anda¼0.075 is 0.15%. The total Coulombic energy for diuoromethane is more negative than for methane, which can be explained by NPT dynamics resulting in a lower volume box and therefore closer contacts.
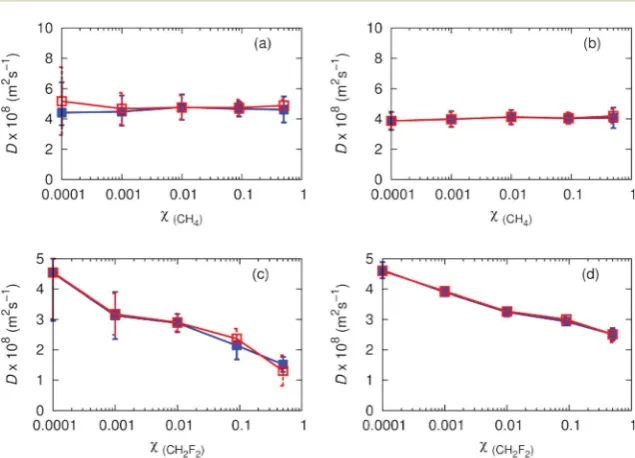
Experimental results from O'Hern and Martin51indicate pure carbon dioxide has a diffusion coefficient of 5 (108m2s1) at 308.2 K, 80 atmospheres. The non-polar binary mixture of CH4/CO2has a diffusion coefficient of5 (108m2s1)
for the inclusion of one methane molecule in 10 000 molecules of carbon dioxide
Fig. 4 Total Coulombic energy for methane and difluoromethane in carbon dioxide at 308.2 K, 80 atmospheres. The dashed red line indicates the total PPPM energy, whilst the green squares indicatea¼0.2 and the blue squares indicatea¼0.075.
Faraday Discussions Paper
Open Access Article. Published on 05 March 2014. Downloaded on 24/10/2014 09:16:06.
This article is licensed under a
[image:10.442.92.377.309.578.2](Fig. 5). As the number of methane molecules increases, the overall diffusion coefficients remain relatively constant. Diffusion coefficients for CH4and carbon
dioxide are similar, with an average increase of0.6 ( 108 m2 s1) between carbon dioxide and CH4. Asc(solute)increases, the accuracy of the solute diffusion
coefficients increase, due to better averaging from more solute molecules. With the exception ofc(solute)¼0.0001 where averaging is poor, the agreement between
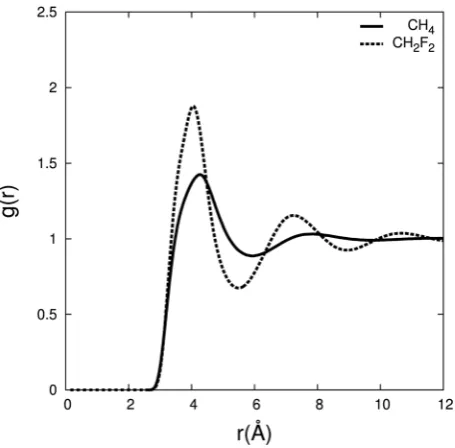
Wolf and PPPM is good. We observe a reduction in diffusion coefficients for diuoromethane as the polarity increases. The values decay from 4.5 (108m2 s1), to 1.3 (108 m2 s1), which can be attributed to favourable interactions between solute and solvent. Agreement between Wolf and PPPM is good, although there is an observable increase in the error in the diffusion coefficients for diuoromethane when the fraction of solute reaches 10%. This indicates the diuoromethane interacts strongly with carbon dioxide, thus limiting diffusion. To characterise the interactions between diuoromethane and carbon dioxide, we calculate the radial distribution (RDF) between the centre of mass for CH4/CO2
and CH2F2/CO2 (Fig. 6) and the associated residence times and coordination
numbers are shown in Table 2.
The RDF shows a larger density of carbon dioxide molecules in the di uoro-methane mixture in therst and second solvation shell compared to methane. The same trend was noticed in the RDF by Doet al.,53where therst solvation shell has a higher density for diuoromethane than for methane. The number of carbon dioxide molecules present in therst and second solvation shells is30% higher for diuoromethane, and carbon dioxide resides about four times longer compared to methane. This indicates that carbon dioxide has a higher affinity for diuoromethane.
Fig. 5 Diffusion coefficients for (a) CH4in CO2/CH4(B) CO2in CO2/CH4(c) CH2F2in CO2/
CH2F2and (d) CO2in CO2/CH2F2at 308.2 K, 80 atmospheres. Filled blue squares and error
bars indicate diffusion coefficients obtained using PPPM, and empty red squares and error bars indicate diffusion coefficients obtained using the Wolf summation method.
Paper Faraday Discussions
Open Access Article. Published on 05 March 2014. Downloaded on 24/10/2014 09:16:06.
This article is licensed under a
[image:11.442.62.380.337.566.2]4.
Conclusions and discussion
The Wolf method shows good agreement with PPPM when modelling the elec-trostatic interactions of scCO2 on GPUs for non-polar systems, whilst being
approximately twice as fast. The choice ofais important, and may need to be investigated on a case by case basis to enable satisfactory agreement. For modelling carbon dioxide in the supercritical region it is advisable to use a half-box cut-offand a low value fora. In this investigation, all values ofaless than 0.15 produced errors less than 2% for non-polar interactions, whilst polar interactions requireato be less than 0.1. Upon increasing the polarity of the system, the Fig. 6 Radial distribution function between the centre of mass of carbon dioxide and CH4
[image:12.442.108.336.29.253.2](solid line), and CH2F2(dashed line) forc(solute)¼0.1 at 308.2 K, 80 atmospheres.
Table 2 Residence times and coordination for the centre of mass of carbon dioxide in CH4and CH2F2forc(solute)¼0.1 at 308.2 K, 80 atmospheres
Shell
Distance limit (˚A)
Residence time –Wolf (ps)
Residence time –PPPM (ps)
Coordination number - Wolf
Coordination number - PPPM
Methane
1st 0.00–5.95 1.2 1.2 8.6 8.6
1st+ 2nd 0.00–9.60 2.6 2.5 37.2 37.1
2nd 5.95–9.60 1.3 1.3 28.6 28.5
Diuoromethane
1st 0.00–5.65 4.6 4.6 12.1 12.1
1st+ 2nd 0.00–9.24 10.5 10.3 55.6 55.6
2nd 5.65–9.24 5.9 5.7 45.5 45.5
Faraday Discussions Paper
Open Access Article. Published on 05 March 2014. Downloaded on 24/10/2014 09:16:06.
This article is licensed under a
[image:12.442.62.381.330.462.2]potential begins to degrade. Errors of the Wolf method with respect to PPPM are approximately 0.2% when considering a 100 : 1 mixture of carbon dioxide and diuoromethane witha¼0.075. We observe a strong affinity of carbon dioxide to diuoromethane compared to methane, which can be seen by a decline in diffusion coefficients with increasing mole fraction of solute. Carbon dioxide resides about four times longer in the solvation sphere of diuoromethane compared to methane.
We can conclude that the signicance of using the Wolf method on GPUs allows simulations to reach timescales twice as long as those run with PPPM, without signicant loss in accuracy for a carefully chosen value ofafor non-polar and mildly polar systems. We aim to follow up the investigation with further analysis of solvent–solute interactions and the study of uorinated polymers, which have high solubilities in scCO2. We will be investigating the free energy
changes ofuorinated polymers, with an aim of further understanding the high affinity of uorous polymers for carbon dioxide. Many free energy methods require long timescales in order to reach convergence; utilizing the Wolf method for this purpose will help achieve this goal.
Acknowledgements
This work was supported by the EPSRC, grants EP/I006559/1 and EP/K000128/1. We are grateful for access to the University of Nottingham High Performance Computing facility and MidPlus High Performance Computing facility. We appreciate useful discussions with Professor Paul Kelly and his co-workers (Imperial College) and Dr Chris Skylaris (University of Southampton). We thank Drs Richard Wheatley and Hainam Do for their critical reading of the manuscript.
References
1 J. E. Stone, J. C. Phillips, P. L. Freddolino, D. J. Hardy, L. G. Trabuco and K. Schulten,J. Comput. Chem., 2007,28, 2618.
2 I. Buch, M. J. Harvey, T. Giorgino, D. P. Anderson and G. De Fabritiis,J. Chem. Inf. Model., 2010,50, 397.
3 J. A. Baker and J. D. Hirst,Mol. Inf., 2011,30, 498.
4 M. J. Harvey and G. De Fabritiis,Wiley Interdiscip. Rev.: Comput. Mol. Sci., 2012, 2, 734.
5 M. P. Allen and D. J. Tildesley, Computer Simulation of Liquids, Oxford University Press, 1989.
6 W. F. van Gunsteren and H. J. C. Berendsen,Angew. Chem., Int. Ed. Engl., 1990, 29, 992.
7 M. Bergdorf, C. Peter and P. H. H¨unenberger,J. Chem. Phys., 2003,119, 9129. 8 B. R. Brooks, R. E. Bruccoleri, B. D. Olafson, D. J. States, S. Swaminathan and
M. Karplus,J. Comput. Chem., 1983,4, 187. 9 P. P. Ewald,Ann. Phys., 1921,369, 253–287.
10 R. Hockney and J. Eastwood,Computer Simulation Using Particles, CRC Press, 1981.
11 T. Darden, D. York and L. Pedersen,J. Chem. Phys., 1993,98, 10089.
12 U. Essmann, L. Perera, M. L. Berkowitz, T. Darden, H. Lee and L. G. Pedersen, J. Chem. Phys., 1995,103, 8577.
Paper Faraday Discussions
Open Access Article. Published on 05 March 2014. Downloaded on 24/10/2014 09:16:06.
This article is licensed under a
13 M. J. Harvey and G. De Fabritiis,J. Chem. Theory Comput., 2009,5, 2371. 14 W. M. Brown, A. Kohlmeyer, S. J. Plimpton and A. N. Tharrington,Comput.
Phys. Commun., 2012,183, 449.
15 D. J. Hardy, J. E. Stone and K. Schulten,Parallel Comput., 2009,35, 164. 16 D. Wolf, P. Keblinski, S. R. Phillpot and J. Eggebrecht,J. Chem. Phys., 1999,110,
8254.
17 C. J. Fennell and J. D. Gezelter,J. Chem. Phys., 2006,124, 234104.
18 J. S. Hansen, T. B. Schrøder and J. C. Dyre,J. Phys. Chem. B, 2012,116, 5738. 19 T. D. Nguyen, J.-M. Y. Carrillo, A. V. Dobrynin and W. M. Brown,J. Chem.
Theory Comput., 2013,9, 73.
20 H. Peker, M. P. Srinivasan, J. M. Smith and B. J. McCoy,AIChE J., 1992,38, 761. 21 Z. Li and C. K. Hall,Langmuir, 2005,21, 7579.
22 J. Jennings, M. Beija, A. P. Richez, S. D. Cooper, P. E. Mignot, K. J. Thurecht, K. S. Jack and S. M. Howdle,J. Am. Chem. Soc., 2012,134, 4772.
23 H. Lee, E. Terry, M. Zong, N. Arrowsmith, S. Perrier, K. J. Thurecht and S. M. Howdle,J. Am. Chem. Soc., 2008,130, 12242.
24 Z. Wimmer and M. Zarev´ucka,Int. J. Mol. Sci., 2010,11, 233. 25 A. Gießauf and T. Gamse,J. Mol. Catal. B: Enzym., 2000,9, 57.
26 R. L. Silveira, J. Mart´ınez, M. S. Skaf and L. Mart´ınez,J. Phys. Chem. B, 2012, 116, 5671.
27 H.-L. Liu, W.-C. Hsieh and H.-S. Liu,Biotechnol. Prog., 2004,20, 930. 28 W. Leitner,Acc. Chem. Res., 2002,35, 746.
29 D. J. Heldebrant and P. G. Jessop,J. Am. Chem. Soc., 2003,125, 5600. 30 D. M. D'Alessandro, B. Smit and J. R. Long,Angew. Chem., Int. Ed., 2010,49,
6058.
31 Z. Su and M. Maroncelli,J. Chem. Phys., 2006,124, 164506.
32 J. M. Desimone, Z. Guan and C. S. Elsbernd,Science, 1992,257, 945.
33 S. P. Nalawade, F. Picchioni and L. P. B. M. Janssen,Prog. Polym. Sci., 2006,31, 19.
34 A. Dardin, J. M. DeSimone and E. T. Samulski,J. Phys. Chem. B, 1998,102, 1775.
35 A. Sadeghifar, M. Dadvar, S. Karimi and A. F. Ghobadi,J. Mol. Graphics Modell., 2012,38, 455.
36 A. Angoshtari and A. Yavari,Phys. Lett. A, 2011,375, 1281. 37 S. Plimpton,J. Comput. Phys., 1995,117, 1.
38 A. D. MacKerell, D. Bashford, R. L. Dunbrack, J. D. Evanseck, M. J. Field, S. Fischer, J. Gao, H. Guo, S. Ha, D. Joseph-McCarthy, L. Kuchnir, K. Kuczera, F. T. K. Lau, C. Mattos, S. Michnick, T. Ngo, D. T. Nguyen, B. Prodhom, W. E. Reiher, B. Roux, M. Schlenkrich, J. C. Smith, R. Stote, J. Straub, M. Watanabe, J. Wi´orkiewicz-Kuczera, D. Yin and M. Karplus, J. Phys. Chem. B, 1998,102, 3586.
39 J. G. Harris and K. H. Yung,J. Phys. Chem., 1995,99, 12021. 40 B. J. Palmer and J. L. Anchell,J. Phys. Chem., 1995,99, 12239. 41 J. Kolafa and J. W. Perram,Mol. Simul., 1992,9, 351.
42 M. Deserno and C. Holm,J. Chem. Phys., 1998,109, 7694. 43 W. Hoover,Phys. Rev. A: At., Mol., Opt. Phys., 1985,31, 1695. 44 NVIDIA,CUDA Dynamic Parallelism Programming Guide, 2012. 45 W. C. Swope,J. Chem. Phys., 1982,76, 637.
Faraday Discussions Paper
Open Access Article. Published on 05 March 2014. Downloaded on 24/10/2014 09:16:06.
This article is licensed under a
46 H. J. C. Berendsen, J. P. M. Postma, W. F. van Gunsteren, A. DiNola and J. R. Haak,J. Chem. Phys., 1984,81, 3684.
47 X. Michalet,Phys. Rev. E: Stat., Nonlinear, SoMatter Phys., 2010,82, 041914. 48 Y. Iwai, H. Higashi, H. Uchida and Y. Arai,Fluid Phase Equilib., 1997,127, 251. 49 S. Nos´e and M. L. Klein,Mol. Phys., 1983,50, 1055.
50 H. Higashi and K. Tamura,Mol. Simul., 2010,36, 772. 51 H. A. O'Hern and J. J. Martin,Ind. Eng. Chem., 1955,47, 2081. 52 R. Span and W. Wagner,J. Phys. Chem. Ref. Data, 1996,25, 1509. 53 H. Do, R. J. Wheatley and J. D. Hirst,J. Phys. Chem. B, 2010,114, 3879.
Paper Faraday Discussions
Open Access Article. Published on 05 March 2014. Downloaded on 24/10/2014 09:16:06.
This article is licensed under a