The Development of the Renewable Energy
Technologies in Spain
Félix Hernández1, Miguel Hernández-Campos2
1Institute of Economics, Geography and Demography (Spanish National Research Council), Madrid, Spain; 2Foundation Gómez Pardo,
Madrid, Spain.
Email: [email protected]
Received February 16th, 2011; revised March 14th, 2011; accepted March 18th, 2011.
ABSTRACT
This article examines the development of the four main renewable energy technologies (RET) in Spain in the latest years: biomass, small hydro (SH), solar photovoltaic (solar PV) and wind. It has been studied the variation of the working time per MW installed available from the on line data base of Spanish National Commission on Energy
(SNCE), in the national context and in each of the Autonomic Communities (AACC). We have also obtained the mar-ginal cost curve of the global RE. The main conclusions of the study are that Spain is effective meeting the RE genera-tion target but not efficient in costs and in short term it is not any RETs that can achieve competitive price comparing to the electrical market.
Keywords: Renewable Energy Technologies, Working Time per MW, Feed-in Tariff, Marginal Cost Curve of the Global RE
1. Introduction
Most of EU governments have adopted measures aimed in promoting of the Renewable Energy Technologies (RETs). The degree of success of these measures has been variable in terms of efficiency in costs and deployment effectiveness [1]. Spain has been cited as an example for its success to get more RETs in place through a feed-in tariff (FIT) system, but there are serious concerns about their rising costs. In fact, FIT are the most effective sys-tem to a rapid deployment of RETs, but when it is in place the installations capacity (in MW) increase spec-tacularly, often with undesirable effects. For example, in the future some RETs could not survive financially un- less their subsidies come at the expense of customers. Wang [2] already warned that Spain had to drastically reduce its FIT payments to Solar PV projects and impose caps on annual installed capacity of this TER.
It is necessary therefore to find a comparative para- meter that gives some light about the rhythm installed capacity in relation with the number of annual full load hours of the RETs. Couture and Gagnon [3] speak about the per-kWh payments adjusted on the number of annual full load hours, referring this term to the hypothetical number of hours in which a RET would need to operate
to produce its annual production.
The current paper studies the development of the dif-ferent RETs in Spain in the latest years. It embraces the
following special regimen1 technologies: biomass, small
hydro (SH), solar photovoltaic (solar PV) and wind. All of these are subsidized by the administration through a FIT system, added to the cogeneration, wastes and wastes treatment2, not include in this paper.
Based on the empirical data provided from www. cne.es [4] by the Spanish National Commission on
En-ergy (SNCE) reported for March 10th, 2010, all the RETs
have been analyzed developing an accurate tool that cor-relates the variation of working hours recorded during the annual production of GWh per MW installed, according to the Spanish and all Autonomic Communities (AACC).
The evolution of the equivalent FIT3 will be examine as
well as a percentage of the total retribution by the sold
1In Spain technologies of special regime charge a FIT in the electricity price and include all RET and cogeneration, wastes and treatment of wastes. The latter is excluded of the RET, as opposed some EU country. 2Wastes and waste treatment are not considered RET by the Spanish law. However, both of these are included in the RETs in some of the EU member countries.
energy and the contribution per MW for all the RETs. Finally, a marginal cost curve has been obtained from the global Renewable Energy in Spain.
2. Variation of Working Hours per MW
Installed
As a comparative parameter of the developing of all the different RETs it has been chosen the calculated working hours according to the sold GWh per MW installed, from the on line data base of SNCE. Their development with time makes possible to estimate the fulfilment of each RETs in the electric market. In fact the working hours of RETs represents the amortized income with the sale of the produced work in GWh by the whole power plants of
each RETs; the installed capacity in MW4 is the total
capital to be amortized; its quotient means the amortized index in hours/MW units. The increase of this index with time belongs to a positive integration of the RET in the electric market system. Oppositely, a decrease means lack of competitiveness of the RET in the energy market.
2.1. National Context (National Market)
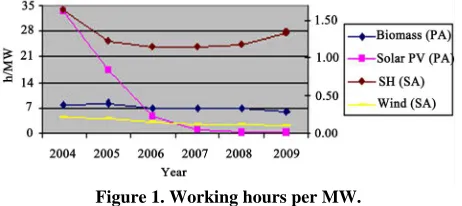
The Figure 15, represents the fluctuations between
working hours recorded in the sale of RET per MW in-stalled, in the period 2004 - 2009, of the RETs mentioned above: biomass, SH, solar PV and wind.
[image:2.595.309.540.87.190.2]As additional information from the development of the working hours per MW of the sold RETs, the following
Table 1 represents the maximum variation in percentage
from the main value for all the RETs.
From the brief analysis of the Figure 1 it can infer the
following items:
The variable working hours per MW tends to change
for each RET:
o Almost draws a symmetric function in the SH6.
o Describes a decreasing smooth line for biomass
and wind and a decreasing sharply slope in the Solar PV, due to the following causes (alternative or simultaneous):
Lack of planning between the development of power plants (installed capacity increasing) and the sold working
hours per MW covered by the FIT system (decreasing).7
[image:2.595.310.534.229.292.2]Figure 1. Working hours per MW.
Table 1. Maximum variation of working hours per MW respect the average.
RET Variation respect the average (%)
Biomass 19.5 SH 36.8 Wind 60.5
Solar PV 346.8
Gradual reduction in the technological potential in
the RETs.
Problems to adjust the energy generation and the
electrical demand.
Decrease in the electrical demand.
Punctual fall in the renewable resources.
The Table 1 shows that in the case of the Solar PV,
the working time variation respect to the average is large (346.8), which means sharply variations in the energy generated for this technology in the period 2004 - 2009, that is to say, this represents an unsustainable developing of this RET [6] linked to its high FIT8.
2.2. AACC Context
The Table 2 includes the variation η between the sold
working hours per MW installed in the period 2007 -
20099 (WH
2007 - WH2009), by the SNCE, with regard the
first year recorded 2007 (WH2007). The variationhas been
calculated for all the RETs andAACC from the on line
data base of SNCE.
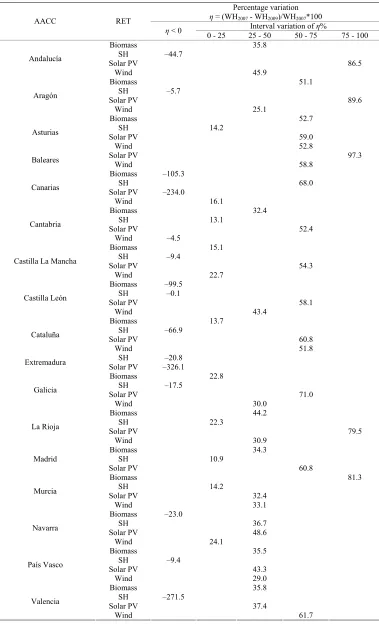
From the Table 2 we have built the Figure 2. It shows
the variation of η, divided in regular intervals, in the pe-riod 2007 - 2009 for all AACC. The Figure illustrates the change in relative frequency of the RETs, number of
times the value η appears in the corresponding row, in
relation to the interval of hours per MW considered in the Table. In fact, each RET has a maximum for a dif-ferent interval: 56.3% for SH and η < 0; 40.0% for
bio-mass and 46.7% for wind and 25% ≤η≤ 50%, and 41.2%
for Solar PV and 50 % ≤η≤ 75%.
4European Commission [5] gives a relation between the capacity and the investment cost for biomass (1,124-1,406 €/MW); SH (1,700 €/MW) and wind energy (900 €/MW).
5In the legend of the Figure the y axis on the left side is the reference of the RET followed by PA in brackets, and on the right side when the RET is followed by SA in the brackets.
6SH feedback is due to the abundance or lack of this resource each year, which defines the framework of sold energy per MW installed. It has an unpredictable short term behavior.
7This is a common problem in Spain regarding to construction permis-sions provided by the Autonomic Community of new Power Plants, however, the regulation of the FIT system is leaded by the National Administration.
8A recent monitoring report from the SNCE shows many irregularities related to the working hours recorded in the Solar PV plants.
9As it has been said before, the information provided from the SNCE is reported until March 10th, 2010.
Table 2. Percentage variation of η (2007 - 2009).
Percentage variation η = (WH2007 - WH2009)/WH2007*100
Interval variation ofη% AACC RET
η< 0 0 - 25 25 - 50 50 - 75 75 - 100 Biomass 35.8
SH –44.7
Solar PV 86.5
Andalucía
Wind 45.9
Biomass 51.1 SH –5.7
Solar PV 89.6
Aragón
Wind 25.1
Biomass 52.7
SH 14.2
Solar PV 59.0
Asturias
Wind 52.8
Solar PV 97.3
Baleares Wind 58.8
Biomass –105.3
SH 68.0
Solar PV –234.0 Canarias
Wind 16.1
Biomass 32.4
SH 13.1
Solar PV 52.4
Cantabria
Wind –4.5
Biomass 15.1
SH –9.4
Solar PV 54.3
Castilla La Mancha
Wind 22.7
Biomass –99.5
SH –0.1
Solar PV 58.1
Castilla León
Wind 43.4
Biomass 13.7 SH –66.9
Solar PV 60.8
Cataluña
Wind 51.8 SH –20.8
Extremadura Solar PV –326.1
Biomass 22.8 SH –17.5
Solar PV 71.0
Galicia
Wind 30.0
Biomass 44.2
SH 22.3
Solar PV 79.5
La Rioja
Wind 30.9
Biomass 34.3
SH 10.9
Madrid
Solar PV 60.8
Biomass 81.3
SH 14.2
Solar PV 32.4
Murcia
Wind 33.1
Biomass –23.0
SH 36.7
Solar PV 48.6
Navarra
Wind 24.1
Biomass 35.5 SH –9.4
Solar PV 43.3
País Vasco
Wind 29.0
Biomass 35.8 SH –271.5
Solar PV 37.4
Valencia
Figure 2. Percentege de variation hours per MW (2007 - 2009).
The Table 2 and the Figure 2 show the state of
de-velopment of RETs in all AACC in relation to η. The
negative sign points out that the degree of development it trends to rise, and decreasing as η, variation between the sold working hours per MW installed in the period 2007 - 2009, is growing up. Thus, we can infer that SH is the technology which development is raising the most among all the RETs and Solar PV is decreasing in the majority of AACC. We can also establish the following particu-larities from the η values:
In Canarias10, Castilla León and Navarra the
bio-mass has grown 105.3%, 99.5% and 23.0% respec-tively.
In Canarias the SH has decreased 68.0%.
Exceptionally, the Solar PV has grown in Canarias
(234.0%) and Extremadura (326.1%), and the wind in Cantabria (4.5%).
In Navarra, sold working hours of SH, Solar PV and
wind per MW has decreased harmoniously, becom-ing a rational initiative for the legal authorization granting a regulated utility to construct a RETs power plant In Canarias the SH has decreased 68.0% (see note 6).
3. Evolution of the Net Equivalent FIT per
MW Installed
The concept of feed in tariff it is really useful to check out the development of each RET comparing their com-petitiveness to the whole electricity market. According with definition above established by the SNCE, the equi- valent feed in tariff is the difference between the total retribution received for each RET and the total energy multiplied by the annual regular price in the electrical market. Therefore it is the cost of RET calculated from the on line data base of SNCE by reference of the
con-ventional energy incorporating the effect of the support policies in a straightforward way. Costs are expressed in terms of the minimal price that the investor has to obtain from the market over the lifetime of the production ca-pacity in order to make the construction of additional ca- pacity (or the production with existing capacity) attrac-tive.
In order to calculate the equivalent FIT it has just been considered the power plants that had sold the energy di-rectly through the electrical market or by a private agree- ment with a distribution company with negotiated fares and other alternative markets. So far, the net equivalent FIT it has been obtained as the subtraction of the
equiva-lent FIT minus the avoided emissions11 cost for all the
RETs12 analyzed.
The temporally development of the net equivalent FIT per MW installed, it works out as a very useful tool for checking how alike it is each RET from the competitive electricity market. This is considerate an effective indi-cator to analyze the prospects for diffusion of each RET, equivalent to a learning curve [7]. The Table 3 shows the
net equivalent FIT per MW installed during the period 2004 - 2009 that belongs to the Spanish situation.
From Table 3 it can be achieved two main
conclu-sions:
The development of the FIT per MW installed shows
maximums in the latest year of 2009 and a minimum value en the first collected years 2004 and 2005.
Therefore, it is not achieved any competitive price
comparing to the electrical market by any RET.
In the Figure 3 it is shown the changes in the net
equivalent FIT, calculated from the on linedata base of
SNCE as a percentage of the total received retribution by the annual generated energy for each RET. If the func-tions are adjusted to a logarithmic tendency line, it is confirmed that the percentage of the equivalent FIT rela-tive to the total received retribution from the different studied RETs tends to acquire in short terms values near 38.4% in the case of SH; 39.6% in wind energy; 50.9% in biomass, and 87.8% in solar PV.
From the Figure 3 it can be figure out the following
statement:
All the drawn lines as it is shown in Figure 4 tends to
increase with time, which involves low competitiveness in short term, although the biomass has the highest slope that means a bigger gap with the electrical market price comparing to other RETs.
4. Marginal Cost Curve of the Global
11The tons of CO2 avoided have been obtained per each year from theenergy mix. Source: www.idae.es.
12The total amount of the emissions avoided has been calculated by the average prize of the EU emissions market in the latest two years in €/Ton of CO2 (Source: Electric and Business System of CO2 Emissions Rights-SENDECO2).
Renewable Energy
Table 3. Net equivalent FIT per MW installed development (Thousands €/MW)*.
Technology Year
Biomass Wind SH Solar PV 2004 91.231 39.611* 69.465 255.734* 2005 87.524* 44.447 47.591* 281.763 2006 113.757 59.472 64.805 265.397 2007 157.475 55.913 63.601 271.203 2008 198.268 59.296 61.723 281.964 2009 275.132# 70.849# 102.947# 696.069# #: it represents the maximums values;
[image:5.595.62.285.106.365.2]*: it represents the minimums ones.
[image:5.595.60.283.116.263.2]Figure 3. Net equivalent feed-in tariff for each RET.
Figure 4. Marginal cost curve of RET.
tient between RET and the sold total energy at electrical market) that has contributed to the electricity generation
(x axis in Figure 4). This curve shows the evolution of
the additional cost of the RET in percentage respect the total retribution by the sold total energy at electrical mar-
ket price (y axis in Figure 4). All the parameters
neces-sary for the calculation has been taking from the on line data base of SNCE. This curve represents a test of effec-tiveness to achieve the Spanish target (rising of the glob-al TER) versus their efficiency in costs (increasing over-cost of RET) [8].
The data represented in the Figure 4, belongs to the
period from 2004 to 2009, both inclusive. From its pro-file it can be achieved two main remarks:
The function grows respect the x-axis, which means
a good approach to meet its annual target in Re-newable Electricity Generation, that is to say, the policy to achieve the Spanish objective in RE
gen-eration is resulting effective.
The last track of the curve, belonged to year 2009,
entailed a huge increase of over cost remaining to the most expensive RET, Solar PV source, whose GWh sold in the electrical market it has been duplicated this year, therefore the policy to achieve the Spanish objective in RE generation is not efficiency in costs.
5. Conclusions
Conclusions can be categorized in three principal groups:
5.1. Principal Conclusions
The two main conclusions of the study are:
The policy to achieve the Spanish objective in RE
generation is resulting effective but not efficiency in costs.
In short term it is not any RETs that can achieve
competitive price comparing to the electrical market, particularly the biomass has a bigger gap with the electrical market price comparing to other RETs.
5.2. National Context
The variable working hours per MW is a curve almost symmetric for the SH, decreasing smooth for biomass and wind and decreasing sharply for the Solar PV. The de-creasing slope can be caused by
Lack of planning between the increasing
develop-ment of the RETs power and the decreasing sold working hours per MW covered by the FIT system.
Gradual reduction in the technological potential in
the RET.
Problems to adjust the energy generation and the
electrical demand.
Decrease in the electrical demand.
Punctual fall in the renewable resources.
In the case of the Solar PV, its high FIT represents an unsustainable developing of this RET.
5.3. AACC Context
SH is the technology which development is raising the most among all the TERs and Solar PV is decreasing in the majority of AACC. We can also establish the follow-ing conclusions particular:
In the period 2007 - 2009, the Solar PV has grown
exceptionally in Canarias (234.0%) and Extremadura (326.1%), and the wind in Cantabria (4.5%). It is also singular that SH has decreased 68.0% in Ca-narias.
In Navarra, the development of SH, Solar PV and
[image:5.595.59.284.374.474.2]REFERENCES
[1] P. Komor and M. Bazilian, “Renewable Energy Policy Goals, Programs and Technologies,” Energy Policy, Vol. 33, No. 14, 2005, pp. 1873-1881.
doi:10.1016/j.enpol.2004.03.003
[2] U. Wang, “Spain: The Solar Frontier No More,” Green-tech Media, May 2009, accessed at 2 June 2009. www.greentechmedia.com
[3] T. Couture and Y. Gagnon, “An Analysis of Feed-in Tar-iff Remuneration Models: Implication of Renewable En-ergy Investment,” EnEn-ergy Policy, Vol. 38, 2010, pp. 955-965. doi:10.1016/j.enpol.2009.10.047
[4] CNE, “CNE Renewable Energy Statistics,” 2010. www.cne.es
[5] European Commission, “Sustainable Energy Technology Reference Information System (SETRIS),” Joint Research Centre European, 2004. www.jrc.es
[6] J. Anta “El Mix de Generación Eléctrica a Future,” 2010. www.energiaysociedad.es
[7] L. Neij, “Use of Experience Curves to Analyse the Pros-pects for Diffusion and Adoption of Renewable Energy Technology,” Energy Policy, Vol. 25, No. 13, 1997, pp. 1099-1107.doi:10.1016/S0301-4215(97)00135-3