1
Performance improvement of a direct carbon solid oxide fuel cell through
1integrating an Otto heat engine
2Haoran Xu1, 2, 4, Bin Chen2, Peng Tan2, Houcheng Zhang1, 2,*, Jinliang Yuan3,
3
John T.S. Irvine4, Meng Ni2,*
4
1 Department of Microelectronic Science and Engineering, Ningbo University, Ningbo 315211,
5
China 6
2 Building Energy Research Group, Department of Building and Real Estate, The Hong Kong
7
Polytechnic University, Hung Hom, Kowloon, Hong Kong, China 8
3 Faculty of Maritime and Transportation, Ningbo University, Ningbo 315211, China
9
4 School of Chemistry, University of St Andrews, St Andrews, Fife, KY16 9ST, UK
10 11
Abstract: A novel system consisting of an external heat source, a direct carbon solid oxide fuel 12
cell (DC-SOFC), a regenerator and an air standard Otto cycle engine is proposed to improve 13
the performance of the DC-SOFC. Considering the electrochemical/chemical reactions, 14
ionic/electronic charge transport, mass/momentum transport and heat transfer, a 2D tubular 15
DC-SOFC model shows that the overall heat released in the cell can be smaller than, equal to 16
or larger than the heat required by the internal Boudouard reaction. Three different operating 17
modes of the proposed system are identified, and accordingly, analytical expressions for the 18
equivalent power output and efficiency of the proposed system are derived under different 19
operating conditions. The modeling results show that the Otto heat engine can effectively 20
recover the waste heat from the DC-SOFC for additional power production especially at large 21
operating current density. Comprehensive parametric studies are conducted to investigate the 22
effects of the different operating conditions of DC-SOFC on its performance and heat 23
generation. The effects of compression ratio, internal irreversibility factor and power 24
dissipation of the Otto heat engine on the system performance improvement are also studied. 25
26
2 Performance improvement; Parametric study 28
29
*Corresponding authors.
30
3
1. Introduction
32
The increasing global attention on energy crisis drives worldwide research interest in clean 33
and high efficiency energy conversion devices, such as solid oxide fuel cells (SOFCs). SOFCs 34
are all solid-state devices working at a high temperature (e.g. 800oC). A typical SOFC has a
35
sandwiched structure with a dense electrolyte between a porous anode and a porous cathode 36
[1-3]. Fuels (e.g. H2) and oxidants (e.g. O2) are supplied to the anode and cathode, respectively.
37
Through electrochemical reactions, chemical energy in fuels and oxidants can be converted 38
into electrical power directly with a high efficiency. As fuels and oxidants are separated by the 39
dense electrolyte, the post-process of emission gases is relatively easy. 40
Apart from gas fuels like H2 and CO, the utilization of solid carbons in SOFCs has received
41
rising attention as these widely spreaded solid fuels have high volumetric energy density, which 42
can easily be obtained at a low cost. There are two main methods for direct solid carbon 43
utilization in the SOFCs. One is electrochemical oxidation of solid carbon that is in direct 44
contact with the electrode catalyst (usually called as direct carbon fuel cell, DCFC) [1, 2], 45
aiming for a high thermodynamic efficiency. However, this method yields a low power density 46
due to difficult transport of solid carbon and poor contact between the carbon particles and the 47
electrochemical reaction sites (triple phase boundaries: TPBs). The other method is solid 48
carbon indirect utilization through an agent (usually called as direct-carbon solid oxide fuel 49
cell, DC-SOFC), which converts solid carbon into gas fuel such as CO for the electrochemical 50
reaction at the TPBs [3, 4]. Compared with the first method, the second method provides a 51
much higher power density due to easy gas transport and good contact between gas fuel and 52
the TPBs . With verifications of its mechanism [5, 6], catalysts are developed to further improve 53
the performance of DC-SOFCs [7-10]. Besides, the concept of CO and electrical power co-54
generation is proposed and analyzed. The results suggest that a much higher exergy efficiency 55
can be achieved by the DC-SOFC than DCFC [11]. Different agents have also been compared 56
to explore the application of DC-SOFC[12]. It is found that DC-SOFC with H2O as
4
gasification agent for H2 and CO production could achieve higher performance than that with
58
CO2 agent due to fast gasification kinetics using H2O agent and low activation loss associated
59
with H2 electrochemical oxidation. To further understand the detailed chemical/physical
60
process in the DC-SOFCs, mathematical models are developed [13-16]. Our recent 61
mathematical model analyses [17] prove the existence of heat balance in DC-SOFC when it 62
operates at a relative low current density. When the DC-SOFC operates at a high current density 63
to provide a large power density, the heat generated from the irreversible electrochemical losses 64
and enthalpy change exceeds the heat demand by Boudouard reaction. Therefore, the efficiency 65
of DC-SOFCs can be further improved at a wide range of operating current density by utilizing 66
the waste heat [18]. 67
Various thermodynamic cycles including Carnot cycle[19], Stirling cycle[20], Ericsson 68
cycle[21], Brayton cycle[22], Rankine cycle[23], Braysson cycle[24] and Kalina cycle[25] 69
have been used for the conversion of heat into power. Compared with these cycles, Otto cycle 70
has interesting perspectives as the rapid combustion process takes place at a constant volume, 71
which indicates an excellent potential to integrate with other systems. By applying the air-72
standard analysis on Otto cycle, a number of modeling works have been conducted on air-73
standard Otto cycle heat engines [26-29] to illustrate the thermodynamic aspects of engine 74
performance. Gumus et al.[30] compared the performance of a reversible Otto cycle based on 75
its maximum power, maximum power density and maximum efficient power, where they 76
conclude that the design parameters at maximum efficient power conditions lead to more 77
efficient engines than that at the maximum power condition. Besides, the maximum efficient 78
power criterion may have a significant power advantage compared with maximum power 79
density criterion. By considering multiple irreversible losses, Zhao et al. [31, 32] evaluated the 80
performance of an irreversible Otto heat engine and determined the optimum criteria. Chen et 81
al. [33] further evaluated the performance of the air-standard Otto cycle with different specific 82
heats of working fluid [34, 35] by using different objective functions and heat transfer laws. 83
Apart from aforementioned works focusing on Otto heat engine itself, there is another work 84
5
for power generation. Obviously, it is a feasible method for the air-standard Otto cycle heat 86
engine to harvest the waste heat from DC-SOFC for performance improvement. An up-to-date 87
literature survey shows that there is no work reported on this subject. 88
In this work, a numerical model is developed to analyze the performance improvement of 89
DC-SOFC by combining it with an air-standard Otto cycle heat engine. Based on the numerical 90
analysis, three system operation modes are specified under different operating conditions. 91
Besides, the performance of the proposed system is evaluated based on the output power and 92
efficiency expressions. The advantages of the system are also demonstrated through numerical 93
calculations. Finally, the effects of several design parameters and operating conditions on the 94
performance of the system are discussed. 95
2. System description
96
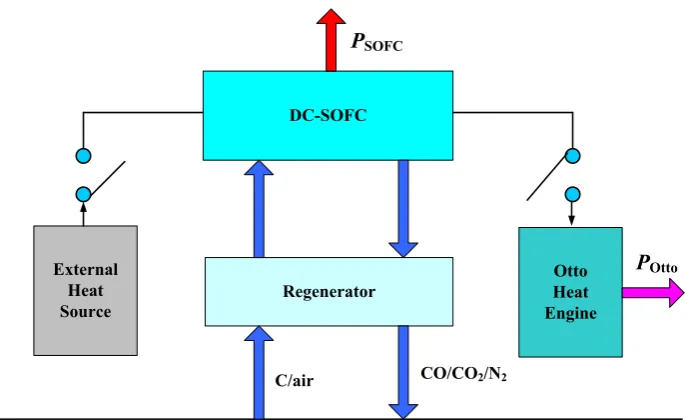
As shown in Fig. 1 (a), the proposed system mainly consists of a DC-SOFC, an external 97
heat source, an air standard Otto cycle heat engine and a regenerator. The DC-SOFC generates 98
electrical power 𝑃SOFC (W) by consuming solid carbon. To ensure the normal operation of the
99
DC-SOFC, certain amount of heat 𝑄 (J S-1) should be provided to DC-SOFC at low operating
100
current density (DC-SOFC in the endothermic mode), and the corresponding heat and mass 101
transfer are shown in Fig. 1 (b). Otherwise, the air standard Otto cycle heat engine should be 102
connected to utilize the waste heat from the DC-SOFC for additional power (𝑃Otto) production,
103
and the corresponding heat and mass transfer are shown in Fig. 1 (c). It should be noted that 104
the CO reformation process is inside the anode of the DC-SOFC, and the excess heat generated 105
in the SOFC component is carried out by the outlet products to power the Otto engine for 106
additional power generation. In calculation, partial differential equations for CO reformation 107
and SOFC component are coupled in COMSOL MULTIPHYSICS®. The generated heat (an
108
output variable from DC-SOFC) is then an input variable in the calculation of Otto engine. The 109
regenerator in the system preheats the inlet solid carbon and gas by outlet high-temperature 110
6
For simplification, the following assumptions are adopted [15] 112
Electrochemical reactions spatially take place at triple phase boundaries (TPBs), 113
which are assumed to be uniformly distributed in the porous electrodes. Electronic 114
and ionic conduction phases in the porous electrodes are continuous and 115
homogeneous; 116
Ionic and electronic charge transport processes take place in the PEN (Positive 117
Electrode-Electrolyte-Negative electrode assembly), and the charge transfer 118
reaction can take place at TPB sites throughout the porous electrode; 119
All gases (CO, CO2, O2 and N2) involved in the DC-SOFC are ideal gases and the
120
gas flow is incompressible; 121
Internal relaxation times in the adiabatic processes are negligible; 122
Heat transfer irreversibility between the DC-SOFC and the Otto heat engine is 123
neglected; 124
Irreversibility in the two adiabatic processes is neglected; 125
Working substance air of Otto heat engine is assumed to behave as an ideal gas. 126
127
2.1 DC-SOFC
128
In DC-SOFCs, solid carbon in anode chamber is gasified by CO2 to generate CO molecules,
129
which then diffuse into the porous anode and react with O2- ions at the TPB sites. The produced
130
CO2 molecules in electrochemical reactions subsequently diffuse back to the anode chamber
131
and continue the Boudouard reaction for CO generation. These processes repeat between the 132
anode chamber and the porous anode for power generation as long as there is enough solid 133
carbon in the anode chamber. 134
A previously developed 2D numerical model is adopted to describe the electrochemical 135
/chemical reactions, ionic/electronic charge transport, mass/momentum transport and heat 136
transfer in the tubular DC-SOFC. 137
2.1.1 Chemical reaction model 138
7 CO2,i.e.,
140
C + CO2 = 2CO. (1)
141
Its reaction rate can be calculated as [37] 142
𝑅rb = 𝑘rbexp(−𝐸rb/𝑅𝑇)𝑐CO2. (2) 143
2.1.2 Electrochemical reaction model 144
At anode TPB sites, CO molecules electrochemically react with O2- ions and release
145
electrons, i.e., 146
CO + O2−→ CO
2+ 2e−. (3)
147
The above mentioned O2- ions are transported from cathode TPB sites, where O
2 molecules
148
are reduced into O2-, i.e.,
149
O2+ 4e− → 2O2−. (4)
150
The equilibrium potential (𝐸CO) for above reactions can be determined by [38] 151
𝐸CO = 𝐸CO0 +𝑅𝑇 2𝐹ln [
𝑃CO𝐿 (𝑃O2𝐿 )1⁄2
𝑃CO2𝐿 ], (5)
152
where R is the universal gas constant and F is Faraday constant. T is operating temperature and 153
𝑃𝐿 is local gas partial pressure. 𝐸CO0 is the standard potential (V), which can be calculated by
154
𝐸CO0 = 1.46713 − 0.0004527𝑇. (6)
155
For the calculation of the operating potential (E), both activation overpotential (𝜂act) and
156
ohmic overpotential (𝜂ohmic) should be considered, i.e.,
157
𝐸 = 𝐸CO0 − 𝜂
act− 𝜂ohmic . (7)
158
The relationship between current density and above two overpotential losses are described 159
by Butler-Volmer equation (Eq. (8)) and ohm law (Eq. (9)), respectively[39], i.e., 160
𝑖 = 𝑖0{exp (𝛼𝑛𝐹𝜂𝑅𝑇act) − exp (−(1−𝛼)𝑛𝐹𝜂𝑅𝑇 act)}, (8)
161
8
𝑖 = −𝜎eff𝛻(𝜙), (9)
163
where 𝑖 is operating current density, 𝑖0 is exchange current density,𝛼 is the electron transfer
164
coefficient and 𝑛 is the number of transferred electrons per electrochemical reaction. 𝜎eff and
165
𝜙 are effective conductivity (S m-1) and electric potential (V), respectively.
166
2.1.3 Mass and momentum transport model 167
Mass and momentum transport are, respectively, calculated by the extended Fick’s model (Eq. 168
(10)) and Navier-Stokes equation (Eq. (11)) [15], i.e., 169
𝑁𝑚 = −𝑅𝑇1 (𝐵0𝑦𝑚𝑃
𝜇 ∂P
∂z− 𝐷𝑚
eff ∂(𝑦𝑚P)
∂z )(𝑚 = 1, 2 … , 𝑙), (10) 170
and 171
𝜌𝜕𝑢𝜕𝑡+ 𝜌𝑢∇𝑢 = −∇𝑝 + ∇[𝜇 (∇𝑢 + (∇𝑢)𝑇) −2
3𝜇∇𝑢] − 𝜀𝜇𝑢
𝑘 , (11)
172
where 𝐵0 is the permeability (m2) of the porous electrodes, 𝑦
𝑚 is the mole fraction of
173
component m,𝜇 is the gas viscosity (N m-1 s-1), 𝐷
𝑚eff is the overall effective diffusion
174
coefficient (m2 s-1) of component m, 𝜌 (kg m-3) is the gas density and u (m s-1) is the velocity
175
vector. 176
2.1.4 Heat transfer model 177
The heat transfer process is described by the general heat balance equation [17] 178
𝜌𝐶𝑝𝑢 ∙ ∇𝑇 + ∇ ∙ (−𝜆eff∇𝑇) = 𝑄, (12)
179
where 𝐶𝑝 is the heat capacity, u is the fluid velocity field, 𝜆eff is the effective heat 180
conductivity and Q is the heat source term. 181
The above model is validated by fitting simulation results (I-V characteristics) with 182
9
described by partial differential equations, which are handled by nonlinear finite elements 184
method using commercial software COMSOL MULTIPHYSICS®.
185
The power output of the DC-SOFC is determined by 186
𝑃SOFC = 𝑉 × 𝐼, (13)
187
where 𝑉 (V) and 𝐼 (A) are output voltage and current, respectively. 188
Considering the irreversible polarization losses and enthalpy changes in DC-SOFC, its 189
electrical efficiency 190
𝜂SOFC = 𝑃SOFC
𝑃SOFC+𝑄 (14)
191
can be defined, where 𝑄 (J s-1) is the overall heat released from the DC-SOFC, which is
192
defined as positive in this paper. The heat 𝑄 can be further expressed as 193
𝑄 = 𝑄e− 𝑄c, (15)
194
where 𝑄c (J s-1) is the absorbed heat by the Boudouard reaction and 𝑄
e (J s-1) includes heat
195
released from the electrochemical reaction and overpotential losses. Thus, 𝑄e can be 196
calculated as 197
𝑄e= −𝑇∆𝑆 ×2𝐹𝐼 + (𝐸 − 𝑉)𝐼. (16)
198
When 𝑄e = 𝑄c, i.e., 𝑄 = 0, the thermal neutral current 199
𝐼tn = 𝑄c
−𝑇∆𝑆 2𝐹⁄ +𝐸−𝑉tn (17)
200
can be obtained, where 𝑉tn (V) is the thermal neutral voltage corresponding to 𝐼tn.
201
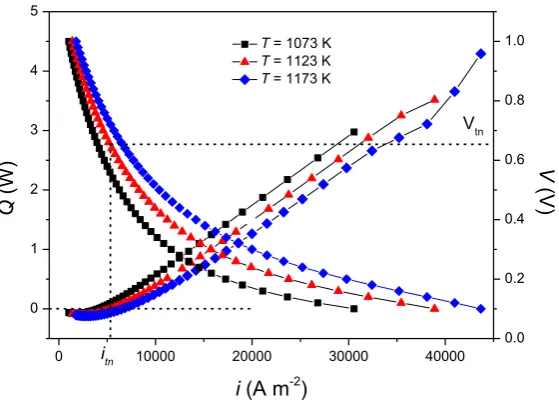
Based on the above governing equations and parameters in Table 1, the relationship 202
between 𝑄 and operating current density 𝑖 (𝑖 = 𝐼/𝐴, A m-2) are obtained as shown in Fig. 2.
203
It is seen that 𝑄 increases from negative to positive values with increasing current density. 204
When 𝑖 < 𝑖𝑡𝑛, i.e., 𝑄 < 0, the heat produced due to the polarization losses and enthalpy 205
change of the electrochemical reaction is less than the heat required for the Boudouard reaction. 206
Certain amount of heat |𝑄| should be supplied from the external heat source to the DC-SOFC 207
to maintain its operating temperature. In this case, the external heat source in Fig. 1(a) should 208
be switched on while the air standard Otto heat engine is off. When 𝑖 = 𝑖𝑡𝑛, i.e., 𝑄 = 0, the 209
10
means the DC-SOFC can work in a thermally self-sustained manner. When 𝑖 > 𝑖𝑡𝑛, i.e., 𝑄 >
211
0, the heat generated exceeds the required heat for the Boudouard reaction. The air standard 212
Otto heat engine should be switched on to utilize the waste heat from DC-SOFC for extra 213
electrical power (𝑃Otto) generation. As also shown in Fig. 2, a larger 𝑖𝑡𝑛 is needed at a higher
214
operating temperature to generate more heat for the endothermic Boudouard reaction. Less 215
netheat is generated for a given current density at a higher operating temperature, as the faster 216
Boudouard reaction at a higher temperature consumes more heat from DC-SOFC. 217
218
2.2 Air standard Otto cycle heat engine
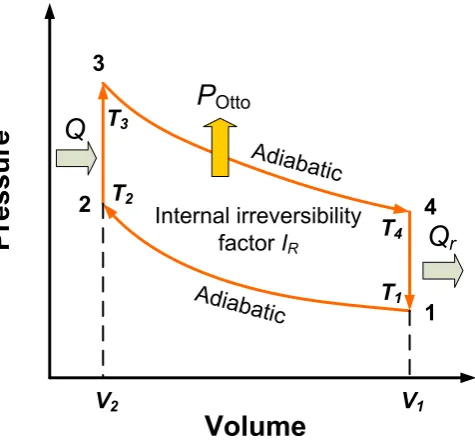
219
The air standard Otto cycle is composed of two adiabatic processes (1→2 and 3→4) and 220
two isochoric processes (2→3 and 4→1), as shown in Fig. 3.𝑇1, 𝑇2, 𝑇3 and 𝑇4 are 221
temperatures of the working substance at the state points 1, 2, 3 and 4. The heat flow from the 222
DC-SOFC, 𝑄, is provided to the Otto cycle heat engine at the volume 𝑉2. After producing
223
power 𝑃Otto, the remaining heat 𝑄r is released at the volume 𝑉2. Considering instantaneous 224
adiabats, the period of the Otto cycle [40] 225
1 2 1 3 2 2 4 1
t tV tV K T T K T T (18)226
can be calculated, where t1V and t2V are, respectively, the heating and cooling times; K1 227
and K2are temperature-independent constants (s K-1).
228
From the first law of thermodynamics, the reversible work 229
1 2
Otto,r V 3 2 V 4 1
W C T T C T T (19)
230
done by the Otto cycle heat engine can be calculated, where CV1 and CV2 are the heat
231
capacities of gases in the compression and power strokes, respectively. 232
Thus, the reversible power is shown as 233
1 3 2 2 4 1
Otto, Otto,
1 3 2 2 4 1
V V r r tC T T C T T
W P
K T T K T T . (20)
234
11 further rewritten as [40, 41]
236 1 2 1 Otto, 1 1 2 V V r
C C r
P
K K r
, (21)
237
where , and are, respectively, constant-pressure heat capacity (J K-1) and
238
constant-volume heat capacity (J K-1), and
1 2
r V V is the compression ratio. 239
Considering a dissipation term represented by a friction force proportional to the velocity, 240
the friction force 241 f dx F dt
(22)
242
can be obtained, where is the friction coefficient which takes into account the global losses, 243
is the piston velocity, and x is the piston displacement. Then, the friction-related power 244 loss 245 2 f dx dx P dt dt
(23)
246
can be calculated [41]. 247
The piston mean velocity can be expressed as 248
2 1 2 12 12 1 x r x x t t , (24)
249
where x2 is the piston position at minimum volume and t12 is the time spent in the power 250
stroke. Counted the piston friction-like losses, the power output is reduced from 𝑃Otto,r to
251
1 2 1 2Otto, Otto, 1
1 2
1
V V
P r f
C C r
P P P b r
K K r
, (25)
252 where
2 2 2 12 x b t . 253In addition to the piston friction-like losses, irreversible losses from mass transfer, friction, 254
eddy and other irreversible effects inside the cyclic working fluid should be considered. The 255
total irreversible effects within the working fluid can be characterized by the internal 256
irreversibility factor [40] 257
/
P V
C C
12
1 1 2 2 3 2 12 4 1
ln ln
V V
W R
W V V
C T T C
S I
S C T T C
, (26)
258
where and are entropy changes (J K-1) along the hot isothermal branch and the
259
cold isothermal compression branch. The internal irreversibility factor is in the range of 260
. 261
Considering the finite-time evolution of the cycle’s compression and power strokes, piston 262
friction-like losses and internal irreversibility of working fluid, the efficiency and power output 263
of the air standard Otto heat engine are, respectively, given by [40-42] 264
2
2
1 1
Otto 1 2
1 1
V
b r
r K K r
C
, (27)
265 and 266
2 2 1 1Otto 1 2
1 1
V
b r
P Q r K K r
C
, (28)
267
where the relevant parameters for the air standard Otto cycle are summarized in Table 2. 268
269
2.3 The regenerator
270
The regenerator works as a heat exchanger continuously preheating the inlet solid carbon 271
and air by the high-temperature outlet gases. The products are cooled down to the 272
environmental temperature with the solid carbon and oxygen being heated to the operating 273
temperature of the DC-SOFC. According to the thermodynamic parameters given in Ref. [18], 274
one can prove that 275
2
CO C 1O 0
Q Q Q
, (29)
276
and 277
2 2
CO C 2O 0
Q Q Q
, (30)
278 where 0 CO CO T T Q m C d
,0
C C
T
T Q m C d
,2 2
0
O O
1 0.5 T
T Q m C d
, 2 2 0 O O 2 T T Q m C d
, 279 2 2 0 CO CO T TQ m C d
, is the molar consumption rate of solid carbon, T0 is the ambient280
1
W
S
SW2
0IR 1
13
temperature (K), is the isobaric molar heat capacities (J mol-1 K-1) for species (j= solid
281
carbon, CO, O2 or CO2). As only CO and CO2 are present in the anode outlet gas, we can
282
conclude that the heat contained in the products is always enough to preheat the reactants to 283
attain the operating temperature of the DC-SOFC regardless of its molar fraction of CO and 284
CO2 (the inlet N2 in air is supposed to be preheated by the outlet N2). Since some
high-285
effectiveness regenerators have already been reported [43], it is appropriate to assume that the 286
regenerator in Fig. 1 (a) performs perfect regeneration. 287
288
2.4 The performance of the proposed system
289
As the waste heat from DC-SOFC is used to preheat the activated carbon and air at the inlet 290
of the cell, the heat loss from the DC-SOFC system to the environment is negligible against 291
the electrical power (𝑃SOFC). Adding the contribution of the air standard Otto cycle heat engine, 292
the equivalent power output ( ) and equivalent efficiency ( ) of the proposed system can be, 293
respectively, expressed as 294
SOFC tn
SOFC Otto tn
P i i
P
P P i i
, (31)
295 and 296
SOFC tn SOFC SOFC Otto tn SOFC P i i P Q P P i i P Q . (32)
297
3. Results and discussion
298
Based on the mathematical models above which have been well validated by the previous 299
studies[15] and relevant parameters given in Table 1 and Table 2, the performance 300
characteristics of the proposed system can be analyzed. The parameters are taken as default 301
ones unless they are specifically mentioned. 302
j
C j
14
3.1 Performance characteristics of air standard Otto heat engine
303
The basic performance characteristics of the air standard Otto heat engine are shown in Fig. 304
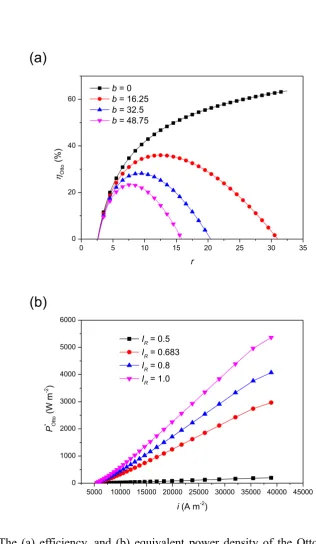
4. As can be found in Fig. 4 (a), the efficiency (𝜂Otto) increases with increasing compression 305
ratio ( ) at different power dissipation ( ) values at the beginning. After reaching the peak 306
efficiency values, 𝜂Otto decreases with a further increase in compression value. Besides, a
307
higher efficiency and larger effective interval compression ratio can be achieved at smaller 308
power dissipation value. When power dissipation is decreased to zero, the friction losses in the 309
Otto heat engine can be negligible. In this situation, Eqs. (27) and (28) can be, respectively, 310
reduced into 311
1 Otto 1 r IR
, (33)312
and 313
1
Otto 1 R
P Q r I . (34)
314
As can be found in Fig. 4(b), the equivalent power density of the air standard Otto heat 315
engine POtto* increases with the increasing operating current density of the DC-SOFC and 316
the increasing internal irreversibility factor . The effect of the internal irreversibility factor 317
on its power output becomes more significant at larger operating current density as more heat 318
is generated from DC-SOFC. With the internal irreversibility factor reaching 1, the Otto heat 319
engine achieves its upper limit power density. In this situation, Eqs. (27) and (28) can be, 320
respectively, reduced into 321
2
2
1 1
Otto 1 2
1 1
V
b r
r K K r
C
, (35)
322 and 323
2 2 1 1Otto 1 2
1 1
V
b r
P Q r K K r
C
. (36)
324
325
3.2 Power density improvement of the proposed system
326
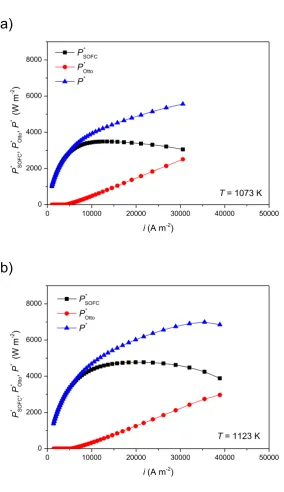
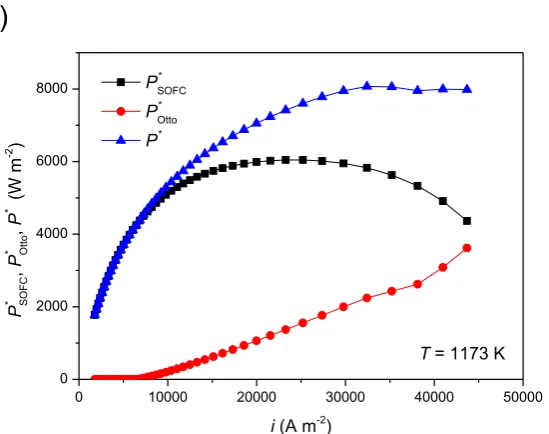
The equivalent power densities of the DC-SOFC, Otto heat engine and proposed system 327
r b
i
R
15
are compared at different operating temperatures as shown in Fig. 5, where PSOFC* PSOFC A 328
and are the power densities for the DC-SOFC and the proposed system, 329
respectively. When i i tn, the curves of and PSOFC* ~i are overlapped as no waste 330
heat is transferred to Otto heat engine for extra power production. In the range of i i tn, POtto*
331
keeps growing with larger operating current density as more heat is provided from the DC-332
SOFC. While for the DC-SOFC, its power density PSOFC* first increases and then decreases 333
with the increasing . As a result, the power density is significantly improved in the proposed 334
system and increases to attain a maximum value with increasing . 335
The elevated operating temperature improves the performance of the DC-SOFC by 336
promoting its chemical/electrochemical reactivity and ionic conductivity. However, the power 337
density of the Otto heat engine at the same operating current density decreases with increasing 338
operating temperature due to less waste heat supply, as shown by Fig. 2. As PSOFC* is more 339
sensitive to the operating temperature than POtto* , a higher operating temperature is preferred 340
for the proposed system to obtain a higher output power density. For example, when the DC-341
SOFC works at a current density of 30000 A m-2, the equivalent power density of the proposed
342
system approximately increases from 5550 W m-2 at 1073 K to 7950 W m-2 at 1173 K, which
343
are about 79.6% and 33.3% larger than that of the stand-alone DC-SOFC, respectively. 344
345
3.3 Efficiency characteristics of proposed system
346
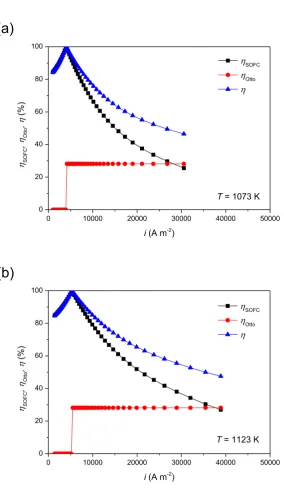
Apart from power density, the equivalent efficiencies of the DC-SOFC, Otto heat engine 347
and proposed system under different operating temperature are also compared as shown in Fig. 348
6. Similarly, the ~ i and SOFC ~i curves are overlapped in the region of i i tn and the 349
proposed system has the largest efficiency when i i tn. The efficiency of the DC-SOFC is 350
quite high at small operating current density, where it reaches a peak efficiency of 100% at itn
351
as DC-SOFC is thermally self-sustained. With a further increase in operating current density, 352
* /
P P A
*~
P i
i
*
P i
16
SOFC
decreases to less than Otto (which does not vary with the operating temperature). When 353
the DC-SOFC works at a current density of 30000 A m-2, the equivalent efficiency of the
354
proposed system increases from 46.8% at 1073 K to 60.8% at 1173 K mainly due to the 355
significant efficiency improvement of the DC-SOFC, whose efficiency increases from 26.4% 356
at 1073 K to 45.4% at 1173 K. A higher operating temperature is thus more favored to obtain 357
a higher efficiency of the proposed system. 358
359
3.4 Effect of distance between carbon layer and anode electrode
360
In DC-SOFCs, the distance between carbon layer and anode (𝐷𝑐𝑒) will increase over time 361
due to the consumption of solid carbon, resulting in the change of z in Eq. (10). As a result, the 362
gas transportation between carbon layer and anode significantly affects the power output and 363
heat generation in the proposed system. As shown in Fig. 7, as the distance between carbon 364
layer and anode is decreased from 559 μm to 59 μm, a significant output power density 365
improvement of the proposed system is found. The peak power density of the proposed system 366
increases from 5030 W m-2 at 559μm to 6990 W m-2 at 59 μm. As analyzed in our previous
367
papers [15, 17], a small distance between carbon layer and anode helps to maintain a high fuel 368
concentration in anode, which brings in a high output power density. Meanwhile, more heat 369
can be provided from the DC-SOFC at higher operating current density, allowing more power 370
to be generated through Otto heat engine. As a result, higher power density and efficiency of 371
the proposed system can be obtained at a smaller distance, and this effect becomes more 372
pronounced at a larger current density. 373
374
3.5 Effect of compression ratio
375
The effect of compression ratio ( ) on the performance of the proposed system appears 376
only in the region of i i tn, as shown in Fig. 8. For a given current density, it is observed that 377
there exists peak values for the power density and efficiency of the proposed system with the 378
change of compression ratio, indicating the existence of an optimum compression ratio. Based 379
17
on the parameters given in Table 1 and Table 2, the optimum value for the compression ratio is 380
found to be 9.26. Moreover, the optimum value for the compression ratio is closely related to 381
the friction-like coefficient. The optimum value of compression ratio ( ) under different 382
dissipation power ( ) are listed in Table 3 by using the extremum condition Otto r 0, 383
from which a smaller can be found at a larger . It can be also found from Fig. 8 that the 384
effect of compression ratio on the performance of the proposed system becomes more 385
significant as the operating current density increases. 386
387
3.6 Effect of internal irreversibility factor and dissipation power
388
The effects of internal irreversibility factor ( ) and dissipation power ( ) on the 389
performance of the proposed system are shown in Fig. 9, where the involved values of 390
compression ratio are assigned from Table 3 to maximize the efficieny of the Otto heat engine. 391
In the region of i i tn, significant effects of irreversibility factor and dissipation power can be 392
found at large operating current density as more heat is provided from the DC-SOFC to the 393
Otto heat engine. The power density and efficiency of the proposed system both increase with 394
increasing or decreasing . When both the internal irreversible losses and the friction-like 395
losses are negligible, the power density and efficiency of the proposed system can be drawn as 396
the black square lines in Fig. 9. In this situation, Eqs. (27) and (28) can be reduced into 397
1 Otto 1 r
, (37)398
and 399
1
Otto 1
P Q r . (38)
400 401
4. Conclusions
402
The previously developed 2D tubular DC-SOFC model shows that the overall heat 403
opt
r
b
opt
r b
R
I b
R
18
generated in the cell could be smaller than, equal to or higher than the heat demand by the 404
internal Boudouard reaction. A novel hybrid system consists of a DC-SOFC, an external heat 405
source, a regenerator and an Otto heat engine is proposed to improve the performance of the 406
DC-SOFC. Based on the thermal characteristics of the DC-SOFC, three operation modes are 407
presented. The analytical expressions for the proposed system under different operating 408
conditions are derived to evaluate its performance. The results show that the proposed system 409
is technically feasible and effective, and the equivalent power density of the proposed system 410
could be increased by up to 80% compared to the stand-alone DC-SOFC. Comprehensive 411
parametric studies show that there exists an optimum value for the compression ratio to 412
maximize the efficiency of the Otto heat engine, and increasing the operating temperature, 413
operating current density and internal irreversibility factor will increase the overall power 414
density and efficiency of the proposed system. Furthermore, decreasing dissipation power and 415
the distance between carbon layer and anode electrode are also benefit to improve the 416
equivalent power density and efficiency of the DC-SOFC based hybrid system. 417
418
Acknowledgement 419
This research is supported by the Natural Science Foundation of Zhejiang Province (Grant 420
No. LQ14E060001), National Natural Science Foundation of China (Grant No. 51406091), a 421
grant (PolyU 152127/14E) from Research Grant Council, University Grants Committee, Hong 422
Kong SAR, a grant from Environment and Conservation Fund (ECF 54/2015), Hong Kong 423
SAR, and the K. C. Wong Magna Fund in Ningbo University. 424
19
Nomenclature
426
Abbreviation
427
CHP Combined heat and power
DC-SOFC Direct-carbon solid oxide fuel cell LSM Strontium-doped lanthanum manganite
Otto Otto heat engine
SCCM Standard cubic centime per minute SOFC Solid oxide fuel cell
TPB Triple phase boundary YSZ Yttrium stabilized zirconium 428
Roman
429
𝑏 Power dissipation due to friction, W 𝐵0 Permeability coefficient, m2
𝑐CO2 Molar concentration of carbon dioxide, mol·m-3 is constant-pressure heat capacity, J K-1
is constant-volume heat capacity, J K-1
Heat capacity of the gases in the compression stroke, J·K-1
Heat capacity of the gases in the power strokes, J·K-1
𝐷𝑐𝑒 Distance between carbon layer and anode, μm 𝐷meff Effective diffusivity of species m , m2·s-1
𝐸act Activation energy, J·mol-1
𝐸CO Equilibrium potential for carbon monoxide oxidization, V
𝐸CO0 Standard equilibrium potential for carbon monoxide oxidization, V P
C CP
V
C CV
1
V
C
2
V
20 𝐸eq Equilibrium Nernst potential, V 𝐹 Faraday constant, 96485 C·mol-1
f
F Friction force, N
𝑖𝑜 Exchange current density, A·m-2
𝐼 Electrical current, A
𝐼𝑅 Internal irreversibility factor
; Constant temperature rate in Eq. (18), (s K-1)
n Number of electrons transferred per electrochemical reaction 𝑁𝑖 Flux of mass transport, kg·m-3·s-1
𝑝 (partial) Pressure, Pa
𝑃 Power output, W
f
P Friction-related power loss, W
Otto,r
P Reversible power of the Otto heat engine, W
r Compression ratio
𝑅 Gas constant, 8.314 J·mol-1·K-1
𝑅𝑐𝑒 Reaction rate of Boudouard reaction, mol·m-3·s-1
Entropy change along the hot isothermal branch, J·K-1
Entropy change along the cold isothermal compression branch, J·K-1
Time spent in the power stroke, s
T Temperature, K
T1~4 Temperatures of the working substance at the state points 1, 2, 3 and 4
𝑢 Velocity field, m3·s-1
V Volume fraction
Working substance volume along the constant-volume cooling branch, m3
1 K K2
1
W
S
2
W
S
12 t
21
Working substance volumes along the constant-volume heating branch, m3
Otto,r
W Reversible work of the Otto heat engine, W
Piston position at minimum volume, m 𝑦𝑘 Molar fraction of component k
Greek letters
𝛼 Charge transfer coefficient
𝛽H2 Electrochemical kinetics parameter for H2 Ratio of specific heats
𝜀 Porosity
𝜂 Efficiency
𝜂act Activation polarization, V
𝜂ohmic Ohmic polarization, V
𝜅 Permeability, m2
𝜆 Thermal conductivity, W·m-1K-1
𝜇 Dynamic viscosity of fluid, Pa·s Friction coefficient, J·s·m-2
𝜌 Fluid density, kg·m-3
σ Conductivity, S/m
𝜏 Tortuosity
t Period of the Otto cycle, s∅ Potential, V
Subscripts
an Anode
ca Cathode
2 V
2 x
22
CO Carbon monoxide
CO2 Carbon dioxide
H2 Hydrogen
l Ionic phase
O2 Oxygen
r Reversible
s Electronic phase
Superscripts
0 Parameter at equilibrium conditions
eff Effective
L Local
23
References
431
[1] Nurnberger S, Bu, Desclaux P, Franke B, Rzepka M, Stimming U. Direct carbon
432
conversion in a SOFC-system with a non-porous anode. Energy & Environmental
433
Science. 2010;3:150-3.
434
[2] Li C, Shi Y, Cai N. Mechanism for carbon direct electrochemical reactions in a solid
435
oxide electrolyte direct carbon fuel cell. Journal of Power Sources. 2011;196:754-63.
436
[3] Bai Y, Liu Y, Tang Y, Xie Y, Liu J. Direct carbon solid oxide Fuel Cell—a potential
437
high performance battery. International Journal of Hydrogen Energy.
2011;36:9189-438
94.
439
[4] Yang B, Ran R, Zhong Y, Su C, Tadé MO, Shao Z. A carbon-air battery for high
440
power generation. Angewandte Chemie - International Edition. 2015;54:3722-5.
441
[5] Xie Y, Tang Y, Liu J. A verification of the reaction mechanism of direct carbon solid
442
oxide fuel cells. Journal of Solid State Electrochemistry. 2012;17:121-7.
443
[6] Cai W, Liu J, Xie Y, Xiao J, Liu M. An investigation on the kinetics of direct carbon
444
solid oxide fuel cells. Journal of Solid State Electrochemistry. 2016;20:2207-16.
445
[7] Wu Y, Su C, Zhang C, Ran R, Shao Z. A new carbon fuel cell with high power
446
output by integrating with in situ catalytic reverse Boudouard reaction.
447
Electrochemistry Communications. 2009;11:1265-8.
448
[8] Li C, Shi Y, Cai N. Performance improvement of direct carbon fuel cell by
449
introducing catalytic gasification process. Journal of Power Sources.
24
6.
451
[9] Tang Y, Liu J. Effect of anode and Boudouard reaction catalysts on the
452
performance of direct carbon solid oxide fuel cells. International Journal of Hydrogen
453
Energy. 2010;35:11188-93.
454
[10] Cantero-Tubilla B, Xu C, Zondlo JW, Sabolsky K, Sabolsky EM. Investigation of
455
anode configurations and fuel mixtures on the performance of direct carbon fuel cells
456
(DCFCs). Journal of Power Sources. 2013;238:227-35.
457
[11] Xie Y, Cai W, Xiao J, Tang Y, Liu J, Liu M. Electrochemical gas-electricity
458
cogeneration through direct carbon solid oxide fuel cells. Journal of Power Sources.
459
2015;277:1-8.
460
[12] Xu H, Chen B, Zhang H, Sun Q, Yang G, Ni M. Modeling of direct carbon solid
461
oxide fuel cells with H2O and CO2 as gasification agents. International Journal of
462
Hydrogen Energy. 2017;42:15641-51.
463
[13] Alexander BR, Mitchell RE, Gür TM. Modeling of experimental results for carbon
464
utilization in a carbon fuel cell. Journal of Power Sources. 2013;228:132-40.
465
[14] Johnson DU, Mitchell RE, Gür TM. Modeling Power Production in a Tubular
466
Carbon Fuel Cell. ECS Transactions. 2014;61:235-43.
467
[15] Xu H, Chen B, Liu J, Ni M. Modeling of direct carbon solid oxide fuel cell for CO
468
and electricity cogeneration. Applied Energy. 2016;178:353-62.
469
[16] Xu H, Chen B, Zhang H, Sun Q, Yang G, Ni M. Modeling of direct carbon solid
470
oxide fuel cells with H2O and CO2 as gasification agents. International Journal of
25
Hydrogen Energy. 2017.
472
[17] Xu H, Chen B, Zhang H, Kong W, Liang B, Ni M. The thermal effect in direct
473
carbon solid oxide fuel cells. Applied Thermal Engineering. 2017;118:652-62.
474
[18] Xu H, Chen B, Tan P, Zhang H, Yuan J, Liu J, et al. Performance improvement of
475
a direct carbon solid oxide fuel cell system by combining with a Stirling cycle. Energy.
476
2017;140:979-87.
477
[19] Chen L, Zhu X, Sun F, Wu C. Exergy-based ecological optimization of linear
478
phenomenological heat-transfer law irreversible Carnot-engines. Applied Energy.
479
2006;83:573-82.
480
[20] Hosseinpour J, Sadeghi M, Chitsaz A, Ranjbar F, Rosen MA. Exergy assessment
481
and optimization of a cogeneration system based on a solid oxide fuel cell integrated
482
with a Stirling engine. Energy Conversion and Management. 2017;143:448-58.
483
[21] Garcia RF, Carril JC, Gomez JR, Gomez MR. Energy and entropy analysis of
484
closed adiabatic expansion based trilateral cycles. Energy Conversion and
485
Management. 2016;119:49-59.
486
[22] Luu MT, Milani D, McNaughton R, Abbas A. Analysis for flexible operation of
487
supercritical CO2 Brayton cycle integrated with solar thermal systems. Energy.
488
2017;124:752-71.
489
[23] Grelet V, Reiche T, Lemort V, Nadri M, Dufour P. Transient performance
490
evaluation of waste heat recovery rankine cycle based system for heavy duty trucks.
491
Applied Energy. 2016;165:878-92.
26
[24] Açıkkalp E. Performance analysis of irreversible molten carbonate fuel cell –
493
Braysson heat engine with ecological objective approach. Energy Conversion and
494
Management. 2017;132:432-7.
495
[25] Modi A, Kærn MR, Andreasen JG, Haglind F. Thermoeconomic optimization of a
496
Kalina cycle for a central receiver concentrating solar power plant. Energy Conversion
497
and Management. 2016;115:276-87.
498
[26] Lin J-C, Hou S-S. Effects of heat loss as percentage of fuel’s energy, friction and
499
variable specific heats of working fluid on performance of air standard Otto cycle.
500
Energy Conversion and Management. 2008;49:1218-27.
501
[27] Curto-Risso PL, Medina A, Hernández AC. Theoretical and simulated models for
502
an irreversible Otto cycle. Journal of Applied Physics. 2008;104:094911.
503
[28] Xia S, Chen L, Sun F. Maximum cycle work output optimization for generalized
504
radiative law Otto cycle engines. The European Physical Journal Plus. 2016;131:394.
505
[29] Ge Y, Chen L, Sun F. Finite-time thermodynamic modelling and analysis of an
506
irreversible Otto-cycle. Applied Energy. 2008;85:618-24.
507
[30] Gumus M, Atmaca M, Yilmaz T. Efficiency of an Otto engine under alternative
508
power optimizations. International Journal of Energy Research. 2009;33:745-52.
509
[31] Chen J, Zhao Y, He J. Optimization criteria for the important parameters of an
510
irreversible Otto heat-engine. Applied Energy. 2006;83:228-38.
511
[32] Zhao Y, Lin B, Chen J. Optimum Criteria on the Important Parameters of an
512
Irreversible Otto Heat Engine With the Temperature-Dependent Heat Capacities of the
27
Working Fluid. Journal of Energy Resources Technology. 2007;129:348-54.
514
[33] Chen L, Wu C, Sun F, Cao S. Heat transfer effects on the net work output and
515
efficiency characteristics for an air-standard Otto cycle. Energy Conversion and
516
Management. 1998;39:643-8.
517
[34] Ge Y, Chen L, Sun F, Wu C. Thermodynamic simulation of performance of an
518
Otto cycle with heat transfer and variable specific heats of working fluid. International
519
Journal of Thermal Sciences. 2005;44:506-11.
520
[35] Ge Y, Chen L, Sun F, Wu C. The effects of variable specific heats of working fluid
521
on the performance of an irreversible Otto cycle. International Journal of Exergy.
522
2005;2:274-83.
523
[36] Eldighidy SM. Optimum outlet temperature of solar collector for maximum work
524
output for an Otto air-standard cycle with ideal regeneration. Solar Energy.
525
1993;51:175-82.
526
[37] Stempien JP, Liu Q, Ni M, Sun Q, Chan SH. Physical principles for the calculation
527
of equilibrium potential for co-electrolysis of steam and carbon dioxide in a Solid Oxide
528
Electrolyzer Cell (SOEC). Electrochimica Acta. 2014;147:490-7.
529
[38] Xu H, Chen B, Irvine J, Ni M. Modeling of CH4-assisted SOEC for H2O/CO2
co-530
electrolysis. International Journal of Hydrogen Energy. 2016;41:21839-49.
531
[39] Ni M. 2D heat and mass transfer modeling of methane steam reforming for
532
hydrogen production in a compact reformer. Energy Conversion and Management.
533
2013;65:155-63.
28
[40] Angulo-Brown F, Rocha-Martínez JA, Navarrete-González TD. A
non-535
endoreversible Otto cycle model: improving power output and efficiency. Journal of
536
Physics D: Applied Physics. 1996;29:80.
537
[41] Angulo-Brown F, Fernández-Betanzos J, Diaz-Pico CA. Compression ratio of an
538
optimized air standard Otto-cycle model. European Journal of Physics. 1994;15:38.
539
[42] Aragón-González G, Canales-Palma A, León-Galicia A. Maximum irreversible
540
work and efficiency in power cycles. Journal of Physics D: Applied Physics.
541
2000;33:1403.
542
[43] Sadrameli SM. Mathematical models for the simulation of thermal regenerators:
543
A state-of-the-art review. Renewable and Sustainable Energy Reviews.
2016;58:462-544
76.
545
[44] Eguchi K, Setoguchi T, Inoue T, Arai H. Electrical-Properties of Ceria-Based
546
Oxides and Their Application to Solid Oxide Fuel-Cells. Solid State Ionics.
547
1992;52:165-72.
548
[45] Luo Y, Shi Y, Li W, Cai N. Comprehensive modeling of tubular solid oxide
549
electrolysis cell for co-electrolysis of steam and carbon dioxide. Energy.
2014;70:420-550
34.
551
[46] Yaqi L, Yaling H, Weiwei W. Optimization of solar-powered Stirling heat engine
552
with finite-time thermodynamics. Renewable Energy. 2011;36:421-7.
553
[47] Ahmadi MH, Sayyaadi H, Dehghani S, Hosseinzade H. Designing a solar powered
554
Stirling heat engine based on multiple criteria: Maximized thermal efficiency and power.
29
Energy Conversion and Management. 2013;75:282-91.
30 List of Tables
558
Table 1. Model parameters used in DC-SOFC. 559
Table 2. Parameters used in Otto heat engine. 560
Table 3. Optimum value of compression ratio under different power dissipation , the 561
other parameters are as the same in Table 1and Table 2. 562
563
opt
31
Table 1. Model parameters used in DC-SOFC [15, 44, 45]. 564
Parameters Value or expression Unit
Ionic conductivity
𝜎GDC 100
𝑇 × 10
(6.66071−5322.92𝑇 ) S m-1
𝜎YSZ
3.34 × 10⁴𝑒−10300𝑇 S m
-1
Electronic conductivity
𝜎silver 1.59 × 10⁸
(0.0038𝑇 − 0.1134)
S m-1
Porosity
𝜀an 0.46
𝜀ca 0.46
Electrode volume fraction
𝑉GDC 0.21
𝑉silver 0.79
TPB length of electrode
Anode 2.14 × 10⁵ m2 m-3
Cathode 2.14 × 10⁵ m2 m-3
Tortuosity
𝜏an 3
𝜏ca 3
Exchange current density
𝑖0CO 450 A m-2
𝑖0O2 400 A m
32 Charge transfer coefficient
𝛼CO 0.5
𝛼O2 0.5
Equilibrium constant of Boudouard reaction
𝑘rb = 6 × 10¹³ 1/s
Activation energy of Boudouard reaction
𝐸rb = 248 kJmol−1
33 Table2. Parameters used in Otto heat engine [46, 47]. 567
Parameter Value
Constant-volume heat capacity during the compression stroke, (J K-1)
0.2988
Constant-volume heat capacity during the power stroke, (J K-1) 0.4372
Constant temperature rate, (s K-1) 8.128×10⁻⁶
Constant temperature rate, (s K-1) 1.867×10⁻⁵
Compression ratio, 9.26
Specific heat ratio, 1.4
Dissipation power due to friction (W) 32.5
568 569
Table 3. Optimum value of compression ratio under different power dissipation , the 570
other parameters are as the same in Table 1 and Table 2. 571
(W) 0 16.25 32.5 48.75
- 12.48 9.26 7.80
572
1
V
C
2
V
C
1 K
2 K
r
b
opt
r b
b
opt
[image:33.595.51.529.86.364.2]34 List of Figures
573
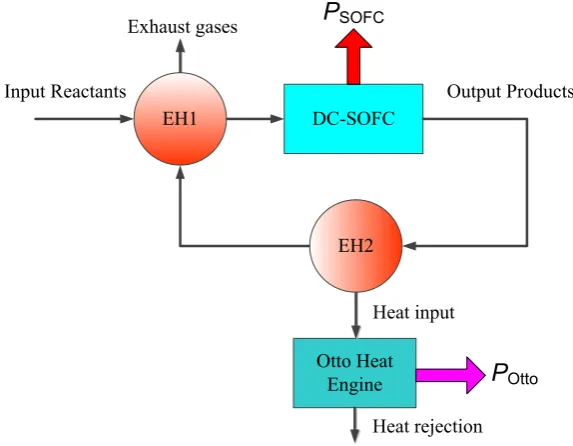
Fig. 1. Schematic diagram of (a) a DC-SOFC based system, (b) the heat and mass transfer 574
process at small operating current density, and (c) the heat and mass transfer process at large 575
operating current density. 576
Fig. 2. The curves of Q and V versus current density under different operating temperature, 577
where itn Itn A , is the polar plate area of the DC-SOFC, Vtn is the voltage
578
corresponding to itn. 579
Fig. 3. The pressure-volume diagram of the internal irreversible Otto cycle. 580
Fig. 4. The (a) efficiency, and (b) equivalent power density of the Otto heat engine under 581
different operating conditions, where POtto* POtto /A is the equivalent power density of the 582
Otto heat engine. 583
Fig. 5. Equivalent power densities of the DC-SOFC, Otto heat engine and proposed system at 584
(a) 1073 K, (b) 1123 K and (c) 1173 K. 585
Fig. 6. Equivalent efficiencies of the DC-SOFC, Otto heat engine and proposed system at (a) 586
1073 K, (b) 1123 K and (c) 1173 K. 587
Fig. 7. Effects of distance between carbon layer and anode electrode on the performance of the 588
proposed system at 1123K. 589
Fig. 8. Effects of compression ratio on the performance of the proposed system at 1123 K. 590
Fig. 9. Effects of compression ratio and power dissipation of the Otto heat engine on the 591
performance of the proposed system at 1123 K. 592
593
35 Fig. 1.
594
DC-SOFC
Regenerator
Otto Heat Engine
C/air CO/CO2/N2
External Heat Source
PSOFC
POtto
595
Fig. 1. (a) Schematic diagram of a DC-SOFC based system. 596
597
DC-SOFC EH1
Input Reactants
Output Products
PSOFC
Exhaust gases Heat SourceExternal
Heat input
598
Fig. 1. (b) Schematic diagram of the heat and mass transfer process at small operating current 599
36
DC-SOFC
Otto Heat Engine
EH2 EH1
Input Reactants Output Products
Heat input
Heat rejection
POtto
PSOFC
Exhaust gases
601
Fig. 1. (c) Schematic diagram of the heat and mass transfer process at large operating current 602
density. 603
[image:36.595.150.437.80.303.2]37 Fig. 2.
605
0 10000 20000 30000 40000
0 1 2 3 4 5
T = 1073 K
T = 1123 K
T = 1173 K
i (A m-2)
Q
(W)
Vtn
itn 0.0
0.2 0.4 0.6 0.8 1.0
V
(V)
606
Fig. 2. The curves of Q and V versus current density under different operating temperature, 607
where itn Itn A , is the polar plate area of the DC-SOFC, Vtn is the voltage
608
corresponding to itn. 609
610
38 Fig. 3.
611
Volume
P
re
ss
u
re
V1
V2
1 2
3
4
Q
Q
rAdiabatic
Adiabatic
P
OttoT4
T1
T2
T3
Internal irreversibility factor IR
612
Fig. 3. The pressure-volume diagram of the internal irreversible Otto cycle. 613
39 615
Fig. 4. 616
0 5 10 15 20 25 30 35
0 20 40 60
Ott
o
(%)
r b = 0
b = 16.25
b = 32.5
b = 48.75
(a)
617
5000 10000 15000 20000 25000 30000 35000 40000 45000 0
1000 2000 3000 4000 5000 6000
P
* Ott
o
(W m
-2 )
i (A m-2)
IR = 0.5
IR = 0.683
IR = 0.8
IR= 1.0
(b)
618
Fig. 4. The (a) efficiency, and (b) equivalent power density of the Otto heat engine under 619
different operating conditions, where POtto* POtto /A is the equivalent power density of the 620
Otto heat engine. 621
40 Fig. 5.
623
0 10000 20000 30000 40000 50000
0 2000 4000 6000 8000
P
* SO
FC
,
P
* Ott
o
,
P
* (
W m
-2 )
i (A m-2)
P*
SOFC
P*
Otto
P*
(a)
T = 1073 K
624
0 10000 20000 30000 40000 50000
0 2000 4000 6000 8000
T = 1123 K
P
* SO
FC
,
P
* Ott
o
,
P
* (
W m
-2 )
i (A m-2)
P*
SOFC
P*
Otto
P*
(b)
41
0 10000 20000 30000 40000 50000
0 2000 4000 6000 8000
T = 1173 K
P
* SO
FC
,
P
* Ott
o
,
P
* (
W m
-2 )
i (A m-2)
P*
SOFC
P*
Otto
P*
(c)
[image:41.595.153.428.80.297.2]626
Fig. 5. Equivalent power densities of the DC-SOFC, Otto heat engine and proposed system at 627
(a) 1073 K, (b) 1123 K and (c) 1173 K. 628
42 Fig. 6.
630
0 10000 20000 30000 40000 50000
0 20 40 60 80 100
SO
FC
,
Ott
o
,
(%)
i (A m-2)
SOFC Otto
(a)
T = 1073 K
631
0 10000 20000 30000 40000 50000
0 20 40 60 80 100
SOFC Otto
SO
FC
,
Ott
o
,
(%)
i (A m-2)
(b)
T = 1123 K
43
0 10000 20000 30000 40000 50000
0 20 40 60 80 100
SO
FC
,
Ott
o
,
(%)
i (A m-2)
SOFC Otto
(c)
T = 1173 K
[image:43.595.151.429.84.297.2]633
Fig. 6. Equivalent efficiencies of the DC-SOFC, Otto heat engine and proposed system at (a) 634
1073 K, (b) 1123 K and (c) 1173 K. 635
44 Fig. 7.
637
638
Fig. 7. Effects of distance between carbon layer and anode electrode on the performance of the 639
proposed system at 1123 K. 640
641
0 10000 20000 30000 40000 50000
2000 4000 6000 8000
Dce = 59 m
Dce = 309 m
Dce = 559 m
i (A m-2)
P
* (W m
-2 )
40 60 80 100
45 Fig. 8.
642
[image:45.595.153.448.115.321.2]643
Fig. 8. Effects of compression ratio on the performance of the proposed system at 1123 K. 644
645
0 5000 10000 15000 20000 25000 30000 35000 40000 45000 1000
2000 3000 4000 5000 6000 7000 8000
r = 3
r = 10
r = 15
i (A m-2)
P
* (W m
-2 )
20 40 60 80 100
46 Fig. 9.
646
647
Fig. 9. Effects of compression ratio and power dissipation of the Otto heat engine on the 648
performance of the proposed system at 1123 K. 649
650
0 10000 20000 30000 40000
0 2000 4000 6000 8000 10000
IR= 1.0; b = 0 IR = 1.0; b = 32.5 IR = 0.683; b = 32.5
IR = 0.683; b = 48.75 IR = 0.5; b = 48.75
i (A m-2)
P
* (W m
-2 )
20 40 60 80 100
[image:46.595.150.448.117.315.2]![Table 1. Model parameters used in DC-SOFC [15, 44, 45].](https://thumb-us.123doks.com/thumbv2/123dok_us/8987040.395442/31.595.72.515.79.739/table-model-parameters-used-in-dc-sofc.webp)
![Table 2. Parameters used in Otto heat engine [46, 47].](https://thumb-us.123doks.com/thumbv2/123dok_us/8987040.395442/33.595.51.529.86.364/table-parameters-used-in-otto-heat-engine.webp)