Modelling Harbour Seal Movements
Scottish Marine and Freshwater Science Vol 8 No 20
Modelling Harbour Seal Movements
Scottish Marine and Freshwater Science Vol 8 No 20
B McConnell, S Smout, and M Wu
Published by Marine Scotland Science ISSN: 2043-7722
Marine Scotland is the directorate of the Scottish Government responsible for the integrated management of Scotland’s seas. Marine Scotland Science (formerly Fisheries Research Services) provides expert scientific and technical advice on marine and fisheries issues. Scottish Marine and Freshwater Science is a series of reports that publishes results of research and monitoring carried out by Marine Scotland Science. It also publishes the results of marine and freshwater scientific work that has been carried out for Marine Scotland under external commission. These reports are not subject to formal external peer-review.
This report presents the results of marine and freshwater scientific work carried out for Marine Scotland under external commission.
© Crown copyright 2017
You may re-use this information (excluding logos and images) free of charge in any format or medium, under the terms of the Open Government Licence. To view this
licence visit:
http://www.nationalarchives.gov.uk/doc/open-governmentlicence/version/3/ or email [email protected]
Modelling Harbour Seal Movements
B McConnell, S Smout, and M Wu
Executive Summary
1. Both the quantification and modelling of harbour seal movement are required to predict the consequence of environmental change on population distribution and connectivity.
2. Two modelling approaches were considered. The first is an empirical Inter-Haulout Transition Rate (I-HTR) model which estimates the population
probability of an individual moving from one haulout site to another. The second is a mechanistic Individual Based Model (IBM) of movement which uses seal physiology in a simulated quasi-realistic environment to predict movement patterns. The scope of the IBM development is to demonstrate its ‘proof of concept’.
3. In the I-HTR model, data from harbour seals tracked in Orkney and the Pentland Firth (22 GPS / GSM tags and 19 Argos tags) are used to populate a transition matrix (TM) showing the frequency of movement from one haulout site cluster to another. The TM is statically adjusted to represent the likely transitions of the local population of seals. It is then transformed to represent the probability of movement per unit time. The TM can now be used as the basis for a time-based simulation of seal movement and connectivity. However, the I-HTR model is empirical and as such does not consider the causes of movement, and so is not well suited to predict the consequence of environmental change.
4. A prototype individual based model (IBM) of harbour seal movement over time scales of days/weeks has been developed for the Pentland Firth / Orkney area. Many of the parameters in the model are place-holders (albeit realistic ones), with values that will be refined in the next stage of model development. The prototype IBM has a simple structure but it nonetheless captures the basic movement patterns and behaviour that are observed in harbour seal telemetry data.
6. The prototype IBM has proven the concept and development work should continue to test whether the available data (seal and environmental), statistical selection and fitting techniques can ultimately progress to producing a robust management tool. However, an important future challenge is to sufficiently map and quantify the dynamics of the geographical resources that seals require, such as haulout sites and foraging areas. Approaches could include the use of
Contents
1 Introduction ... 1
2 Inter-Haulout Transition Rate Modelling ... 2
2.1 Introduction ... 2
2.2 Methods ... 2
2.2.1 Data collection ... 2
2.2.2 Data filtering ... 4
2.2.3 Defining haulout site clusters ... 6
2.2.4 Trip assignment ... 6
2.2.5 Construction of transition matrices ... 6
2.3 Discussion ... 12
3 Individual Based Modelling ... 13
3.1 Introduction ... 13
3.2 Harbour seal biology ... 14
3.3 Model structure ... 15
3.3.1 IBM currencies ... 15
3.3.2 Physiological urges and behavioural activities ... 15
3.3.3 Movement ... 16
3.3.4 Assessment of physiological urge ... 17
3.3.5 Resources: placement and assessment ... 18
3.4 Model simulations ... 21
3.5 Discussion ... 27
3.5.1 Mapping foraging patches and estimating gross energy intake ... 27
3.5.2 Behavioural choice ... 28
3.5.3 IBM selection and parameter estimation... 28
3.5.4 IBM management applications ... 29
4 Summary and recommendation ... 30
4.1 Inter-Haulout Transition Rate model ... 30
4.2 IBM ... 30
5 Acknowledgements ... 31
1
1 Introduction
Harbour seal (Phoca vitulina) movements are driven by the need to seek out
geographically dispersed resources (haulout sites and foraging areas) within a dynamic environment and according to the changing demands of their annual life cycle. Movements result in two emergent properties that are relevant to
conservation management. The first is geographic seal distribution, both hauled out on land and at sea. This distribution (also known as usage) is important for both
near-shore and offshore planning (Jones et al., 2016). The second is connectivity, or
the flux of seals from one haulout site to another. An example of the importance of connectivity is the need to know the impact of disturbance at one haulout site on a distant Special Area of Conservation (SAC) haulout site. Connectivity also
influences the transmission and persistence of disease.
To predict the consequence of change (natural or anthropogenic) on harbour seal movement patterns, it is necessary to quantify and model their movement patterns in a way that is representative of the local population. The aim of this study was to examine what modelling approaches are best suited to provide a robust
management tool that can predict the consequences of ‘what if’ scenarios on harbour seal movement.
The scope of the study was limited to movement patterns and consequent
distribution and connectivity. The population consequences (in terms of survivorship and fecundity) are outside the study scope. However, application of the models will
assist the ability of expert opinion to predict population consequences (Harwood et
al., 2014).
Two modelling approaches are presented. The first approach, Inter-Haulout Transition Rate (I-HTR) modelling, is an empirical one. Telemetry data from a sample of tagged harbour seals in Orkney and the Pentland Firth are used to create inter-haulout movement transition matrices which are adjusted to reflect the local
harbour seal population movements. The second approach is a mechanistic
Individual Based Model (IBM) of movement. IBMs predict emergent behaviour from physiological capabilities and constraints using a set of biologically realistic yet simple rules within a simulated environment. Given that these rules can be
2
2 Inter-Haulout Transition Rate Modelling
2.1 Introduction
Inter-Haulout Transition Rate (I-HTR) modelling is an empirical approach to summarise the connectivity within a network of harbour seal haulout sites. The approach is based on harbour seal telemetry data to determine the location of, and sequential use of, haulout sites. A haulout site can comprise a single seal on an isolated rock, or hundreds of seals hauled out within a square kilometre. To make the modelling tractable, geographically close haulout sites used by the tracked seals were clustered together. The transition between haulout sites requires the
codification of what constitutes a trip (which may or may not include a foraging bout). A transition matrix (TM) is then constructed. However, this represents the
movements of a sample of the population of seals, and then only up to nine months while telemetry tags functioned and remained attached to the seals. The TM is statically adjusted to represent the likely transitions of the local population of seals. The TM at this stage represents the probability of movement after each identified trip. However, trips may be of variable duration, so the TM must be expanded to include this variation. The TM would then describe the probability of transition per unit time. The TM may be further modified to restrict hauling out to the lower part of the tidal cycle.
2.2 Methods
Data collection
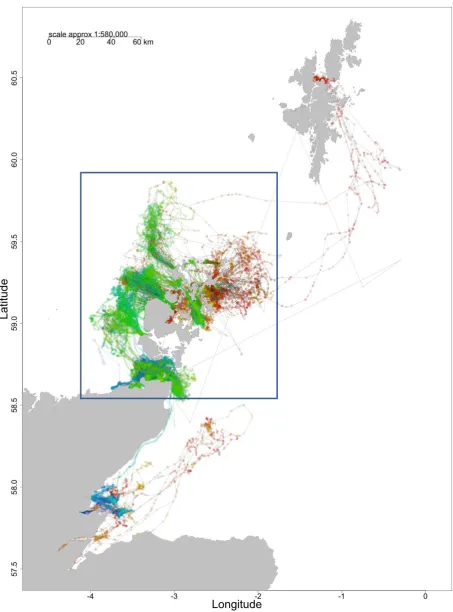
The study area used in the project was the Pentland Firth and Orkney Islands. The
study area limits were 4.1 W to 1.8 E and 58.6 N to 59.9N) (see the blue box in
3
Figure 1. Tracks from 41 harbour seal tags: 19 ARGOS and 22 GPS. Each
4
Table 1. Details of the 41 harbour seals included in the study. Longitude (Lon) and Latitude (Lat) indicate the approximate location of capture and tagging.
Tag ID Type Lon Lat Year Start
date
End date
Sex Mass (kg)
pv1-ali-03 ARGO
S
-2.55 59. 25
2003 02/10 06/04 F 87.0
pv1-bo-03 ARGO
S
-2.55 59. 25
2003 02/10 03/04 F 83.5
pv1-cat-03 ARGO
S
-2.55 59. 25
2003 02/10 06/05 F 66.0
pv1-dot-03 ARGO
S
-2.55 59. 25
2003 02/10 01/07 F 85.0
pv1-erin-03 ARGO
S
-3.02 59. 15
2003 02/10 15/03 F 82.5
pv6-pat-04 ARGO
S
-2.60 59. 11
2004 15/03 08/07 F 83.0
pv6-queenie-04
ARGO S
-3.02 59. 15
2004 16/03 23/06 F 93.5
pv6-sally-04 ARGO
S
-3.12 59. 14
2004 18/03 31/05 F 78.0
pv9-dory-04 ARGO
S
-4.01 57. 86
2004 17/10 09/03 F 60.0
pv12a-181-07
ARGO S
-4.40 57. 92
2007 01/03 13/06 F 61.0
pv24-112-11 GPS -3.16 58.
64
2011 24/09 09/03 M 92.8
pv24-148-11 GPS -3.16 58.
64
2011 24/09 14/02 M 76.2
pv24-150-11 GPS -3.16 58.
64
2011 26/09 17/01 F 86.6
pv24-151-11 GPS -3.16 58.
64
2011 25/09 06/12 M 84.8
pv24-153-11 GPS -3.16 58.
64
2011 26/09 25/01 F 72.0
pv24-165-11 GPS -3.16 58.
64
2011 30/03 17/05 M 90.6
pv24-394-11 GPS -3.16 58.
64
2011 30/03 26/06 M 49.6
pv24-541-11 GPS -3.16 58.
64
2011 30/03 10/08 M 96.8
pv24-580-11 GPS -3.16 58.
64
2011 29/03 01/07 F 89.0
pv24-590-11 GPS -3.16 58.
64
2011 30/03 09/06 M 49.8
pv24-598-11 GPS -3.16 58.
64
2011 29/03 17/07 F 84.6
pv24-622-11 GPS -3.16 58.
64
2011 31/03 15/06 M 91.4
pv24-x625-11
GPS -3.16 58.
64
2011 31/03 23/06 M 98.6
pv44-003-12 ARGO
S
-2.77 59. 18
2012 18/06 29/07 F 92.8
pv44-004-12 ARGO
S
-2.77 59. 18
2012 14/06 25/07 F 100.0
pv44-005-12 ARGO
S
-3.12 59. 14
2012 19/06 09/08 M 107.0
pv44-007-12 ARGO
S
-2.77 59. 18
2012 16/06 26/07 F 67.8
pv44-011-12 ARGO
S
-3.12 59. 14
2012 19/06 09/08 M 106.0
pv44-014-12 ARGO
S
-3.12 59. 14
2012 19/06 02/08 M 112.4
pv44-017-12 ARGO
S
-2.77 59. 18
2012 18/06 29/07 M 99.0
pv44-018-12 ARGO
S
-2.77 59. 18
2012 18/06 14/07 M 110.0
pv44-020-12 ARGO
S
-2.77 59. 18
2012 16/06 18/07 F 80.2
pv47-392-12 GPS -3.12 59.
14
2012 11/10 29/01 M NA
pv47-427-12 GPS -3.12 59.
14
2012 10/10 27/10 M NA
pv47-539-12 GPS -2.77 59.
18
2012 09/10 01/03 M NA
pv47-583-12 GPS -3.12 59.
14
2012 10/10 17/01 M NA
pv47-585-12 GPS -2.77 59.
18
2012 09/10 09/03 M NA
pv47-588-12 GPS -3.12 59.
14
2012 11/10 12/01 M NA
pv59-05-15 GPS -4.07 57.
95
2015 25/02 26/06 F 89.7
pv59-07-15 GPS -4.07 57.
95
2015 27/02 18/07 F 73.1
pv59-12-15 GPS -4.07 57.
95
2015 26/02 04/07 F 94.0
Data Filtering
5 GPS Tag Data
The median time that GPS tags transmitted data whilst attached to seals, or lifespan of the tags, was 87 days (range: 16 days to 176 days. Each location was assigned a 95 % C.I., the distance between the given location and the true location of the
animal. This distance was modelled (using a Gamma distribution) as a function of
the number of satellites, using a large published dataset on GPS error (Dujon et al.,
2014).
Using the track data, each time-stamped haulout was assigned a location. If there were any valid GPS locations during a haulout, the maximum likelihood coordinates were used for the haulout. If there were none, the GPS locations immediately preceding and immediately following the haulout were used to interpolate (linearly) the haulout location. These locations were then ‘snapped’ to the nearest coastline. The distance between the estimated and snapped location was termed the ‘snap distance’.
ARGOS Tag Data
The median lifespan of the ARGOS tags was 94 days (range: 32 days to 284 days).
A Speed-Distance-Angle filter was applied to exclude unfeasible locations (Freitas et
al., 2008). A maximum speed of 5m/s 1, threshold angles of 5/10 degrees and
distances of 5/10 km were used. The remaining locations were then Kalman filtered
(Jones et al., 2015).
However, some locations appeared (erroneously) on land. These were snapped to the coastline by the following method. Land locations were first snapped to the nearest coastline. The shortest path at sea between the locations at sea
immediately preceding and following the landlocked location was then calculated, and the landlocked location was then interpolated along this path.
Using the track data, each time-stamped haulout was assigned a location. If there were any valid ARGOS locations during a haulout, the median coordinates were used for the haulout. If there were none, the ARGOS locations immediately
preceding and immediately following the haulout were used to interpolate (linearly) the haulout location. For some haulouts, locations used for interpolation were distant
1
6
in time. Interpolated haulout locations with the longest time intervals (top 5 %) were excluded. The remaining locations were then snapped to the nearest coastline. Some interpolated haulout locations remained distant from the coast. This could be due to location error, the linear interpolation being carried out on locations that occurred long before and long after the seal had hauled out, or to extended surface
intervals (ESI) at-sea that can appear as haulout events (Ramasco et al., 2014;
Russell et al., 2015). Haulout locations over 2 km from the nearest coastline were
assumed to be ESI events and were therefore excluded.
Defining Haulout Site Clusters
Haulout sites determined from the seal tracks were grouped using a clustering algorithm (R package ‘hclust’, with the centroid method). The minimum distance between the centroid of haulout clusters was set at 3 km. This threshold was selected to identify as many distinct haulout sites as possible while staying outside the likely location error of ARGOS haulouts. Seventy haulout clusters were
produced and their coordinates were snapped to the nearest coastline (Figure 2).
Trip assignment
A trip was defined as ‘not hauled out for at least ten minutes’, and having moved at least 2 km away from the last haulout cluster, as smaller changes in locations could be simple location error. The entire track of a seal was thus divided into mutually exclusive trip and haulout states.
Construction of Transition Matrices
Maximum Likelihood Estimates
7
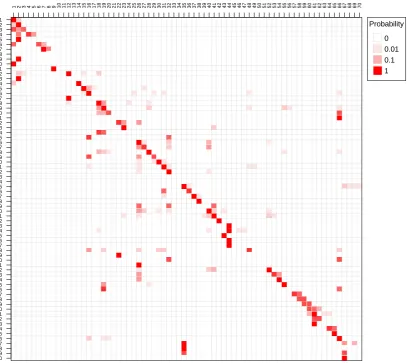
8 The blue box represents the study area.
Figure 3. The probability of transitions from one haulout cluster (rows) to another (columns) using data from 41 harbour seal tracks. These are the maximum likelihood estimates. The model only has a first-order memory. This means that where a seal hauls out next is only influenced by its previous haulout site.
Modelling Transition Probability
The transition matrices contain many zero probabilities – trips between haulout sites that were never observed. While some may correspond to trips that will never occur, many are likely to happen given a longer observation period. In addition, historical aerial survey data reveal seals hauled out at sites from which no trips were
observed. To fill in these gaps, the transition probability was modelled as a function of distance between sites (shortest sea route) and averaged historical aerial counts
of hauled-out harbour seals (1996 to 2014: Duck et al., 2015). The aerial counts
within 1.5 km of a haulout site were counted for each year, and the median count for
1 2 3 4 5 6 7 8 9 10 11 12 13 14 15 16 17 18 19 20 12 22 23 24 25 26 27 28 92 30 31 32 33 34 35 36 37 38 39 40 41 42 43 44 45 46 47 48 49 50 51 52 53 45 55 56 57 58 59 60 61 26 63 64 65 66 67 68 69 70
9
all available years was calculated. Transition probability was modelled with a zero-one inflated beta distribution (R package ‘zoib’) using the population level trips. The model explained 49% of the variance. The modelled transition probabilities were used to fill in gaps in the next step.
As tracks only covered a limited time (~ two months), only a sample of the haulout sites visited by each seal were observed. If the animals had been tracked for longer, the number of unique haulouts and trips would almost certainly be higher than that observed during the study period. The number of unique haulout sites visited by each seal over longer time periods was estimated by fitting a discovery curve, which models the rate at which new haulout sites are visited. The number of unique
haulout sites (Nunique) was modelled as a function of the number of haulout events
(Nevents) using the non-linear equation:
Nunique = β0 – e( -β1* Nevents)
where β0 is the maximum number of unique haulout sites that an animal visits and β1
is the rate of discovery. For each seal, haulout clusters were resampled with replacement 500 times and the curve was fitted to each bootstrap sample. This
yielded a distribution of β0, the expected number of unique haulout site clusters
visited and was summarised by a log-normal distribution for each animal. At the start of each simulation iteration the number of missed unique haulout site clusters
(Nmissed) was drawn randomly from this distribution, with the constraint that at least
one haulout site was missed. The identity of each new unique haulout site was drawn from a multinomial distribution, where the probability of a haulout cluster being selected equalled the sum of the modelled transition probabilities for each haulout cluster used by an individual tracked animal.
A trip ending at the new haulout cluster (E) was then added. The starting haulout
cluster (S) was drawn from among the observed haulouts. The probability of S being
selected was proportional to the modelled probability of transition from S to E and
the matrices of transition probability were then recalculated. As there were no data for trips originating from a new haulout cluster, the modelled probability of transition was used for each new haulout cluster.
Converting the TM to a Time-Base
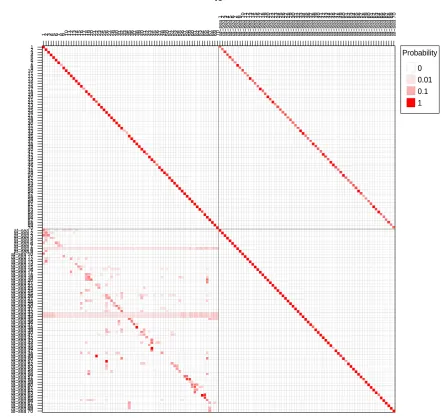
at-10
sea trips were used to estimate the hourly probability of remaining in each state.
These time-based transition probabilities were then used to populate a haulout/trip
transition matrix as illustrated in Figure 4. The upper left quadrant of the matrix refers to the probability of remaining at a haulout (diagonal with probabilities close to 1). The upper right quadrant refers to the probability of leaving a haulout and
entering an at-sea state. The lower right quadrant refers to the probability of remaining in an at-sea state. The lower left quadrant refers to the probability of hauling out at a haulout cluster given its previous haulout cluster. Seals cannot directly transit from one haulout cluster to another without first having transitioned via an at-sea state (indexed by its departure haulout cluster).
11
Figure 4. Example of a two-class (haulout and at-sea) transition matrix. The
elements represent the hourly probability of transitioning ‘from’ one state ‘to’ another. The upper left quadrant shows the probability of remaining at a haulout site. The probability of the alternative event (ending a haulout and entering the ‘at-sea’ state indexed by that haulout site) is shown in the upper right quadrant.
The lower right quadrant shows the probability of remaining in an ‘at-sea state’. The probability of the alternative event (ending a departure-specific ‘at-sea’ state and choosing where to haulout next) is shown in the lower left quadrant.
The TM illustrated may now be used to quantify the connectivity of any one haulout site with other sites.
1 2 3 4 5 6 7 8 9 10111213141516711819202122232452262728293031323334353637383940414243444546478449505152535455655758596061626364656667686970at−
12 2.3 Discussion
This movement model has two novel features. The first is that it infers which new haulout sites might have been used if the tagging duration of individuals had been longer. This was achieved by modelling a discovery curve. The second is that an
inference is made about movement patterns of the population of seals (from which
the sample of tagged animals are drawn).
Connectivity is an important consideration for marine regulators. Consider a haulout site designated as a Special Areas of Conservation (SAC) under the EC Habitats Directive - knowledge of inter-haulout connectivity with other haulout sites is needed to maintain such a discretely-delineated site at a favourable conservation status within a larger network. The degree of connectivity also impacts the interpretation of haulout count surveys by identifying the geographic scale of individual’s movements patterns.
Whilst outside the scope of this methodological study, the I-HTR model may be used to test for the effect of age, sex, and seasonality on inter-haulout connectivity where sufficient telemetry data are available to consider these factors. The TM may also be used to predict the dynamics of haulout site usage. This could be achieved by initially assigning (either randomly or informed by survey data) the population of local seals over the set of haulout sites. This vector of seal ‘location states’ could then be repeatedly multiplied by the TM. After a suitable run-in period, this vector would indicate the dynamics of population haulout site usage over periods of weeks. The emergent distribution may be stable, or cyclical. This theoretical prediction of population variability in haulout site usage can be tested against a time series of observations of a set of haulout sites, and then used to generalise the variability associated with single survey counts.
The I-HTR model is based on telemetry track data and the framework compliments extensive pelage recognition mark-recapture studies that can persist over many years. The I-HTR model is inherently empirical, thus, whilst useful for modelling the existing or historical dynamics of inter-haulout movement (the model does not predict where animals will be located at-sea), the I-HTR model is limited in its ability to
13
explore the feasibility of a mechanistic individual based model of harbour seal movement based on physiology, energy and information.
3 Individual Based Modelling
3.1 Introduction
This section explores the feasibility of constructing and populating a scalable, mechanistic harbour seal individual based model (IBM) to model harbour seal movements and ultimately to predict changes in their distribution in relation to man-made or natural environmental change. This compliments the I-HTR approach above. A limitation of the I-HTR approach is that modelled animals can only remember one step (transition) back and this is unlikely to be true in real seals. In addition, the I-HTR approach is purely empirical; that is, the model is not based upon individual seals’ strategies to achieve their energetic requirements through foraging and resting in a variable biological and social environment.
An IBM is a set of simple, biologically-derived rules that are applied to a population of simulated animals. The resulting patterns of movement and behaviour are
referred to as the IBM’s emergent properties. Examples of such properties include
various summary statistics of movement, distribution and activity budgets. These
properties may be compared with similar summary statistics (Thiele et al., 2014) of
real data to assess the model fit and to guide changes to the model structure. The IBM rules should be comprehensive enough to realistically predict seal behaviour under a number of ‘what if’ scenarios. On the other hand, too many rules will
produce an over-complex, computationally demanding model. Recent developments in IBM methodology have provided tools to determine optimal model complexity for a given purpose and to estimate model parameters (Railsback and Grimm, 2011;
Thiele et al., 2014).
14
An IBM2 has been developed in Denmark to explore the effect of noise on the
movements of harbour porpoises (Phocoena phocoena) (Nabe-Nielsen et al., 2013;
2014). However, there are basic differences in the movement behaviour of harbour seals and porpoises which must be reflected in changes to this model structure. On the positive side, the quantity and quality of data available for model validation and parameter estimation is far greater for harbour seals than was available for
construction of the porpoise IBM.
The aim of this study is to identify the components of a plausible harbour seal movement model and to identify the data that would be required to tune it into a useful predictive model. In addition to establishing ‘proof of concept’, the research requirements for full model development are discussed.
3.2 Harbour Seal Biology
An IBM should be based upon the known physiology and behaviour of the target species. The pertinent features of harbour seal biology are summarised here.
Harbour seals need to maintain both short-term condition (through foraging–resting cycles) and long-term condition (for females sufficient to produce a viable pup each year). The strategy seals use to attain these goals is both enabled and constrained
by their physiology, for example, ingestion/digestion rates (Sparling et al., 2007).
Harbour seals haul out on land at a variety of haulout sites, forming groups of various sizes. Some haulout sites may not be available during high water tides. Most haulout events last between 6 and 12 hours. This is followed by a foraging trip of between one and five days, typified by a directed travelling phase, an area
restricted search (ARS) or foraging phase, and a return phase of directed travel
(Cunningham et al., 2008). Few foraging trips extend further than 50 km from the
departure site. Usually the seal will return to the same haulout site and the ‘central place’ foraging pattern is repeated. This implies both navigational skills and the use of a spatial memory map. However, harbour seals occasionally move to alternative (sometimes distant) haulout sites, resulting in a larger total area being used.
Interruption of at-sea foraging with a terrestrial haulout may be ultimately driven by a
seal’s ability to ingest food faster than it can digest it (Sparling et al., 2007). Within
the general behavioural pattern described above, there may be considerable
variability. Whilst an individual may carry out repeated activity in one location, there can also be a high degree of inter-individual variability.
15
In summary, the activity of harbour seals may be grouped into three mutually
exclusive states: resting (both ashore and at sea), directed travelling and searching,
and foraging (Russell et al., 2015). This central-place movement contrasts with the
nomadic foraging of porpoises (Nabe-Nielsen et al., 2014).
3.3 Model Structure
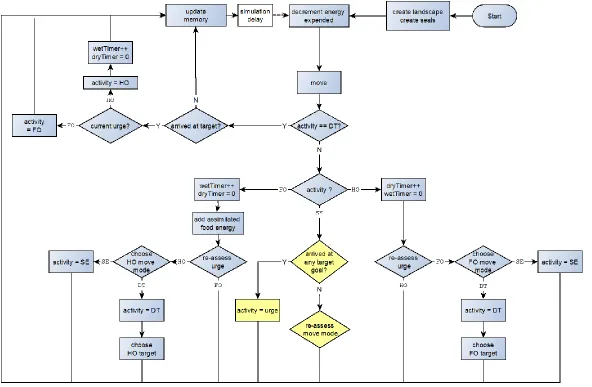
The biology of harbour seals is mapped onto a prototype IBM according to the
scheme illustrated in Figure 5. The types of variable assignments, the decision rules and parameters outlined below describe the current status of a simple prototype IBM. The development, testing and parameterisation of these rules are discussed below.
The following typographic convention is used below. Variables and variable classes
are shown in italic. Occasionally the plural version of a variable name may be used.
There are three variable classes: global (g) referring to all individuals,
individual-specific (seals), and landscape (lscape) which refer to the location and quality of
physical (e.g. haulout sites) and biological (e.g. prey) resources. Variable and parameter values are indicated in courier font. Values have been chosen based on published estimates and on unpublished SMRU data.
IBM Currencies
The IBM is based on two currencies: energy and information (Nabe-Nielsen et al.,
2013). Activity indexed energy assimilation and expenditure is based on information
in Sparling et al. (2007). Energy intake is based on a plausible (though speculative)
maximum of one 200 g fish caught every second dive during foraging (FO) activity
and subject to an energy assimilation factor. Each foraging patch has a quality index
which decrements this maximum rate. Such energy budget estimates are
placeholders to get the prototype IBM up and running, however, they are amenable to parameterisation, albeit with large confidence intervals.
The other currency, information, comprises the quality of resources previously visited and the navigational routes to get to them. This information is seal-specific and decays through time.
Physiological Urges and Behavioural Activities
Each seal in the IBM has physiological urge that alternates between foraging at sea
16
coexist and compete, the model only considers urge as a binary outcome, based
primarily on the recent condition and experience of an individual.
A physiological urge is potentially satisfied by the appropriate behavioural activity
(HO or FO). However, foraging patches at sea and haulout sites on land are frequently geographically separate. Thus, a change in the dominant physiological
urge will frequently require movement. Two types of movement activity are
considered: directed travel (DT) to a specifically chosen geographic target in a spatial memory map (SMM), a concept which is supported by observed high
inter-individual variation but low intra-inter-individual variation in foraging patterns (Sharples et
al., 2012), and searching (SE) for a generic target/resource.
In summary, there are two urges (HO and FO) which results in one of four
behavioural activities (HO, FO, DT and SE).
Movement
The IBM has four types of movement, each described by an activity-specific mean
speed and mean turning angle (and their variability). During haulout activity (HO)
there is no movement. During foraging activity (FO), there is a local area restricted
search (ARS) movement. The remaining two movement patterns involve directed or
searching transition (Nabe-Nielsen et al., 2013) from one resource to another.
Directed travel activity (DT) is based on the ability of a seal to store route information
to resources (haulout sites or foraging patches) in a SMM, and the ability to navigate such routes. Prior to IBM simulation, these routes are pre-computed as raster layers
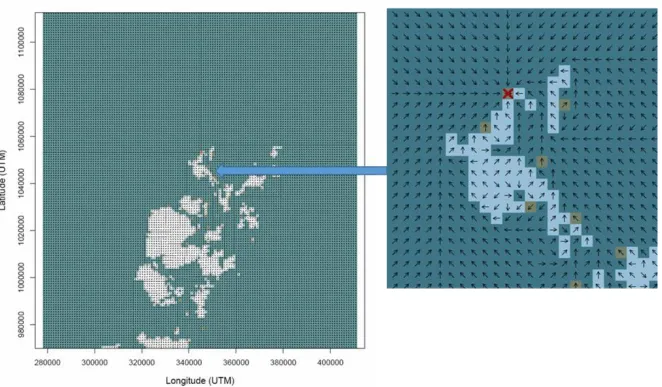
at a granularity of 1 km2, comprising vectors of the shortest sea-route to the target
from any starting-point raster cell. An example raster is shown in Figure 6. There is one raster layer per target destination. In the model, these shortest sea-routes are currently not influenced by tidal currents.
Before initiating directed travel, a geographical target destination is required. The choice of target destination (either a foraging patch or a haulout site) is drawn from possible destinations within an individual’s SMM. The choice is influenced both by the shortest sea-route distances to each candidate target, and the individual’s perception of the historical quality of each target. For a haulout, target quality is enhanced by the previous co-occurrence of other seals, but is not currently
17
prototype IBM, the actual choice is stochastic, with the destination randomly drawn using a multinomial distribution based on the modelled preferences.
The information in each individual’s SMM is forced to decay through time3
. This reflects the fact that old information may be less relevant to current conditions, for example the historical location of transient shoals of pelagic fish in a different season. The seal then travels the shortest sea route to the chosen destination target. In the IBM there is no feeding during this travel phase.
The fourth movement pattern is searching activity (SE). This movement mode is
selected if the memory mode has failed to maintain a satisfactory energy balance over a prolonged period (weeks). Search strategy is useful if a seal has an
incomplete or significantly decayed SMM. In the prototype IBM, each seal is initiated with complete and recent knowledge about haulout site and food patch location and
quality. Currently the search activity is not activated in the IBM, but it will take the
form of moving to a recently used foraging patch and then initiating a variant of a correlated random walk search.
Assessment of Physiological Urge
During haulout (HO) or foraging(FO) activities the prevailing physiological urge is
continually reassessed to determine whether it is still appropriate. During the
transitional activities (DT and SE) there is no reassessment of urge.
The urge assessment in the prototype IBM takes the general form:
current urge rule
FO If 3 days have elapsed since the start of foraging, or an extra 3%
of initial blubber energy has been gained since the last haulout
then switch urge = HO.
HO If 1 day has elapsed since the start of being hauled out, or a 3%
of initial blubber energy has been lost during the haulout then
switch urge = FO.
3
Each seal has two SMM structures: one for haulout sites and one for food patches. These take the
form of geo-referenced rasters, at a granularity of1 km2. For each cell visited, each map contains a
pair of values representing the perceived quality of the targeted resource and the date of the
18
This is a very simplistic rule. Also, there is no distinction between waiting nearshore
for a tidal haulout site to become available (current included in FO activity) and being
hauled out on land. Approaches to select and parameterise more complex rules are considered in the Discussion.
Resources: Placement and Assessment
For the prototype IBM, a subset of 10 of the Orkney/Pentland Firth haulout clusters identified by the I-HTR model were used (see Figure 2). They were assigned
uniform quality. Five foraging patches (restricted to only one 1 km2 raster cell each)
19
Figure 5. Simplified summary of prototype IBM structure. The following operators are used: ++ increment; =
20
[image:27.842.76.738.73.460.2]21 3.4 Model Simulations
The IBM scheme shown in Figure 5 was coded in the R language (R Core Team,
2017)4. The prototype was run over the same geographical extent as the I-HTR
model in the previous section, and at a spatial granularity of 1 km2 and temporal
resolution of 20 minutes. In each model run, the seal is provided with perfect knowledge of the locations and qualities of haulout sites and forage patches. The starting mass of each seal is set at 100 kg, and starting blubber mass is set at 25 kg. Assuming that 65% of the blubber is lipid and that lipid has an energy density of
3700 Jg-1, the starting blubber energy of each seal is calculated to be 481 MJ.
An example of a 10-day run with a single seal is shown in Figure 7. It commenced in
a hauled-out state (activity = HO) at a randomly chosen haulout site. As part of the
modelling process, no consideration was given to potential barriers to seal movement at sea, such as causeways or bridges. Future modelling could
incorporate such barriers. Figure 8 shows the sequences of energy storage,
physiological urge state and behavioural activity state.
Figure 7. Map showing the simulated track of one seal over approximately 14 days. Haulout sites and foraging patches are shown in black and red respectively.
4
[image:28.595.76.475.393.670.2]22
Figure 9 shows four seals run for a period of 140 days and Figure 10 shows the energy and state timeline for the first of the four seals.
The physiological urge alternates between HO and FO. This results in the
corresponding behavioural activity, lagged by the time needed to travel to and from
offshore foraging patches. The resulting total blubber energy budget, in turn,
influences the assessment of the dominant physiological urge.
23
Figure 8. Status timeline of the simulated seal shown in Figure 7. The top plot shows the total energy content of the blubber. The
red lines show the thresholds that influence a change of urge. The middle plot shows the changes of behavioural activities (HO =
hauled out, DT = directed travel, FO = foraging and SE = search (not currently supported)). The lower plot shows the changes in
[image:30.842.79.718.73.426.2]24
25
Figure 10. Status timeline of the first of four simulated seals shown in Figure 9. The top plot shows the total energy content of the
26
activities (HO = hauled out, DT = directed travel, FO = foraging and SE = search (not currently supported)). The lower plot shows
27 3.5 Discussion
There are three particularly important challenges in the development of a predictive harbour seal movement IBM (Thiele, 2014). The first is to adequately map and quantify the dynamics of the geographical resources that seals require, in this case haulout sites and foraging areas. The second is to construct and select an IBM of the appropriate structure and complexity. The third is to validate the predictions of the preferred IBM using observational data. Confronting these challenges depends on the data available and the results presented above show a reasonable
resemblance to real track and behavioural data. Such a qualitative judgement is a necessary first step, but not sufficient to defend the IBM as a robust predictive tool. It is therefore necessary to carefully assess the current prototype harbour seal IBM, understand its potential development and judge whether such developments are practicable.
Mapping Foraging Patches and Estimating Gross Energy Intake
The foraging patches used to illustrate the current IBM are a subset of those that were extracted from the track data. These, in turn, are probably a subset of the patches that are available to the seal population. The state space approach of
Russell et al. (2015) could be used to defensibly classify track segments, and thus
locations, that suggest foraging. Those preferred locations could then be characterised in terms of synoptic bio-physical information (e.g. distance from haulout site, depth, sediment type, tidal energy and water temperature). Such a preference model could be used to predict potential foraging regions, and foraging patches could be randomly spread over such regions, their local density being influenced by the degree of preference. Currently the patches are single, isolated 1
km2 cells. The track data suggest that they would be better represented as clusters
of varying degrees of preference. Boat-based, sonar surveys, or seal-borne video tags could also be used to survey prey fields.
The primary currency of the IBM is energy; therefore, indices of spatial preference must be transformed to metrics of the gross foraging energy income. The gross
energy gained during the forage activity may be estimated based on information from
tagged harbour seals from populations that, unlike those modelled here, are not in decline. Movement and behavioural data from such tagged seals can used in
state-space models to infer behavioural activity (Russell et al., 2015). It may be cautiously
assumed that seals tagged in the months preceding breeding will, at the very least, not lose body condition on average. Using this conservative assumption and the
28
(or minimum) gross energy gain rate during foraging may be estimated, if realistic estimates of energy expenditure in wild harbour seals become available. It should be possible to rank the energy gain from different patches based on a) repeated consecutive visits and b) the simulations use of a set of foraging patches by several
individuals5. Again, this analytical approach does not obviate the need to carry out
fine-scale energy consumption measurements on free-swimming seals.
Behavioural Choice
Behavioural activity in the IBM is driven by the dominant physiological urge.
Currently, the IBM uses a simplistic rule, based both on duration of current activity and energy balance, to determine the dominant urge. This generic rule avoids the fundamental question of which factor(s) drive and moderate a seal’s desire to haulout on land. Note that it is probable that in some circumstances these factors
result in an ESI at sea (Ramasco et al., 2014; Russell et al., 2015). Whilst ESI
activity is not currently included in the IBM it could be included in future revisions.
There are two classes of biotic factor that may drive haulout behaviour. The first class is time-driven. For example, increased time hauled out may minimise the probability of being attacked by a marine predator, or a certain amount of time may
be needed for fur maintenance6. The second class is event-driven. For example,
following a successful foraging event, however long it may take, a seal may choose
to defer digestion until it is hauled out (Sparling et al., 2007). This does not exclude
the possibility that haulout activity is multi-causal, nor does it exclude the hauling out activity being moderated by season, tide and weather. However, inspecting the track data for time- or event-driven haulout behaviour can assist in formal IBM selection.
IBM Selection and Parameter Estimation
To be a useful predictor of behavioural response to environmental change, an IBM of appropriate complexity must be validated and its parameters must be estimated as realistically and defensibility as possible.
In both model validation and parameter estimation, it is the emergent properties of multi-individual simulations that need to be fitted to corresponding properties (also known as summary statistics) of data obtained from tagged seals and haulout
5
The latter data should form a set of simultaneous equations whose solution could estimate relative gross energy gain from different patches.
6
29
counts. This does not require the fitting of predicted tracks, point by point, to individual tracks from real animals.
IBM selection and parameter estimation is challenging, but recent developments have made the problem more tractable (Beaumont, 2010; Grimm and Railsback,
2012; van der Vaart et al., 2016). For a harbour seal IBM, candidate summary
statistics (Thiele et al., 2014) of data that may be useful as fitting metrics include:
foraging trip duration patterns and auto-correlation7
foraging trip extent patterns and auto-correlation
proportion and variability of activity budgets (rest, directed travel, foraging,
hauled out)
proportion and variability of haulout duration
patterns of inter-haulout movement transitions (as derived from I-HTR
modelling above)
intra-individual synchrony in haulout site and foraging patch usage
Although physiological urges for each seal are generated in the IBM, these urges are latent (not directly observable) in conventional tracking data. However, specific studies that measure energy maintenance in wild or captive seals could usefully inform the IBM.
IBM Management Applications
IBMs offer the prospect of a biologically plausible and defensible framework to explain natural variability in behaviour and distribution and to predict the impact of environmental change. They seek to model the underlying processes from which distribution and connectivity emerge, rather than just describe the patterns
themselves (O'Sullivan and Perry, 2013).
IBMs can assist in the identification and monitoring of a network of protected areas (SACs and MPAs). Whilst the underlying conservation goal is to identify and protect
environments that are crucial to a species welfare, this is often condensed to
identifying areas of high and persistent usage. An IBM offers the potential to
consider what other areas could also support a species, and at what (if any) extra cost. Thus, they can identify what environments are, in fact, crucial. IBMs also offer
7
30
the potential to inform monitoring strategies. A typical question might be what is the expected magnitude and geographical extent of disturbance resulting from some anthropogenic (e.g. piling activity). By running a number of IBM simulations, the intensity, geographical extent and power of a proposed monitoring strategy to detect
change could be assessed a priori. IBMs also offer the opportunity to simulate the
efficacy of mitigation strategies.
The limited aim of this prototype harbour seal IBM is to predict movement, and thus the dynamics of their at-sea and terrestrial distribution. Currently, this prediction is restricted to outside the breeding season. However, as and when data permit, the framework could be extended to the breeding season. Ultimately, an IBM could inform population processes estimates. Although the effect of seal condition on the factors that control population dynamics (survivorship, fecundity and
immigration/emigration) is currently sparse or non-existent for harbour seals, the effect of environmental change on movement patterns will assist the ability of expert
option to predict population consequences (Harwood et al., 2014).
4 Summary and Recommendation
4.1 Inter-Haulout Transition Rate model
An inter-haulout transition rate model has been developed that quantifies the
probability of a harbour seal travelling from one haulout site to another. This model takes sample track data and makes inferences about where the tagged seals would move over longer periods, and also where the larger population of seals would move. This quantification of inter-haulout site connectivity can inform the geographical extent of proposed haulout surveys required to census a local population to answer questions such as over what geographical area can a non-breeding season harbour seal population be considered as closed? It can also assist in predicting the consequence of infectious disease. However, it is essentially an empirical model and as such is does not consider the causality of movement and so is not well suited to predict the consequence of environmental change. This latter task is better approached using an individual based model that is based on the physiological causality of movement.
4.2 IBM
31
attention on a future IBM development strategy and the data that would be required to progress the model to a useful management tool.
Most of the data required for model selection and parameterisation exist; but some are sparse or non-existent and demand further bespoke studies. The advantage of an IBM, with all the caveats mentioned above, is that uncertainty can be
incorporated throughout and will transfer to the emergent results. Sensitivity
analysis can be used to identify which parameters create the most uncertainty, and thus point to where more data are needed. A secondary advantage of the IBM approach is that it is essentially simple to understand and to demonstrate. Thus, it can be readily communicated to non-expert stakeholders.
Considerable work is required to develop the current, naive IBM into a useful and defensible management tool. However, the authors recommend that the benefits of success outweigh the risks of failure, and that further development is worthwhile .
5 Acknowledgements
32
6 References
Beaumont, M. A. 2010. Approximate Bayesian Computation in Evolution and
Ecology. Annual Review of Ecology, Evolution, and Systematics, 41, 379-406.
Cunningham, L. B., Baxter, J. H., Boyd, I. L., Duck, C. D., Lonergan, M., Moss, S. E. and Mcconnell, B. J. 2008. Harbour seal movements and haulout patterns:
implications for monitoring and management. Aquatic Conservation: Marine And
Freshwater Ecosystems, 19, 398-407.
Duck, C. D., Morris, C. D. and Thompson, D. 2015. The status of UK harbour seal
populations in 2014, including summer counts of grey seals. Special Committee on Seals Briefing Paper 15/04. St Andrews: Sea Mammal Research Unit, University of St Andrews.
Dujon, A. M., Lindstrom, R. T. and Hays, G. C. 2014. The accuracy of Fastloc-GPS
locations and implications for animal tracking. Methods in Ecology and Evolution,
5(11), 1162-1169.
Freitas, C., Kovacs, K. M., Ims, R. A., Fedak, M. A. and Lydersen, C. 2008. Ringed
seal post-moulting movement tactics and habitat selection. Oecologia, 155, 193-204.
Grimm, V. and Railsback, S. F. 2012. Pattern-oriented modelling: a 'multi-scope' for
predictive systems ecology. Philosophical Transactions of the Royal Society
B-Biological Sciences, 367, 298-310.
Harwood, J., King, S., Schick, R., Donovan, C. and Booth, C. 2014. A protocol for implementing the interim population consequences of disturbance (PCOD)
Approach: quantifying and assessing the effects of UK offshore renewable energy
developments on marine mammal populations. Scottish Marine and Freshwater
Science, 5(2), ISSN: 2043-7722.
Jones, E. L., Mcconnell, B. J., Smout, S., Hammond, P. S., Duck, C. D., Morris, C. D., Thompson, D., Russell, D. J. F., Vincent, C., Cronin, M., Sharples, R. J. and Matthiopoulos, J. 2015. Patterns of space use in sympatric marine colonial predators
reveal scales of spatial partitioning. Marine Ecology Progress Series, 534, 235-249.
Jones, E. L., Smout, S. C., Blight, C. J, Sparling, C. E. and McConnell, B. J. 2016. Fine-scale harbour seal at-sea usage around Orkney and the North coast of
33
Nabe-Nielsen, J., Sibly, R. M., Tougaard, J., Teilmann, J. and Sveegaard, S. 2014.
Effects of noise and by-catch on a Danish harbour porpoise population. Ecological
Modelling, 272, 242-251.
Nabe-Nielsen, J., Tougaard, J., Teilmann, J., Lucke, K. and Forchhammer, M. C. 2013. How a simple adaptive foraging strategy can lead to emergent home ranges
and increased food intake. Oikos, 122, 1307-1316.
O'Sullivan, D. and Perry, G. L. W. 2013. Spatial Simulation: Exploring Pattern and
Process, Chichester: Wiley-Blackwell.
R Core Team. 2017. R: A Language and Environment for Statistical Computing, Vienna, Austria: R Foundation for Statistical Computing.
Railsback, S. and Grimm, V. 2011. Agent-Based and Individual-Based Modeling: A
Practical Introduction, Princeton: Princeton University Press.
Ramasco, V., Biuw, M. and Nilssen, K. T. 2014. Improving time budget estimates
through the behavioural interpretation of dive bouts in harbour seals. Animal
Behaviour, 94, 117-134.
Russell, D. J. F., Mcclintock, B. T., Matthiopoulos, J., Thompson, P. M., Thompson, D., Hammond, P. S., Jones, E. L., Mackenzie, M. L., Moss, S. and Mcconnell, B. J. 2015. Intrinsic and extrinsic drivers of activity budgets in sympatric grey and harbour
seals. Oikos, 124(11), 1462-1472.
Sharples, R. J., Moss, S. E., Patterson, T. A. and Hammond, P. S. 2012. Spatial
Variation in Foraging Behaviour of a Marine Top Predator (Phoca vitulina)
Determined by a Large-Scale Satellite Tagging Program. Plos One, 7(5), e37216.
Sparling, C. E., Fedak, M. A. and Thompson, D. 2007. Eat now, pay later? Evidence
of deferred food-processing costs in diving seals. Biology Letters, 3, 94-98.
Thiele, J. 2014. R Marries NetLogo: Introduction to the RNetLogo Packag. Journal of
Statistical Software, 58, 1-41.
Thiele, J. C., Kurth, W. and Grimm, V. 2014. Facilitating Parameter Estimation and Sensitivity Analysis of Agent-Based Models: A Cookbook Using NetLogo and 'R'.
34
Van der Vaart, E., Johnston, A. S. A. and Sibly, R. M. 2016. Predicting how many animals will be where: How to build, calibrate and evaluate individual-based models.