University of California, Berkeley
U.C. Berkeley Division of Biostatistics Working Paper Series
Year
Paper
Performance-constrained Binary Classification
Using Ensemble Learning: an Application to
Cost-efficient Targeted PrEP Strategies
Wenjing Zheng
∗Laura Balzer
†Maya L. Petersen
‡Mark J. van der Laan
∗∗∗Division of Biostatistics, School of Public Health, University of California, Berkeley, [email protected]
†Department of Biostatistics, Harvard T.H. Chan School of Public Health, [email protected]
‡Division of Biostatistics, School of Public Health, University of California, Berkeley, [email protected]
∗∗Division of Biostatistics, School of Public Health, University of California, Berkeley, [email protected]
This working paper is hosted by The Berkeley Electronic Press (bepress) and may not be commer-cially reproduced without the permission of the copyright holder.
http://biostats.bepress.com/ucbbiostat/paper354 Copyright c2016 by the authors.
Performance-constrained Binary Classification
Using Ensemble Learning: an Application to
Cost-efficient Targeted PrEP Strategies
Wenjing Zheng, Laura Balzer, Maya L. Petersen, and Mark J. van der Laan
Abstract
Binary classifications problems are ubiquitous in health and social science
ap-plications. In many cases, one wishes to balance two conflicting criteria for an
optimal binary classifier. For instance, in resource-limited settings, an HIV
pre-vention program based on offering Pre-Exposure Prophylaxis (PrEP) to select
high-risk individuals must balance the sensitivity of the binary classifier in
de-tecting future seroconverters (and hence offering them PrEP regimens) with the
total number of PrEP regimens that is financially and logistically feasible for the
program to deliver. In this article, we consider a general class of
performance-constrained binary classification problems wherein the objective function and the
constraint are both monotonic with respect to a threshold function. These include
the minimization of the Rate of Positive Predictions subject to a lower bound on
the sensitivity, and vice versa, and the Neyman-Pearson paradigm, which
mini-mizes the type II error subject to an upper bound on the type I error. We propose
an ensemble approach to these binary classification problems based on the Super
Learner algorithm, characterized by weights combining the constituent risk
pre-diction algorithms and a discriminating risk threshold for classification that aim to
minimize the given constrained optimality criterion. We then illustrate the
appli-cation of the proposed classifier to develop an individual PrEP targeting strategy in
a resource-limited setting, with the goal of minimizing the number of PrEP
offer-ings while achieving a minimum required sensitivity. This proof of concept data
analysis uses baseline data from the ongoing Sustainable East Africa Research in
Community Health study.
1
Introduction
Binary classifications problems often arise in health and social science applications, wherein individuals classified into the ‘positive’ class are to receive an intervention of interest, which caries with it an associated resource cost. Therefore, it is often de-sirable, especially in resource-limited settings, to strike a balance between capacity constraints and the sensitivity of the classification algorithm. For example, consider a targeted HIV prevention strategy which prescribes a Pre-Exposure Prophylaxis (PrEP) regimen to individuals with substantial risk of infection. Delivery of PrEP requires a meaningful resource expenditure per individual treated, including ongoing medication and monitoring costs [1]. WHO Guidelines advocate targeting PrEP to subpopula-tions known to be at high risk for HIV infection [2]. However, within a generalized epidemic, the optimal demographic subgroups to target may not be self-evident, and simply offering PrEP to known high-risk subgroups, such as young women, or mobile populations, may be inefficient. In other words, a strategy that targets PrEP based on a more sophisticated use of individual characteristics may be able to reduce the resource spending per new HIV infection prevented. A natural question, therefore, is ‘how can individual characteristics be used to offer targeted PrEP in order to prevent as many new HIV infections as possible, given some fixed constraint on the total number of PrEP regimens offered?’. This questions translates into a binary classification prob-lem that aims to maximize sensitivity, subject to a constraint on the Rate of Positive Predictions (RPP). Alternatively, one might ask ‘how should PrEP be targeted at the individual-level in order to minimize the number of individuals offered Pr-EP while preventing a desired percentage of new infections?’ This question translates into a bi-nary classification problem that minimizes the RPP, subject to a sensitivity constraint.
The two problems we considered above are ubiquitous in devising cost-efficient intervention or prevention strategies. In fact, in many real-world applications, one of-ten wishes to balance two conflicting criteria for an optimal binary classifier, and/or the cost of misclassification is higher in one class than the other. To this end, we propose in this article a general group of Super Learner-based binary classifiers that aim to satisfy a wide class of performance-constrained optimality criteria. Super Learner [3] is an ensemble learning method in which a user-supplied library of algorithms are combined through a convex weighted combination, with the optimal weights selected to minimize a cross-validated empirical risk specified by the user. It can accommodate large classes of user-specified loss functions; standard implementations include the squared error loss and the log-likelihood loss. Theoretical results [4,5,6] exist to guarantee that the ensemble algorithm improves upon any of its constituent algorithms asymptotically. We first consider the binary classification problem of minimizing the Rate of Positive Predictions, subject to achieving a minimum sensitivity requirement. The proposed Super Learner-based binary classifier is characterized by weights combining the con-stituent risk prediction algorithms and a discriminating risk threshold for classification that together aim to minimize a sensitivity-constrained RPP. Next, we describe how the proposed method can be adapted to the converse problem of maximizing a RPP-constrained sensitivity. We then further extend the proposed Super Learner to a larger group of performance-constrained binary classification problems where the objective function and the constraint function are monotonic in the same direction with respect
to the threshold function. This type of classification problem includes the well-known Neyman-Pearson paradigm [7] which minimizes the type II error subject to an upper bound on the type I error.
As an illustration of the proposed methods, we develop and evaluate a hypotheti-cal HIV prevention strategy that uses a Super Learner-based binary classifier to offer PrEP to selected individuals, with the goal of minimizing the number of PrEP offerings while achieving a minimum target sensitivity. We use baseline data from the Sustain-able East Africa Research in Community Health (SEARCH, NCT01864603) study to illustrate the development and evaluation of this targeted PrEP algorithm, and compare its projected performance to standard subgroup-based PrEP strategies. In this example, classifiers are trained to predict baseline (prevalent) HIV status using individual-level demographics and other risk factor variables collected at baseline. (In real-world de-velopment of such a targeted PrEP algorithm, one would instead train the classifier to predict HIV seroconversions among baseline HIV uninfected individuals. However, as these seroconversions are interim primary outcomes of the ongoing SEARCH study, they will not be used in this example). We also employ in this example a second-level cross-validation evaluation scheme to assess and compare the performance (in terms of sensitivity and capacity savings) of different classifiers. This scheme seeks to mimic, to the extent possible, an intervention in which the classifier is trained on a random subsample of the population and applied to the remaining individuals. In this sense, we believe it to be a more pragmatic approach to evaluating the performance of a classifier developed with this objective than the standard area under the ROC curve [8].
1.1
Literature overview
A general solution to binary classification with performance constraints has been pro-posed by [9] within the context of statistical hypothesis testing, and encompasses the problems considered in the current paper. While the solutions developed by [9] have omnipotent applicability, their implementations are, to the best of our understanding, with respect to specific classification or prediction algorithms, and therefore may not be immediately translatable to ensemble learning, which allows one to combine several algorithms, and may have a higher technical barrier for implementation.
Of the class of performance-constrained binary classification problems considered in this article, the Neyman-Pearson paradigm is perhaps the most common one. The theoretical properties of single classifiers that solve the corresponding constrained op-timization problem with biased versions of the empirical False Negative Rate and em-pirical False Positive Rate were studied in [10] and [11]. Theoretical properties of an ensemble classifier based on convex-weighted majority vote of the constituent classi-fiers, with weights solving the corresponding convex optimization problem, were stud-ied in [12]. In the current paper, we show that the performance-constrained problems considered, including the Neyman-Pearson paradigm, can be recast as optimization of the objective function evaluated at an appropriate threshold, and therefore applicable beyond problems with convex objective and performance functions. We also approach the ensemble differently, by employing cross-validated versions of the objective func-tions and performance constraints to reduce overfitting, and by developing both a risk
predictor and a discriminating threshold to obtain a final classifier, instead of combin-ing base classifiers.
In a similar application setting, the use of individualized rules to offer selective HIV viral load testing to detect treatment failure in resource-limited settings had been proposed in [13] and [14], among others. In [13], one models the distribution of the risk score (based on a user-supplied scoring scheme) through a nonparametric or semi-parametric approach, and seeks a tripartite rule that minimizes a user-specified weighted combination of False Negative Rate and False Positive Rate, subject to a RPP constraint. In this sense, this program aims to satisfy a different goal than the RPP-constrained sensitivity or the Neyman-Pearson paradigm. While this constrained optimality criterion does not fall into the class we study here, it is an optimization ob-jective that is universal in many applications. The synergy between this work and the current paper would be a promising direction of research.
[14] proposed a Super Learner-based binary classifier to identify patients for se-lective viral load testing based on routinely collected data. This classifier first obtains risk prediction using the standard Super Learner (with weights optimized for the log-likelihood loss). A second-level cross-validation scheme is used to evaluate the per-formance of classifiers (our proposed evaluation scheme models after this one). The general performance of a classifier is summarized using the cross-validated area under the ROC curve across a range of discriminating thresholds. For a given lower bound on sensitivity, the cross-validated ideal RPP of a classifier is obtained by first comput-ing on each validation set the RPP under the largest threshold for which the sensitivity criterion is satisfied, and then averaging this ideal RPP across the validation sets. This is the ‘ideal’ RPP in that it uses the threshold one would have chosen if given the data-generating distribution of the evaluation data, not a threshold estimated from the learning data. The methods proposed in the current paper build upon and extend those in [14] in that the Super Learner weights are now optimized for the target constrained classification criterion, construction of the discriminating threshold is built into the classifier development, and the evaluation scheme assesses the empirical RPP under the risk predictor–threshold duo.
1.2
Organization
This article is organized as follows. In section2.1we formulate the binary classifi-cation problem of minimizing RPP subject to a sensitivity constraint. In section2.2
we propose a cross-validated objective function and the implementation of a Super Learner-based classifier which aims to optimize this objective function. In sections3.1
and3.2, we describe how the proposed formulation can be extended to the converse problem of maximizing sensitivity subject to a RPP constraint, and to a general class of binary classification problem with monotonic objective function and performance constraints. The corresponding Super Learner classifier is described in section3.3. In section4, we illustrate the development and evaluation of a targeted PrEP strategy based on the Super Learner classifier proposed in section2. We conclude the article with a summary.
2
Sensitivity-constrained minimization of the rate of
pos-itive predictions
2.1
Problem formulation
Consider the observed data structureO= (Y,W)∼P0, withY∈ {0,1}a binary class of
interest andW a set of covariates. For an estimatorψ:W →[0,1]ofEP0(Y |W), and
a thresholdc, the pair(ψ,c)defines a binary classification algorithm onW, wherein ψ(W)≥cis classified to the classY=1. Our goal is to learn a classification procedure
that achieves a sensitivity of at least s0, for some user-specified s0∈(0,1), with a
minimal Rate of Positive Predictions.
The sensitivity of(ψ,c)under a data-generating distributionPis given by
s(P;ψ,c)≡P(ψ(W)≥c|Y =1). (1)
Note thats(P;ψ,c)is one minus the conditional cumulative distribution ofψ(W)given
Y =1, and thus is monotonically non-increasing inc. In particular, for everyψ, we can define a uniquesensitivity threshold forψ under Pas:
c(P;ψ)≡max{c:s(P;ψ,c)≥s0}. (2)
In other words,c(P,ψ)is the largest threshold forψ under distributionPat which the
sensitivity is at leasts0.
Consider an objective function forψ, denotedr(P;ψ,c), that is monotonically
non-increasing inc. In this section, we takerto be the Rate of Positive Predictions:
r(P;ψ,c)≡P(ψ(W)≥c).
For a fixed data-generatingP0, our goal is a binary classification algorithm(ψ,c)
that satisfies thesensitivity-constrained minimization
minψ,cr(P0;ψ,c) such thats(P0;ψ,c)≥s0. (3)
Using the sensitivity threshold defined in (2), we can define asensitivity-constrained objective functionas
r(P0;ψ)≡r(P0;ψ,c(P0,ψ)). (4)
In words, this is the RPP of a classification procedure that combines the prediction functionψ with its sensitivity threshold underP0. Our optimal binary classifier is thus
given by(ψ0,c(P0,ψ0)), where
ψ0≡arg min
ψ
r(P0;ψ). (5)
It is easy to see that the constrained minimization problem in (3) can be solved by(ψ0,c(P0,ψ0)). Indeed, firstly, we know that(ψ0,c(P0,ψ0))satisfies the
sensitiv-ity constraint of (3). Secondly, suppose(ψ0,c0)also satisfies the sensitivity constraint.
Since for fixedP0andψ,sis a non-increasing function inc, the definition ofc(P0,ψ0)
implies thatr(P0;ψ0,c0)≥r(P0;ψ0,c(P0,ψ0))≡r(P0;ψ0). By definition ofψ0as a
so-lution of (5), we know thatr(P0;ψ0)≥r(P0;ψ0). Thereforer(P0;ψ0,c0)≥r(P0;ψ0)≥ r(P0;ψ0)≡r(P0;ψ0,c(P0,ψ0)). In other words,(ψ0,c(P0,ψ0))achieves the minimum
ofr(P;ψ,c)under the constraint.
Consequently, we can solve the constrained minimization problem in (3) by min-imizing the sensitivity-constrained objective function in (5). The latter problem seeks an estimatorψ ofEP0(Y|W)such that at its sensitivity threshold, this estimator
mini-mizes the objective function, compared to other estimators at their respective sensitivity thresholds. The formulation in (5) is more amenable to application under the existing Super Learner framework, and to asymptotic studies of a cross-validated sensitivity-constrained risk. We will devote our attention to estimating this optimal classifier
(ψ0,c(P0,ψ0)).
2.2
Super Learner classifier to minimize the sensitivity-constrained
RPP
In this section, we consider a Super Learner-based classifier that estimates the un-known optimal classifier defined in (5). LetM denote the set of all distributions for
O, including the true unknownP0, andW denote the outcome space ofW. An
es-timating procedureΨ:M →W[0,1] inputs a distributionPand outputs an estimator Ψ(P)≡ψ:W →[0,1]ofEP0(Y |W). If one assumes a parametric modelM, then
classical Maximum Likelihood Estimation (MLE) methods can be used to estimateψ0.
However, in most applications, it is often difficult to specify precisely how a large ar-ray of risk factors interact to produce the outcome of interest. Therefore, we use a nonparametric model forM. In this case, an ensemble learning method such as Super Learner would allow one to invoke a wide array of estimators, both parametric and nonparametric, in estimatingψ0.
For a measurable function f(O)of the data, and a distributionP, we will use the notationP f≡EP(f(O)).
2.2.1 Cross-validated sensitivity-constrained RPP
We described an objective function (4) for our classification problem, and appointed its minimizer to be our unknown optimal binary classifier. Therefore, estimating this objective function is central to our tasks of assessing the performance of candidate algorithms and selecting the optimal among them. To provide protection against over-fitting, we will accomplish these tasks using cross-validation.
Consider a split of a sample ofn independent and identically distributed (i.i.d.) copies ofOinto avalidation setand atraining set. This can be represented by a random vectorB∈ {v,t}n, indicating whether each of thenobservations is in the validation set (v) or the training set (t). We usePn to denote the empirical distribution of the n
i.i.d. observations, Pnv,B the empirical distribution of the validation set, andPnt,B the empirical distribution of the training set. Note that in our notation forB, we suppressed the fact thatB depends onn. The particular choice of cross-validation procedure is characterized by the distribution forB. For instance, in an M-fold cross-validation, the
distribution would place weight 1/M to each of theM vectors corresponding to each of theMfolds.
We define theempirical cross-validated sensitivity-constrained RPPofΨas
rn(Pn,Ψ)≡EBr Pnv,B;Ψ(Pnt,B)
. (6)
In words, for a sample spiltB, we obtain the riskr
Pnv,B;Ψ(Pnt,B)
as follows:
1. FitΨon the training setPnt,Bto obtain an estimatorψn,B≡Ψ(Pnt,B):W →[0,1].
2. Obtain the sensitivity thresholdcn,B≡c(Pnv,B,ψn,B)of this estimator under the
empirical distribution of the validation set. That is, we apply ψn,B to obtain
predictions for the validation set observations, and find the largest thresholdcfor whichPnv,BI(ψn,B(W)≥c,Y=1)
Pnv,BI(Y=1)≥s0. This can be implemented using the quantile function on the observations in the validation set withY=1. 3. The risk rPnv,B;Ψ(Pnt,B)
is given by the RPP Pnv,BI(ψn,B(W)≥cn,B), i.e. the
proportion of the observations in the validation set whose risk prediction under
ψn,Bsurpasses the corresponding thresholdcn,B.
Note that this empirical cross-validated sensitivity-constrained RPP in (6) is an estimator for theoracle cross-validated sensitivity-constrained RPP
r0(Pn,Ψ)≡EBr P0;Ψ(Pnt,B). (7)
In words, if we knewP0, we would fitΨon the training set to obtain the predictorψn,B,
and then determine the sensitivity-constrained threshold and corresponding RPP for this predictorψn,Bunder the trueP0. This is the true conditional sensitivity-constrained
RPP of the procedureΨ, conditional on being fitted on the training sets under the
specified cross-validation procedure on a sample of sizen. 2.2.2 Super Learner
Now we are ready to present a Super Learner for this binary classification problem. Suppose we haveJ constituent procedures Ψ1, . . . ,ΨJ, ofE0(Y |W). A constituent procedure may be a pre-specified parametric regression model, as well as machine learning approaches such as neural networks and random forests. It can also be aug-mented with a screening algorithm (e.g. only using variables that pass a correlation criterion).
Forα in the(J−1)-simplex∆J, we define Ψα(P)≡
J
∑
j=1
αjΨj(P).
EachΨα is thus a prediction algorithm that takesJindependent variables, which are
the predicted values from theJ constituent algorithms, and combines them through the linear combination given byα. The goal is to find the optimal weightα, and a
To apply the framework from the previous section, we can consider a representation
∆Jnof∆Jby partition intoK(n)many grids with size converging to 0 (e.g. size 1/nqfor q>0). As discussed in [3], minimization over∆Jnvs∆Jwould produce asymptotically equivalent procedures.
Consider anM-fold sample split, withPnv,m andPnt,m denoting them-th empirical distributions of the validation and training sets, respectively. Super Learner is a gen-eralized stacking learning method that can accommodate a wide range of optimality criteria. Standard implementations [15] produce predictorΨαn, whereαnminimizes
1 M∑ M m=1 Pnv,mL Ψα(Pnt,m) (O), withL Ψα(Pnt,m)
(O)being the minus log-likelihood loss
−
YlogΨα(Pnt,m)(A,W) + (1−Y)log 1−Ψα(Pnt,m)(A,W) ,
or the squared-error loss Y−Ψα(Pnt,m)(A,W)
2
. A Super Learner that maximizes the area under the ROC curve is presented in [16].
The proposed Super Learner predictor, which optimizes the constrained criterion in (3), is given byΨαn, whereαnminimizes the empirical cross-validated risk function
in (6): αn≡arg min α∈∆Jn rn(Pn,Ψα) =arg min α∈∆Jn 1 M M
∑
m=1 r Pnv,m;∑
j αjΨj(Pnt,m) ! (8)In words, we implement the functionrn(Pn,Ψα)ofαas follows: 1) atm-th fold, fit each Ψj on the training set to produce the combined predictorΨα(Pnt,m)≡∑jαjΨj(Pnt,m);
2) use the validation set to obtain the sensitivity threshold and the corresponding RPP
P Ψα(Pnt,m)≥c(Pnv,m,Ψα(Pnt,m)
; 3) the desiredrn(Pn,Ψα)is given by the average of
such fold-specified sensitivity constrained RPPs across the M folds.
To complete the classifier, we now require a threshold. The predictorΨαn is one
that has minimal (cross-validated) RPP at its sensitivity threshold. Therefore, we now focus our efforts on estimating its sensitivity threshold. Following analogous proce-dure, consider theempirical cross-validated sensitivity of a classification procedure based on predictorΨand thresholdc:
sn(Pn;Ψ,c) = 1 M M
∑
m=1 s Pnv,m;Ψ(Pnt,m),c= 1 M M∑
m=1 Pnv,m Ψ(Pnt,m)(W)≥c|Y=1. (9) This is an estimator of theoracle cross-validated sensitivitys0(Pn;Ψ,c) = 1 M M
∑
m=1 s P0;Ψ(Pnt,m),c.This is the true conditional sensitivity ofΨunder thresholdc, conditional on the
train-ing sets used to fit the risk prediction procedures. The sensitivity threshold for our predictorΨαn can then be estimated by finding a threshold that satisfies the constraint
on the empirical cross-validated sensitivity:
The final classifier is given by the pair(Ψαn(Pn),cn), where the predictorΨαn(Pn) = ∑jα
j
nΨj(Pn) is obtained by combining the constituent predictors fitted on the full
dataset. It classifies a givenW asI(Ψαn(Pn)(W)≥cn).
2.2.3 On applications with rare outcomes
In the HIV example considered in this paper, as well as in other applications where performance-constrained classification is needed, the outcomes of interest may be rare. In such cases and irrespective of the objective function considered, instead of using the full sample, the Super Learner can use a case-control subsample [17,18] that consists of all theHcases in the full sample plus a random sample of(C−1)×Hcontrols. Each observation in the subsample will be weighted by the inverse of its probability of being sampled from the learning data: cases will have weights 1, controls will have weights given by the number of controls in the full data divided by the number of controls in the subsample. Subsequently, the algorithm’s fit on the training set, as well as the fold-specific evaluation of the constraint and objective functions, will use weighted observations. Moreover, we can implement the Super Learner using a M-fold sample split that is stratified by outcome case, and thus ensuring that the validation sets have similar number of cases.
3
More general performance-constrained binary
clas-sification problems
In section2we considered a Super Learner-based binary classifier that minimizes the RPP subject to achieving a minimum sensitivity. In this section, we first consider the converse to this problem: maximizing the sensitivity subject to an upper bound on the RPP. We then unify these two under a larger class of performance-constrained binary classification problems.
3.1
RPP-constrained maximization of sensitivity
Suppose our goal now is to learn a classification procedure that can achieve maximal sensitivity subject to an upper bounds0on the RPP, for some user-specifieds0∈(0,1).
To keep the language parallel, we will formulate this problem in terms of minimizing the False Negative Rate (FNR), subject to a minimum Rate of Negative Predictions (RNP).
The RNP of a classifier(ψ,c)under a data-generating distributionPis given by
s(P;ψ,c)≡P(ψ(W)<c). (11)
This is the cumulative distribution ofψ(W), and hence is monotonically non-decreasing inc. In particular, for everyψ, we can define a uniqueRNP threshold forψ under P
as:
In other words,c(P,ψ)is the smallest threshold forψunder distributionPat which the
RNP is at leasts0.
Consider the objective function forψ, denotedr(P;ψ,c), to be the False Negative Rate:
r(P;ψ,c)≡P(ψ(W)<c|Y =1).
Likes(P;ψ,c),r(P;ψ,c)is also non-decreasing inc.
For a fixed data-generatingP0, our goal is a binary classification algorithm(ψ,c)
that satisfies theRNP-constrained minimization
minψ,cr(P0;ψ,c) such thats(P0;ψ,c)≥s0. (13) Using the RNP threshold defined in (12), we can define aRNP-constrained objective functionas
r(P0;ψ)≡r(P0;ψ,c(P0,ψ)). (14)
In words, this is the FNR of a classification procedure that combines the prediction functionψwith its RNP threshold underP0. Our optimal binary classifier is thus given
by(ψ0,c(P0,ψ0)), where
ψ0≡arg min
ψ r(P0;ψ). (15)
It is easy to see that the constrained minimization problem in (13) can be solved by(ψ0,c(P0,ψ0)). Indeed, firstly, we know that(ψ0,c(P0,ψ0))satisfies the RNP
con-straint of (15). Secondly, suppose(ψ0,c0)also satisfies the RNP constraint. Since for
fixedP0andψ,sis a non-decreasing function inc, the definition of c(P0,ψ0)given
in (12) implies thatc(P0,ψ0)≤c0. Sinceris non-decreasing inc, this inequality
im-plies thatr(P0;ψ0,c0)≥r(P0;ψ0,c(P0,ψ0))≡r(P0;ψ0). By definition ofψ0as a
solu-tion of (15), we know thatr(P0;ψ0)≥r(P0;ψ0). Thereforer(P0;ψ0,c0)≥r(P0;ψ0)≥ r(P0;ψ0)≡r(P0;ψ0,c(P0,ψ0)). In other words,(ψ0,c(P0,ψ0))achieves the minimum
ofr(P;ψ,c)under the constraint.
3.2
A general class of performance-constrained binary
classifica-tion problems
The two constrained binary classification problems we considered in section2and3.1
can be generalized to a larger class of performance-constrained binary classification problems where the objective function and the constraint are monotonic with respect to the threshold.
Specifically, for a binary classifier characterized by a risk predictorψand a
thresh-oldc, we wish to minimize an objective functionr(P0;ψ,c) that is monotonic inc,
subject to a constraint ˜s(P0;ψ,c)≥0, where theconstraint functions(P˜ 0;ψ,c)is also
monotonic inc. Suppose the constraint function ˜sis monotonic incin the same direc-tion of the objective funcdirec-tionr— that is, either both are non-decreasing incor both are non-increasing inc. Then, we can definec(P0,ψ)≡max{c: ˜s(P0;ψ,c)≥0}, in
the non-increasing case, andc(P0;ψ)≡min{c: ˜s(P0;ψ,c)≥0}, in the non-decreasing
case. In the two problems we considered previously, the RPP and the minimal sensi-tivity requirement correspond to non-increasing objective function and constraint, and
the FNR and the minimal RNP requirement corresponds to a non-decreasing objective function and constraint.
The constrained binary classification problem of min
ψ,cr(P0;ψ,c) such that ˜s(P0;ψ,c)≥0
can thus be solved by(ψ0,c(P0,ψ0))where ψ0≡arg min
ψ
r(P0;ψ,c(P0,ψ)).
Indeed, if a pair(ψ0,c0)satisfies the constraint, then eitherc0≤c(P0,ψ0)andr(P0;ψ0,c0)≥ r(P0;ψ0,c(P0,ψ0)) in the non-increasing case, or c0 ≥c(P0,ψ0) and r(P0;ψ0,c0)≥ r(P0;ψ0,c(P0,ψ0))in the non-decreasing case. Hence, in both cases, r(P0;ψ0,c0)≥ r(P0;ψ0,c(P0,ψ0))≥r(P0;ψ0,c(P0,ψ0)), by definition ofψ0.
This group of classification problems includes most constraints and objective func-tions that are the traditional performance metrics, and addresses many applicafunc-tions where one must balance conflicting performance criteria. In particular, it includes the commonly known Neyman-Pearson criterion, which aims to minimize type II error (i.e. minimize False Negative Rate) with an upper bound on type I error (i.e. lower bound on True Negative Rate).
3.3
Super Learner
Once the parallel formulation to the problem considered in section2is established, the corresponding Super Learner-based classifier can be obtained in a similar manner. We will not repeat the entire description here, but only highlight the relevant modifications. The cross-validated riskrn(Pn,Ψα)of each potential weightα is obtained as
fol-lows. At foldm, fit each constituent algorithmΨj on the training set to produce the
combined predictorΨα(Pnt,m)≡∑jαjΨj(Pnt,m). To compute the thresholdc Pnv,m,Ψα(Pnt,m)
of this estimator under the empirical distribution of the validation set, we applyΨα(Pnt,m)
to obtain predictions for the validation set observations, and either find the largest thresholdc, in the case of non-increasing objective and constraint, or find the small-est thresholdc, in the case of non-decreasing objective and constraint, among those satisfying the constraint, i.e. among the setc: ˜s Pnv,m;Ψα(Pnt,m),c
≥0 . The corre-sponding risk ofΨα on this fold is thusr Pnv,m;Ψα(Pnt,m),c Pnv,m,Ψα(Pnt,m)
, i.e. the objective function evaluated at the predictorΨα(Pnt,m)and its corresponding constraint
thresholdc Pnv,m,Ψα(Pnt,m)
. The desired cross-validated risk ofΨα is thus given by
the average of such fold-specific risks:
rn(Pn,Ψα)≡ 1 M
∑
mr P v n,m;Ψα(Pnt,m),c Pnv,m,Ψα(Pnt,m) .The Super Learner weightsαnis the weight vector that minimizesrn(Pn,Ψα). In the
RNP-constrained minimization of FNR considered in section3.1, the threshold for the foldmwould be the smallestcsuch thatPnv,mI Ψα(Pnt,m)(W)<c
−s0≥0, and the
corresponding risk on this fold is the FNR
Pnv,mI Ψα(Pnt,m)(W)<c,Y =1)
Correspondingly, theempirical cross-validated constraint functions˜of a classifi-cation procedure based on predictorΨand thresholdcis
˜ sn(Pn;Ψ,c) = 1 M M
∑
m=1 ˜ s Pnv,m;Ψ(Pnt,m),c .Consequently, the threshold for our predictorΨαncan be estimated by finding a
thresh-old that satisfies the empirical cross-validated constraint:
cn≡max{c: ˜sn(Pn;Ψαn,c)≥0} andcn≡min{c: ˜sn(Pn;Ψαn,c)≥0},
in the non-increasing and the non-decreasing cases, respectively.
The final classifier is given by the pair(Ψαn(Pn),cn), where the predictorΨαn(Pn) = ∑jα
j
nΨj(Pn)is obtained combining the constituent predictors fitted on the full dataset.
It classifies a givenW asI(Ψαn(Pn)(W)≥cn).
The comments in section2.2.3on case control sampling in applications with rare outcomes naturally apply here.
4
Application to an individualized targeted PrEP
strat-egy
4.1
Background
We now consider an example from HIV prevention. Pre-exposure prophylaxis (PrEP) is an HIV prevention method in which uninfected individuals follow a regimen of an-tiretroviral medication to reduce their risk of infection. As of September 2015, the World Health Organization recommends that individuals with high risk of HIV infec-tion be offered PrEP as part of a comprehensive preveninfec-tion strategy [2]. The success of this prevention tool relies on consistent use of the medication and regular monitor-ing, leading to considerable resource expenditure associated with each PrEP regimen. Therefore, for long-term sustainability, prevention programs need strategies for iden-tifying high risk individuals for PrEP eligibility that optimize population level impact within resource constraints. In regions with generalized epidemics, offering PrEP to known demographic risk groups may be neither optimally effective nor optimally effi-cient. The highest risk subgroups, such as individuals in a serodiscordant relationship, may represent only a minority of total new infections in the general population, while broader demographic groups, such as young women, that include a larger proportion of new infections may have too low an incidence to form the basis of a cost-efficient tar-geting strategy. Flexible machine learning methods for building individual risk scores that appropriately tradeoff sensitivity and constrained roll out therefore have the poten-tial to improve the impact of PrEP as an HIV prevention tool.
In this example, we consider a hypothetical PrEP-based prevention program in Eastern Uganda. The goal of this program is to offer PrEP to select HIV uninfected individuals in the target population in order to prevent 80% of new infections, while keeping the number of such offerings to a minimum. To this end, we would like an
algorithm that uses individual-level data to identify prospective seroconverters with a sensitivity of at least 80% while minimizing the number of positive predictions. To further illustrate strategy development, we consider an implementation scenario where, while the algorithm training has at its disposal a large array of variables, at the program rollout only a limited number of variables can be collected at real-time on the prospec-tive individuals. Consequently, the constrained optimality criterion will also be used to select a small subset of the variables to be used in the implemented algorithm. We will compare the performance of the targeted Super Learner-based strategy to a conven-tional subgroup-based strategy wherein one offers PrEP to everyone in a pre-specified subgroup defined by strata of demographic factors. In this example, we could also use a standard implementation of the Super Learner with a minus log-likelihood loss function, as carried out in [14] for predicting viral load failure among HIV patients on treatment (more detail in section1.1). This standard implementation is not designed to optimize the constrained criterion under consideration, but it is still of interest for our application. It will be included in our example for comparison.
4.2
Methods
4.2.1 Data, target population and outcome of interest
In this example, we will use baseline data from the SEARCH study to illustrate the development and demonstrate applicability of such an targeted PrEP algorithm. The SEARCH study is a cluster-randomized trial that includes 32 communities of roughly 10,000 persons each, in Uganda and Kenya. The first phase of this study tests a community-level intervention that consists of annual community-based HIV and multi-disease testing, with immediate linkage to care, antiretroviral therapy (ART) eligibility for all HIV-infected individuals, and streamlined ART delivery using a patient-centered model. At baseline, the population of each community was enumerated through a door-to-door household census, and basic demographics (age, sex, marital status and occupation) were collected on all household members. Then, baseline HIV testing and other baseline data collection were performed during a community health campaign and subsequent home-based tracking for those that did not attend the campaign. We refer to [19,20] for a detailed exposition on the census and the community-based HIV and multi-disease testing campaign. In this example, we use baseline data from 10 communities in Eastern Uganda.
Our target population is adult community residents (≥15 years of age) with a con-clusive baseline HIV test result from these 10 communities. Our classifier will be trained to predict the baseline prevalent HIV status with the goal of achieving at least 80% sensitivity while minimizing the number of positive predictions. Importantly, this baseline data analysis is intended solely as a proof of concept; in designing a classifier for use in the actual targeted PrEP strategy deployed in the second phase of the SEARCH study, we instead train the classifier to predict seroconversion outcomes among baseline HIV uninfected individuals in a target population that includes all re-gions in the study. However, as these seroconversions are interim primary outcomes of the ongoing SEARCH study, this seroconversion analysis is not described here. We chose Eastern Uganda as an illustration of the method because it has the lowest
base-line HIV prevalence, and is thus more comparable to a seroconversion outcome which is expected to be rare.
4.2.2 Candidate predictors and models
In this example, we consider an implementation scenario where only a limited number of predictor variables can be collected on the prospective individuals during the rollout of the program. Therefore, as part of the algorithm development the investigator must decide which subsets of the predictor variables should be used. Suppose also that variables within the same domain can often be found in the same data source. Therefore to minimize the number of data sources needed at the program rollout, one would group the predictor variables by domain:
• Demographics: age, gender, occupation, marital status, polygamy, educational attainment, and circumcision (for males).
• Mobility: whether (and for how many months) a stable resident, whether had lived outside the parish in the past year, number of nights spent in your own residence in the past months.
• Reproductive Health: pregnancy in the past 12 months (females), whether you or your partner currently using contraception.
• Drinking: whether drink alcohol, how often binge drink (6 or more drinks at once), many days in a months drink alcohol, how many drinks in a typical day.
• Depression: Patient Health Questionnaire-2 score [21], Generalized Anxiety-2 score [22].
• Work Productivity: days worked in the past month, hours worked in a normal day in the past week.
From here onward, by a ‘Model’ we mean a combination of predictor variables from these domains. For instance the modelDemographics.Mobilitywould use the variables under the domains Demographics and Mobility. We will be considering mod-els that combine Demographics with each one of the other domains. These make up a total of 6 models under consideration.
4.2.3 Building the Super Learner-based classification algorithm.
For each of the models considered, we apply the Super Learner classifier described in section2to classify the baseline HIV status, with the goal of minimizing the Rate of Positive Predictions while achieving a sensitivity of at least 80%. The constituent algorithms consist of screening-prediction pairs. The risk prediction algorithms in-clude Lasso regression [23], main term logistic regression, generalized additive model [24,25], random forest [26], Bayes logistic regression [27], and recursive partition-ing regression [28]. Each of these candidate prediction algorithms is augmented with
screening algorithms that either use a) all the variables, b) only the top 10% most cor-related variables, or c) only variables with a T-test p-value of less than 0.1. We imple-ment a Super Learner-based classifier that constructs a risk predictor through a linear combination of the constituent algorithms, with weights minimizing the sensitivity-constrained RPP, and uses as its threshold the cross-validated sensitivity threshold in (10). Besides the proposed Super Learner, we can also use a standard implementa-tion of the Super Learner risk predictor (with weights minimizing the risk associated with minus log-likelihood loss), coupled with the cross-validated sensitivity threshold in (10). We will call the former theconstrained RPP Super Learner, and the latter the
log-likelihoodSuper Learner. We will apply both Super Learner-based classifiers in
this example for comparison.
To mitigate the rare outcome, the Super Learner uses a case-control subsample from the learning data that consists of all theHbaseline HIV positive cases and a random sample of(C−1)×H controls. We implement the Super Learner using a 10-fold sample split that is stratified by outcome case.
4.2.4 Performance assessment
We assess the performance of each classifier in terms of empirical sensitivity, as mea-sured by the true positive rate, and the number needed to treat (NNT), as meamea-sured by the total number of positive predictions divided by the total number of cases identified. If a case consisted of a seroconversion (rather than, as here, a prevalent HIV case), this latter measure conveys the number of individuals offered PrEP per infection potentially prevented (actual infections prevented would of course also depend on uptake and ad-herence to PrEP among those individuals to whom it was offered). NNT allows for capacity-spendings comparison across individual and subgroup based strategies. The empirical sensitivity and NNT are assessed through the average of 10 repetitions of a 10-fold split of the baseline target population into a learning dataset and an evaluation dataset. Specifically, we split the sample into 10 folds; on each fold, we use the learning dataset to fit the Super Learner classifier (characterized by weightsαnand thresholdcn,
with ’full data’Pnbeing the learning dataset), and then apply it to classify the
individ-uals in the evaluation set and obtain the fold-specific sensitivity and NNT measures of the classifier. We then average each performance measure across the 10 folds to obtain the cross-validated sensitivity and the cross-validated NNT of this classifier under the 10-fold split. Lastly, we repeat this 10-fold splitting and cross-validation evaluation scheme 10 times, and then average the resulting validated sensitivity and cross-validated NNT. This would assess the average sensitivity and NNT of a strategy where we use a random subset of individuals in the population to train the classifier and apply the learned strategy to an independent sample from the same population.
These average cross-validated sensitivity and NNT measures can also be applied to evaluate the performance of subgroup-based strategies, wherein one only recommends PrEP to individuals in a pre-defined subgroup prescribed by baseline variable strata. In these cases, as there is no algorithm fitting in the learning set, the fold-specific sensi-tivity is the number of cases in the stratum in the validation set divided by the number of cases in the validation set, and the fold-specific NNT is the size of the stratum in the validation set divided by the number of cases in the stratum in the validation set.
We believe the average cross-validated measures are more realistic assessments com-pared to the absolute sensitivity and NNT based on entire population stratum, since they mimic a real-world implementation where one learns, from a random sample, strata with highest risk of infection, and then subsequently offer PrEP to others in the population within those strata.
4.3
Results
The dataset consists of 44762 adult (age 15 or older) residents from the 10 Eastern Ugandan communities enumerated in the SEARCH baseline survey, with conclusive baseline HIV test results. Of these, 1493 had a positive baseline HIV test (3.3% preva-lence). In Table1, we describe the baseline HIV status per stratum of key baseline variables. We reiterate here that since only baseline data is used in this example for il-lustration and proof of concept for the proposed classifier, the reader must not interpret the subject matter-specific results in this analysis as directly translatable to risk fac-tors in seroconversion, nor the performance assessments as indicative of actual results expected from such a targeted PrEP strategy.
4.3.1 Subgroup-based strategies
In the Table 1, we also assess the average cross-validated sensitivity and NNT of subgroup-based strategies that would roll out PrEP to all individuals in a stratum. A strategy to roll out PrEP to everyone in the population would have a sensitivity of 100%, at the cost of 30 individuals offered PrEP per infection potentially prevented; this should serve as a benchmark for the upper-bound cost of a PrEP prevention pro-gram. By way of comparison, if we were to offer PrEP to all those employed in the farming sector, we would achieve a sensitivity of 74% at the cost of 25.33 NNT. In general, a subgroup-based strategy using any one stratum in this table would have a cost of 30 NNT or greater in order to achieve a sensitivity of at least 80%. For an NNT less than 30, the highest sensitivity achieved is less than 75%.
Based on the above observation, an ad-hoc data-adaptive approach to building a targeted PrEP strategy might simply combine the most promising pre-specified sub-groups; for example those with a sensitivity above 60% and an NNT less than 30. In our example, such an approach would offer PrEP to all women as well as men that are married and/or employed in farming. This subgroup has a total of 38,321 indi-viduals (85% of the total population), with 1,457 positives. This strategy would have an average cross-validated performance of 98% sensitivity with a cost of 26.86 NNT. This ad-hoc strategy illustrates that the more variables we combine, the greater gain in capacity savings (less NNT for a given sensitivity level).
4.3.2 Super Learner-based strategies
Now, we turn to the performance of the proposed Super Learner-based PrEP strategy, calibrated to achieve at least 80% sensitivity while minimizing the rate of positive pre-diction. We implemented the Super Learner algorithms with a case-control sampling ratio ofC=10.
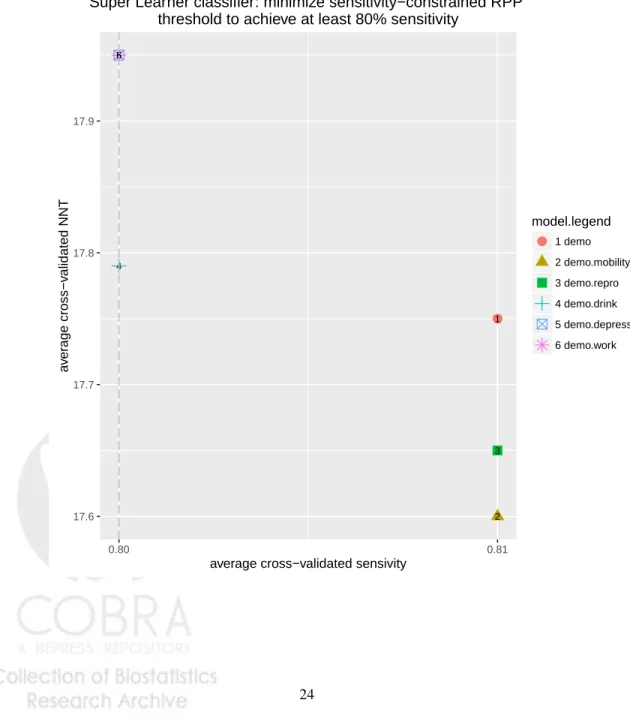
The empirical performance of the constrained RPP Super Learner using each of the models considered in section4.2.2, as assessed by the average cross-validated sensitiv-ity and NNT, is depicted in Figure1. The empirical sensitivities were about 80-81%, above the nominal 80% and thus satisfying the required constraint, with a cost of only 17-18 NNT. In other words, the proposed constrained RPP Super Learner-based strate-gies are less costly than the subgroup-based stratestrate-gies in Table1that could yield over 70% sensitivity, and are more sensitive to subgroup-based strategies of similar cost.
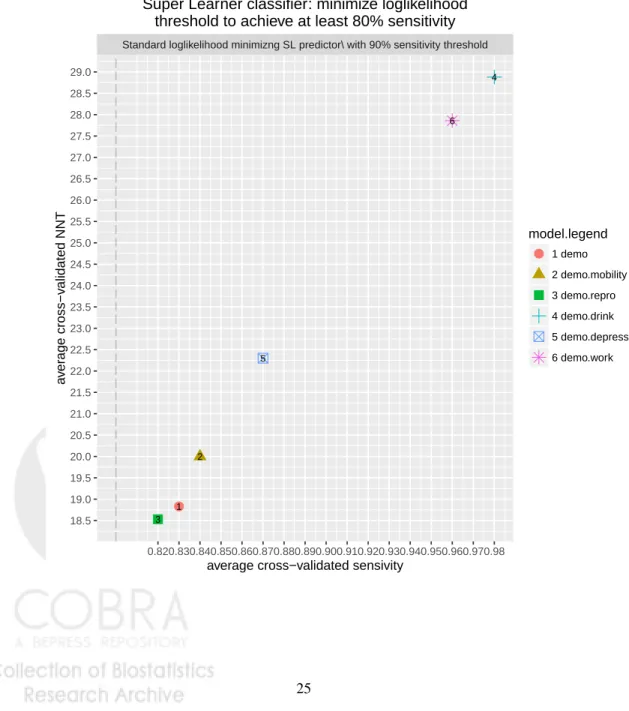
We further contrast the performance of the constrained RPP Super Learner pro-posed in this paper with the standard log-likelihood Super Learner. The performance of the log-likelihood Super Learner-based classifier is depicted in Figure2. The cross-validated sensitivity threshold again ensured that the sensitivity constraint is achieved in a new dataset. However, as this Super Learner predictor was optimized for the log-likelihood loss, not the RPP, the resulting classifier tends to overshoot the required sensitivity level, resulting in a higher NNT than that achieved by the constrained RPP Super Leaner.
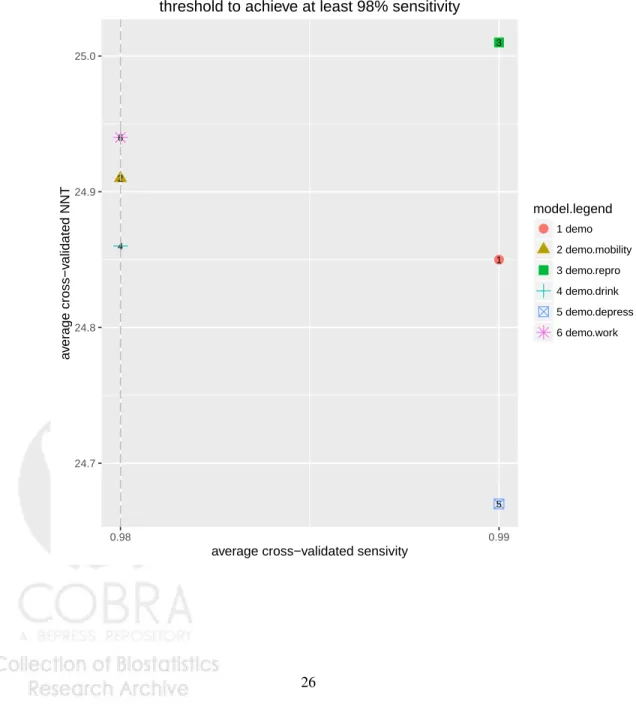
We have seen in section4.3.1that a composite subgroup strategy (all women as well as men who are married and/or employed in farming) could yield a classifier that achieves 98% sensitivity with about 27 NNT. We also saw in Figure2 that an individual strategy using a log-likelihood Super Learner classifier could achieve a 98% sensitivity with about 29 NNT. Let us now consider the proposed constrained RPP Super Learner classifier calibrated to achieve at least 98% sensitivity. Its performance is depicted in Figure3. To achieve 98% empirical sensitivity, such strategy would use about 25 NNT. To translate these performance metrics into implementation logistics, in a population with about 1500 cases, a strategy with 98% sensitivity at 25 NNT would result in 1500×.98×25=36,750 individuals offered PrEP in the population, and one at 27 NNT would result in about 39,690 individuals offered PrEP. In this case, an NNT difference of merely 2 points results in 3,000 more individuals offered PrEP.
4.3.3 Interpretation
From this data analysis, we saw that, at least for rare outcome applications, principled individual-based strategies were generally more sensitive and less costly (for a given sensitivity level) than strategies based on pre-specified demographic subgroups. Com-posite subgroup-based strategies that uses several predictor strata yielded large gains in sensitivity and capacity savings. However, such approaches remained more costly (i.e. required higher NNT for a given sensitivity) than an approach that used the proposed constrained RPP Super Learner to build a flexible individual based targeting strategy. In short, in this application at least, the use of a state-of the art machine learning ap-proach (Super Learner) that employs an optimality criteria specifically aligned with the implementation objective of optimizing efficient and effective roll outs, can result in substantial performance improvements.
5
Summary
In this article, we proposed a general group of Super Learner-based binary classifiers that optimizes performance-constrained criteria. As an illustration, we developed and evaluated a hypothetical HIV prevention strategy that uses a Super Learner-based bi-nary classifier to offer PrEP at an individual basis, with the goal of minimizing the number of PrEP offerings while achieving the minimum required sensitivity.
Super Learner is an ensemble machine learning algorithm that combines its con-stituent algorithms linearly using weights that minimize a cross-validated user-supplied objective function. We considered as specific implementations a classifier that mini-mizes the rate of positive predictions subject to a lower bound requirement on the sensitivity, and a classifier that maximizes the sensitivity subject to an upper bound requirement on the rate of positive predictions. To construct the proposed classifiers, we first expressed the constrained optimization problem as the minimization of a con-strained objective function. Then, we obtained a Super Learner-based risk predictor with weights minimizing the cross-validated version of said function; the risk thresh-old of the corresponding binary classifier is one that satisfies the cross-validated version of the constraint.
In our targeted PrEP example, we used baseline data from the SEARCH study and trained the classifiers to predict baseline (prevalence) HIV status using individual-level demographics and other risk factor variables collected at baseline. The perfor-mance of this and other standard subgroup-based classifiers were assessed in terms of sensitivity and NNT. These measures were obtained under a 10-fold sample-split evaluation scheme, wherein the classifiers were trained in the learning set, and their sensitivity and NNT were evaluated based on their performance in classifying the eval-uation set. Averaging these performance measures across the 10 folds, we obtained a cross-validated sensitivity and NNT of each strategy. We conducted 10 repetitions of such 10-fold sample split evaluation to obtain as our final performance assessment an average cross-validated sensitivity and NNT for each classifier. For this application, we believe this empirical performance assessment to be a more pragmatic evaluation scheme than the standard area under the ROC curve, as deriving an appropriate thresh-old is part of the classifier development. In the results of this data analysis, we saw that Super Learner-based classifiers are generally more sensitive and less costly than subgroup-based strategies. But a Super Learner-based classifier that targets the desired constrained RPP may outperform (in terms of the desired capacity savings optimiza-tion), or at least perform as well as, a Super Learner-based classifier that targets the log-likelihood loss. In summary, such individualized classifiers targeting the desired optimality criterion offer great promise to applications with rare outcome within a het-erogeneous population in which the desired strategy must balance complex logistics and scientific needs that may not be fully captured by standard loss functions.
In addition to using the empirical objective and constraint metrics described here as an evaluation scheme, we could also adopt an inferential approach, in which the oracle cross-validated sensitivity-constrained RPP (7) of a risk predictor algorithmΨ
is considered a (data-adaptive) target parameter of interest (see [29] on data-adaptive target parameters). One can use a non-parametric MLE estimator (6) for this target parameter, and use bootstrap to obtain a confidence interval. However, bootstrap
pro-cedures may be prohibitively time-consuming when using machine learning algorithms on large datasets. Alternatively, we note that conditional on a trained predictor, this tar-get parameter is path-wise differentiable and thus its efficient influence curve can be derived, providing basis for influence curve-based confidence intervals. This approach has been proposed in [30] with the area under the ROC as performance metric and target parameter. Besides the nonparametric MLE estimator, for finite sample gain, we can also use Targeted Maximum Likelihood Estimator [31] or its cross-validated version [32] to estimate this target parameter. The latter may help reduce second order terms in the linear expansion as the target parameter is not linear inP0. This research
topic is currently under development and will be presented in a separate work.
Acknowledgements
This work was partially supported by NIH 5 R01 AI074345-08, NIH, PEPFAR.
References
[1] World Health Organization. Consolidated guidelines on the use of antiretroviral drugs for treating and preventing hiv infection.Technical Report, World Health Organization June 2016.
[2] World Health Organization. Guideline on when to start antiretroviral therapy and on pre-exposure prophylaxis for hiv.Guideline, World Health Organization, http://www.who.int/hiv/pub/guidelines/earlyrelease-arv/en/ September 2015. [3] van der Laan M, Polley E, Hubbard A. Super learner.Statistical Applications in
Genetics and Molecular Biology2007;6(25).
[4] van der Laan M, Dudoit S. Unified cross-validation methodology for selection among estimators and a general cross-validated adaptive epsilon-net estimator: Finite sample oracle inequalities and examples.Technical report, Division of Bio-statistics, University of California, Berkeley November 2003.
[5] Dudoit S, van der Laan M. Asymptotics of cross-validated risk estimation in estimator selection and performance assessment.Statistical Methodology2005; 2(2):131–154.
[6] van der Vaart A, Dudoit S, van der Laan M. Oracle inequalities for multi-fold cross-validation.Statistics and Decisions2006;24(3):351–371.
[7] Neyman J, Pearson E. On the problem of the most efficient tests of statistical hypothesis.Phil. Trans. Royal Soc. A1933;231(9):289–337.
[8] Bradley A. The use of the area under the roc curve in the evaluation of machine learning algorithms.Pattern Recognition1997;30:1145–1159.
[9] Bounsiar A, Beauseroy P, Grall-Maes E. General solution and learning method for binary classification with performance constraints. Pattern Recognition Letters
[10] Cannon A, Howse J, Hush D, Scovel C. Learning with the neyman-pearson and min-max criteria.Technical Report, LA-UR-02-2951 2002.
[11] Scott C, Nowak R. A neyman-pearson approach to statistical learning. IEEE
Transactions on Information Theory2005;51:3806–3819.
[12] Rigollet P, Tong X. Neyman-pearson classification, convexity and stochastic con-straints.Journal of Machine Learning Research2011;12:2831–2855.
[13] Liu T, Hogan JW, Wang L, Zhang S, Kantor R. Optimal allocation of gold standard testing under constrained availability: application to assessment of hiv treatment failure. Journal of the American Statistical Association 2013; 108(504):1173–1188.
[14] Petersen ML, LeDell E, Schwab J, Sarovar V, Gross R, Reynolds N, Haberer JE, Goggin K, Golin C, Arnsten J,et al.. Super learner analysis of electronic adher-ence data improves viral prediction and may provide strategies for selective hiv rna monitoring.Journal of acquired immune deficiency syndromes (1999)2015; 69(1):109–118.
[15] Polley E, LeDell E, van der Laan M. Package ’SuperLearner’ 2016. URL https://cran.r-project.org/web/packages/SuperLearner/ SuperLearner.pdf.
[16] LeDell E, van der Laan MJ, Peterson M. Auc-maximizing ensembles through metalearning.The international journal of biostatistics2016;12(1):203–218. [17] van der Laan M, Rose S.Targeted Learning: Causal Inference for Observational
and Experimental Data. First edn., Springer Series in Statistics, Springer, 2011. [18] LeDell E. Package ’casecontrolsl’ 2014. URLhttp://www.stat.berkeley.
edu/~ledell/R/casecontrolSL.pdf.
[19] Chamie G, Clark TD, Kabami J, Kadede K, Ssemmondo E, Steinfeld R, Lavoy G, Kwarisiima D, Sang N, Jain V,et al.. A hybrid mobile approach for population-wide hiv testing in rural east africa: an observational study.The Lancet HIV2016; 3(3):e111–e119.
[20] Chamie G, Kwarisiima D, Clark TD, Kabami J, Jain V, Geng E, Balzer LB, Pe-tersen ML, Thirumurthy H, Charlebois ED,et al.. Uptake of community-based hiv testing during a multi-disease health campaign in rural uganda.PLoS One
2014;9(1):e84 317.
[21] Kroenke K, Spitzer RL, Williams JB. The patient health questionnaire-2: validity of a two-item depression screener.Medical care2003;41(11):1284–1292. [22] Kroenke K, Spitzer R, Williams J, et al. The 2-item generalized anxiety disorder
scale had high sensitivity and specificity for detecting gad in primary care. J.
[23] Tibshirani R. Regression shrinkage and selection via the lasso. Journal of the
Royal Statistical Society. Series B (Methodological)1996; :267–288.
[24] Hastie T, Tibshirani R. Generalized additive models.Statistical science 1986; :297–310.
[25] Hastie TJ, Tibshirani RJ.Generalized additive models, vol. 43. CRC Press, 1990. [26] Breiman L. Random forests.Machine learning2001;45(1):5–32.
[27] Gelman A, Jakulin A, Pittau M, Su YS. A weakly informative default prior distri-bution for logistic and other regression models.Annals of Applied Statistics2009; 2(3):1360–1383.
[28] Breiman L, Friedman J, Olshen R, Stone C.Classification and regression trees. The Wadsworth statistics/probability series, Wadsworth International Group, 1984.
[29] Hubbard AE, Kherad-Pajouh S, van der Laan MJ. Statistical inference for data adaptive target parameters.The international journal of biostatistics2016; 12(1):3–19.
[30] LeDell E, Petersen M, van der Laan M. Computationally efficient confidence in-tervals for cross-validated area under the roc curve estimates.Electronic journal of statistics2015;9(1):1583.
[31] van der Laan M, Rubin D. Targeted maximum likelihood learning.The Interna-tional Journal of Biostatistics2006;2(1):1–40.
[32] Zheng W, van der Laan M. Asymptotic theory for cross-validated targeted maxi-mum likelihood estimation.Technical report 273, Division of Biostatistics, Uni-versity of California, Berkeley November 2010. URLhttp://www.bepress. com/ucbbiostat/paper273.
Table 1: Baseline HIV status by baseline variables. For a subgroup-based strat-egy defined by a stratum, we assess a) the average cross-validated true positive rate (aCV-sensitivity), and b) the average cross-validated number needed to treat (aCV-NNT)
negative positive total aCV-sensitivity aCV-NNT Pop’n total 43,269 1,493 44,762 1 30 Gender male 19,646 527 20,173 0.350 39.19 female 23,623 966 24,589 0.650 26.07 Age group 15-19 10,154 57 10,211 0.040 209.55 20-29 12,066 280 12,346 0.190 45.91 30-39 7,485 452 7,937 0.300 18,30 40-49 5,453 415 5,868 0.280 14.86 50-59 3,592 199 3,791 0.130 20.43 60 or older 4,519 90 4,609 0.060 59.63 Marital Status no answer 183 6 189 0.00 NA single 12,694 117 12,811 0.080 117.81 married 25,763 958 26,721 0.640 28.44 widowed 2,582 219 2,801 0.150 13.77 divorced 380 44 424 0.030 12.38 separated 1,667 149 1,816 0.100 13.67 Polygamy no answer 17510 536 18,046 0.360 34.65 no 19,468 647 20,115 0.430 31.89 yes 6,291 310 6,601 0.210 22.35 Occupation No answer 188 6 194 0 NA farm 26,290 1,107 27,397 0.740 25.33 fish 87 10 97 0.010 5.79 food/tourism 295 41 336 0.030 10.13 household worker 1,355 46 1,401 0.030 38.58 industrial 577 22 599 0.02 27.87 market/shopkeeper 1,132 55 1,187 0.040 26.36 no job/other 2,124 78 2,202 0.050 33.15 public sector 520 35 555 0.020 18.87 student 9,503 29 9,532 0.020 427.67 teacher/clerk 794 38 832 0.030 25.87 transport 404 26 430 0.020 20.98 Education No School 6,562 276 6,838 0.180 25.80 Primary 25,730 885 26,615 0.590 30.69 Secondary 10,977 332 11,309 0.220 35.38 Stable Resident not stable 1,660 39 1,699 0.030 54.16 stable 41,609 1,454 43,063 0.970 30.13 Contraception Use
no answer 8,638 143 8,781 0.100 67 no 27,113 914 28,027 0.610 31.28 yes 7,518 436 7,954 0.290 19 Drink Alcohol no answer 52 0 52 0 NA no 36,064 1,116 37,180 0.750 33.84 yes 7,153 377 7,530 0.250 20.83 Binge drink no answer 36,116 1,116 37,232 0.750 33.88 never 4,717 263 4,980 0.180 19.95 less than monthly 800 41 841 0.030 26.56 monthly 632 27 659 0.020 27.34 weekly 586 23 609 0.020 27.85 daily 418 23 441 0.020 21.52 Days in a month drinking no answer 36,116 1,116 37,232 0.750 33.88 0-3 1,906 83 1,989 0.060 28.14 4-7 1,200 55 1,255 0.040 30.22 8-11 669 45 714 0.030 20.13 12-15 629 45 674 0.030 19.05 16-19 202 7 209 0.010 9.40 20-23 513 26 539 0.020 24.19 24 or more 2,034 116 2,150 0.080 21.25 Number of drinks in a day no answer 36,116 1,116 37,232 0.750 33.88 1 2,789 158 2,947 0.110 20.25 2 2,365 115 2,480 0.080 23.95 3 1,114 66 1,180 0.040 22.22 4 442 15 457 0.010 23.53 5 or more 443 23 466 0.020 22.77 Days worked in past month no answer 71 1 72 0 NA 0-12 6,873 163 7,036 0.110 45.90 13-19 3,055 95 3,150 0.060 36.67 20-23 8,049 246 8,295 0.160 35.45 24-27 17,316 645 17,961 0.430 28.56 28 or more 7,905 343 8,248 0.230 25.08 Hours/Day worked in past week no answer 73 1 74 0 NA 0-4 15,440 493 15,933 0.330 33.15 5-7 12,774 460 13,234 0.310 29.53 8-10 8,788 297 9,085 0.200 31.98 11 or more 6,194 242 6,436 0.160 27.88 PHQ-2 score no answer 6,523 30 6,553 0.020 260.64
0 13,289 422 13,711 0.280 33.39 1 6,681 280 6,961 0.190 25.95 2 11,582 510 12,092 0.340 24.46 3 2,082 102 2,184 0.070 24.55 4 1,962 85 2,047 0.060 27.85 5 274 13 287 0.010 15.30 6 876 51 927 0.030 23.86 GAD-2 score no answer 6,525 30 6,555 0.020 260.76 0 14,727 478 15,205 0.320 32.65 1 5,792 245 6,037 0.160 25.95 2 10,788 487 11,275 0.330 23.86 3 1,870 85 1,955 0.060 26.12 4 2,269 98 2,367 0.070 27.38 5 411 18 429 0.010 23.52 6 887 52 939 0.030 21.52 Composite group woman or married or farming 36864 1457 38321 0.976 26.86
Figure 1: Empirical performance of a Super Learner classifier that minimizes RPP under the nominal constraint of achieiving at least 80% sensitivity. Performance measures are given by average cross-validated sensitivity, and average cross-validated number needed to treat (NNT).
●1 2 3 4 5 6 17.6 17.7 17.8 17.9 0.80 0.81
average cross−validated sensivity
a v er age cross−v alidated NNT model.legend ● 1 demo 2 demo.mobility 3 demo.repro 4 demo.drink 5 demo.depress 6 demo.work
Super Learner−based targeted PrEP.
Super Learner classifier: minimize sensitivity−constrained RPP threshold to achieve at least 80% sensitivity
Figure 2: Empirical performance of a Super Learner predictor that minimizes the minus log-likelihood, coupled with a cross-validated 80% sensitivity threshold. Performance measures are given by average cross-validated sensitivity, and average cross-validated number needed to treat (NNT).
Standard loglikelihood minimizng SL predictor\ with 90% sensitivity threshold
●1 2 3 4 5 6 18.5 19.0 19.5 20.0 20.5 21.0 21.5 22.0 22.5 23.0 23.5 24.0 24.5 25.0 25.5 26.0 26.5 27.0 27.5 28.0 28.5 29.0 0.820.830.840.850.860.870.880.890.900.910.920.930.940.950.960.970.98 average cross−validated sensivity
a v er age cross−v alidated NNT model.legend ● 1 demo 2 demo.mobility 3 demo.repro 4 demo.drink 5 demo.depress 6 demo.work
Super Learner−based targeted PrEP. Super Learner classifier: minimize loglikelihood
Figure 3: Empirical performance of a Super Learner classifier that minimizes RPP under the nominal constraint of achieiving at least 98% sensitivity. Performance measures are given by average cross-validated sensitivity, and average cross-validated number needed to treat (NNT).
●1 2 3 4 5 6 24.7 24.8 24.9 25.0 0.98 0.99
average cross−validated sensivity
a v er age cross−v alidated NNT model.legend ● 1 demo 2 demo.mobility 3 demo.repro 4 demo.drink 5 demo.depress 6 demo.work
Super Learner−based targeted PrEP.
Super Learner classifier: minimize sensitivity−constrained RPP threshold to achieve at least 98% sensitivity