A Structural Equation Model (SEM) for
Pharmacist Competencies in Improving Quality of
Life of Cancer Patients: Effect of Missing Values
on the SEM
Rieko Takehira1, Keiko Murakami2, Sirou Katayama2, Kenji Nishizawa3, Shigeo Yamamura1
1
Faculty of Pharmaceutical Sciences, Josai International University, Chiba, Japan; 2Department of Pharmacy, Nippon Medical Uni-versity Hospital, Tokyo, Japan; 3Department of Pharmacy, Omori Medical Center, Toho University, Tokyo, Japan.
Email: [email protected]
Received April 1st, 2011; revised May 20th, 2011; accepted June 22nd, 2011.
ABSTRACT
Objective: With the goal of improving health-related quality of life (HRQOL) in cancer patients, we previously reported a structural equation model (SEM) of subjected QOL and qualifications of pharmacists, based on a series of question-naires completed by patients and pharmacists. However, several patients and pharmacists were excluded from the pre-vious study because it was not always possible to obtain all the data intended for collection. In order to reveal the effect of missing data on the SEM, we established SEMs of HRQOL and the competency of pharmacists, using correlation matrices derived by two different statistical methods for handling missing data. Method: Fifteen cancer patients hospi-talized for cancer and were receiving opioid analgesics for pain control, and eight pharmacists were enrolled in this study. Each subject was asked four times weekly to answer questions presented in a questionnaire. SEMs were explored using two correlation matrices derived with pair-wise deletion (PD matrix) and list-wise deletion (LD matrix). The final models were statistically evaluated with certain goodness-of-fit criteria. Results: Data were intended to be collected four times weekly for each patient, but there were some missing values. The same SEMs for HRQOL were optimized using both the LD and PD matrices. Although the path diagrams of the SEMs were not identical in the “competency of pharmacists,” the two models suggested that a higher competency of a pharmacist lowered the “severity” of condition and increased the “comfort” of patients, resulting in an increase in the subjected QOL. Conclusions: In collecting data for clinical research, missing values are unavoidable. When the structure of the model was robust enough, the missing data had a minor effect on our SEM of QOL. In QOL research, the LD matrix as well as the PD matrix would be effec-tive, provided the model is sufficiently robust.
Keywords: QOL, Cancer Patients, Structural Equation Model, Pharmacists, Missing Data
1.
Introduction
Pharmaceutical care is defined as the responsible provi- sion of drug therapy for achieving specific outcomes that improve a patient’s quality of life (QOL) [1]. Typically, this improved QOL would be achieved in collaboration with other healthcare professionals. Intervention of pharmacists in patient care has been reported to improve patients’ QOL in various diseases [2,3]. Gilbar reported that pharmacists play an important role in executing ap- propriate patient care in palliative care settings [4]. Can- cer patients tend to experience increasing pain with pro-
gressing stages of the cancer. Opioid preparations have been used to relieve the pain of cancer patients, accord- ing to the three-step analgesic ladder established by the WHO [5]. Relief from pain together with the manage- ment of adverse events with analgesics is essential in palliative care for cancer patients. By minimizing suffer- ing with drug therapy, health-related QOL (HRQOL) of patients can be improved.
per [6]. Religious spirituality should also be considered as an important element for terminally ill patients [7]. Accordingly, to enhance patient care, it is important to take into account the improvements in patients’ HRQOL and evaluations of subjected QOL by patients. There are some tools to evaluate patients’ QOL or HRQOL, in- cluding SF-36, FLIC, and FACT [8-11]. A support team assessment schedule (STAS) for evaluating the relevance between patients’ objective outcome and support team assessment in a palliative care setting is also reported. [12,13] Even with these tools, it is difficult to model the causal relationship between patients’ HRQOL and the intervention of pharmacists in patients’ care.
A SEM is known to model the direct and indirect rela- tionships among the latent variables and is used to quan- tify explained and unexplained variance [14,15]. Because SEM can deal with the abstraction of psychological ef-fects as latent variables, it has been applied to measure the HRQOL of patients in nursing care [16-18].
For various reasons related to patient care, investiga- tors are not always successful in obtaining all the in- tended data in a clinical study. Although “missing data” can cause difficulties for statistical analysis, it is often unavoidable in a clinical setting. Shimozuma reported that issues based on missing data tend to increase when researching QOL in progressive cancer patients [19].
In our previous report, we established a SEM of sub- jected QOL in cancer patients, wherein we accounted for the competency of pharmacists using a matrix derived with list-wise deletion (LD matrix) [20]. However, in that report, only completed forms containing all the va- lues collected from patients and pharmacists were used in the analysis, and all incomplete forms containing mis- sing values were excluded. In QOL research in cancer patients, missing values were unavoidable in some cases, depending on the condition of the patient. In the present report, we established SEMs using the LD matrix and a matrix derived with pair-wise deletion (PD matrix), a method designed to handle missing data. We investigated the effect of missing data on the SEM of HRQOL of cancer patients and competency of pharmacists to im- prove patients’ QOL.
2.
Methods
2.1.Participants
[image:2.595.310.539.108.307.2]Patients: Eighteen cancer patients hospitalized in Nippon Medical University Hospital (Sendagi, Tokyo Japan) were included in this study. All patients received opioid analgesics for pain control and appropriate care with a pain control team organized by physicians, pharmacists, and nurses in the hospital. Patients who started chemo-
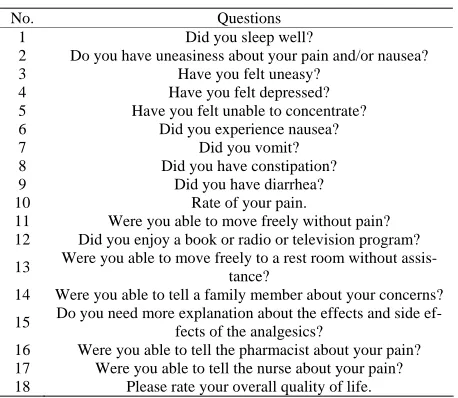
Table 1. Questionnaire for patients.
No. Questions
1 Did you sleep well?
2 Do you have uneasiness about your pain and/or nausea?
3 Have you felt uneasy?
4 Have you felt depressed?
5 Have you felt unable to concentrate?
6 Did you experience nausea?
7 Did you vomit?
8 Did you have constipation?
9 Did you have diarrhea?
10 Rate of your pain.
11 Were you able to move freely without pain?
12 Did you enjoy a book or radio or television program?
13 Were you able to move freely to a rest room without assis-tance?
14 Were you able to tell a family member about your concerns?
15 Do you need more explanation about the effects and side ef-fects of the analgesics?
16 Were you able to tell the pharmacist about your pain? 17 Were you able to tell the nurse about your pain?
18 Please rate your overall quality of life.
Q1 - Q5, EWB; Q6 - Q10, PWB; Q11 - Q13, FWB; Q14, SWB. Q15 - Q18 was to explore the relationship among patients and other health profession-als. Answers were scores ranging in 1 to 5 except for Q10. Answers of Q10 were rated on a score ranging from 0 to 10. (Adapted from Yamamura, et al. (20))
therapy during this research or who did not complete the answer form due to severe illness were excluded. After obtaining their consent for participation, fifteen patients were enrolled in this study. A questionnaire designed to assess the HRQOL of patients consisted of four impor- tant domains: EWB, FWB, SWB, and PWB. The number of questions in the questionnaire was limited to eighteen in order to avoid unnecessary burden on the patients, as suggested by a local research committee.
Pharmacists: Eight pharmacists providing pharmaceu- tical care in a pain control team were included in this study. Many of them had experience in pain management as members of the pain control team in the hospital. Pharmacists scored patients’ status simply, and not in a structured manner, by answering seven questions based on bedside interviews with the patients.
The study design and questionnaires were reviewed by a local research committee. The background of patients and questionnaires to patients and pharmacists are the same as described in our previous paper [20]. Question- naires to patients and pharmacists are listed in Tables 1
and 2. Patients and pharmacists were asked four times weekly to answer the questionnaire.
2.2.Covariance Matrix for SEM Analysis
Table 2. Questionnaire for pharmacists.
No. Questions 1 Do you think that the patient understands the medication?
2 Do you think that the patient could communicate about his or her pain with the physician?
3 Do you think that the patient could communicate about his or her pain with the nurse?
4 Do you think that you can grasp the patient’s pain? 5 How would you rate the overall QOL of the patient? 6 How would you rate the pain scale of the patient? 7 How much experience do you have in pain control?
Answers were noted as scores ranging from 1 to 5, except for Q6. Answers to Q6 were rated on a score ranging from 0 to 10. (Adapted from Yamamura, et al. (20))
and pharmacist) answers was forty and the remaining twenty answers were removed to build the covariance coefficient matrix. This handling of missing data is known as list-wise deletion (a covariate matrix derived with list-wise deletion is called an LD matrix) [15]. An entire record is excluded from an analysis if a single value is missing. The other method for handing missing data is known as a pair-wise deletion. All answers are included and each covariance between variables is com- puted solely on the basis of available pairs of observa- tions (a covariate matrix derived with pair-wise deletion is called a PD matrix). SEM using the PD matrix is con- sidered suitable for confirmatory analysis and unsuitable for exploratory analysis.
2.3.Structural Equation Modeling (SEM)
SEM is a comprehensive statistical approach to test hy- potheses about the relation among latent and/or observed variables. Possible models including latent and observed variables were built with AMOS 18J (SPSS Japan, To- kyo, Japan). We developed a possible model using the following criteria: 1) The model could be reasonably explained, and 2) The fitting between the model and the data could be evaluated statistically by certain goodness- of-fit (GOF) parameters: goodness-of-fit index (GFI) or adjusted goodness of fit index (AGFI) of 0.90 or greater, comparative goodness-of-fit index (CFI) of 0.90 or grea- ter, and root-mean square error of the approximation (RMSEA) less than 0.05 [15]. Akaike’s information cri- terion (AIC), a measure of GOF criteria adjusting for the number of estimated parameters, was also used to evalu- ate GOF. Owing to the use of different sample sizes for computing covariance terms in the model with the PD matrix, AIC would not be a good GOF criteria, but it was indicated for reference. Robustness of the model was investigated by a leave-one-out cross validation (LOOV). In the LOOV procedure, the model was established using covariance matrices derived from the data sets after re- moval of 1 observation, and this procedure was repeated
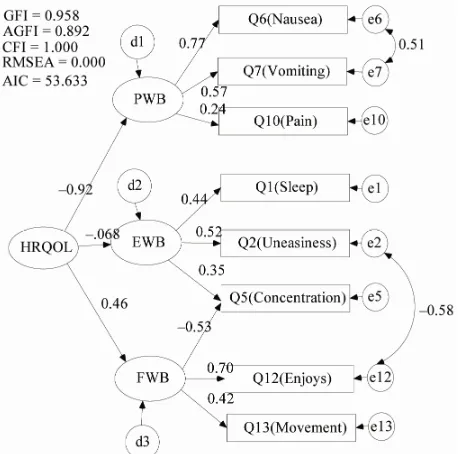
Figure 1. SEM for HRQOL of cancer patients optimized with the PD matrix EWB, emotional well-being; FWB, functional well-being and PWB, physical well-being.
for the number of data.
3.
Results and Discussion
3.1.SEMs for HRQOL
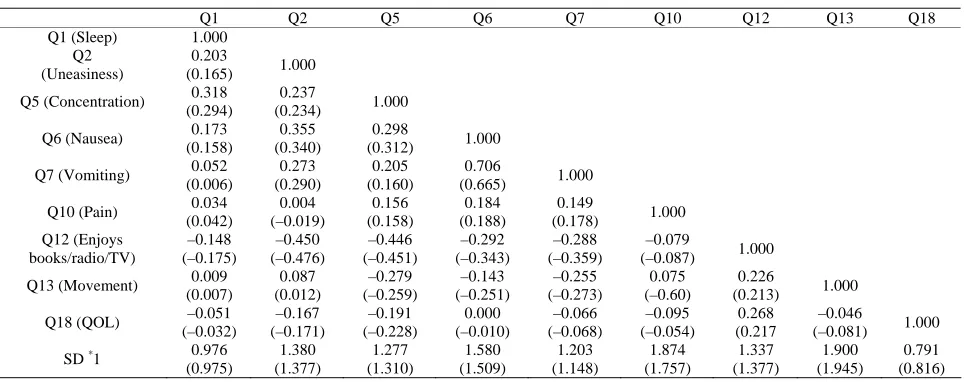
Table 3 shows the covariance coefficients derived with PD and LD. The effect of missing data was minimal, depending on the handling of the missing data. Figure 1
Table 3. Covariance matrix for HRQOL derived with pairwise deletion and listwise deletion.
Q1 Q2 Q5 Q6 Q7 Q10 Q12 Q13 Q18
Q1 (Sleep) 1.000
Q2 (Uneasiness)
0.203
(0.165) 1.000
Q5 (Concentration) 0.318
(0.294)
0.237
(0.234) 1.000
Q6 (Nausea) 0.173
(0.158)
0.355 (0.340)
0.298
(0.312) 1.000
Q7 (Vomiting) 0.052
(0.006) 0.273 (0.290) 0.205 (0.160) 0.706
(0.665) 1.000
Q10 (Pain) 0.034
(0.042) 0.004 (–0.019) 0.156 (0.158) 0.184 (0.188) 0.149
(0.178) 1.000
Q12 (Enjoys books/radio/TV) –0.148 (–0.175) –0.450 (–0.476) –0.446 (–0.451) –0.292 (–0.343) –0.288 (–0.359) –0.079
(–0.087) 1.000
Q13 (Movement) 0.009
(0.007) 0.087 (0.012) –0.279 (–0.259) –0.143 (–0.251) –0.255 (–0.273) 0.075 (–0.60) 0.226
(0.213) 1.000
Q18 (QOL) –0.051
(–0.032) –0.167 (–0.171) –0.191 (–0.228) 0.000 (–0.010) –0.066 (–0.068) –0.095 (–0.054) 0.268 (0.217 –0.046 (–0.081) 1.000
SD *1 0.976
(0.975) 1.380 (1.377) 1.277 (1.310) 1.580 (1.509) 1.203 (1.148) 1.874 (1.757) 1.337 (1.377) 1.900 (1.945) 0.791 (0.816) *
[image:4.595.56.543.337.512.2]1 SD is the standard deviation of answers to each question. Please refer to questions in Table 1.
Table 4. Standardized estimates of SEM for HRQOL with PD and LD matrices.
PD LD
Cross-validation Standardized regression weights
Estimate
Mean SD Estimate
PWB <--- HRQOL –0.916 –0.896 0.061 –0.808
EWB <--- HRQOL –0.684 –0.685 0.040 –0.791
FWB <--- HRQOL 0.459 0.462 0.059 0.686
Q6 (Nausea) <--- PWB 0.773 0.782 0.066 0.838
Q7 (Vomiting) <--- PWB 0.566 0.568 0.059 0.630
Q10 (Pain) <--- PWB 0.239 0.237 0.018 0.231
Q1 (Sleep) <--- EWB 0.436 0.441 0.034 0.361
Q2 (Uneasiness) <--- EWB 0.519 0.516 0.049 0.523
Q5 (Concentration) <--- EWB 0.355 0.362 0.048 0.209
Q5 (Concentration) <--- FWB –0.532 –0.530 0.034 –0.520
Q12 (Enjoys book/radio/TV) <--- FWB 0.703 0.703 0.030 0.712
Q13 (Movement) <--- FWB 0.420 0.419 0.022 0.385
PD: Pair-wise deletion, LD: List-wise deletion. Estimates were calculated from the optimized SEM. The values of cross-validation were obtained by the leave- one-out cross-validation.
lows: the data from the patients who did not answer the questions due to the severity of illness were not included in the LD matrix. The relationship between HRQOL to PWB consisting of the scores of nausea, vomiting, and pain, would be strong in the PD matrix. Therefore, the regression weight from HRQOL to PWB in the LD ma-trix would become larger than that in the PD mama-trix. According to be strength of the relation between HRQOL to PWB, regression weights between HRQOL to EWB and QOL to FWB would be relatively smaller. The SD of estimates evaluated by LOOV was reasonably narrow, suggesting that the optimized SEM was robust and not affected strongly by outlier(s).
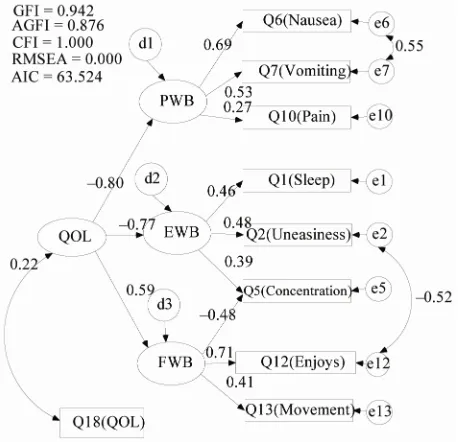
Figure 2 shows the model indicating the relationship
between the HRQOL modeled with PD matrix and sub- jected QOL (Q18 QOL in Figure 2) answered by the patients. The GOF criteria of the model were calculated to be GFI = 0.942, AGFI = 0.876, CFI = 1.000, RMSEA = 0.000, and AIC = 63.524. The correlation coefficient between HRQOL and subjected QOL was poor, calcu- lated to be 0.22. The correlation coefficient in the model with LD matrix was also poor, calculated to be 0.23 [20]. These results suggest that a meaningful part of subjected QOL in patients is influenced by other elements not in- cluded in the model. Table 5 summarizes the standard- ized regression weights between variables. Similar to
Table 4, the regression weight from HRQOL to PWB in he model with PD matrix was larger than that with LD t
Table 5. Standardized estimates of SEM for Competencies optimized with PD and LD matrices.
PD LD
Cross-validation Estimate
Standardized regression weights
Estimate
Mean SD
PWB <--- HRQOL –0.799 –0.794 0.062 –0.727
EWB <--- HRQOL –0.772 –0.767 0.049 –0.845
FWB <--- HRQOL 0.589 0.591 0.068 0.799
Q6 (Nausea) <--- PWB 0.686 0.694 0.074 0.761
Q7 (Vomiting) <--- PWB 0.532 0.539 0.050 0.600
Q10 (Pain) <--- PWB 0.270 0.269 0.039 0.255
Q1 (Sleep) <--- EWB 0.459 0.458 0.029 0.380
Q2 (Uneasiness) <--- EWB 0.475 0.478 0.041 0.479
Q5 (Concentration) <--- EWB 0.389 0.388 0.039 0.274
Q5 (Concentration) <--- FWB –0.483 –0.481 0.041 –0.471
Q12 (Enjoys book/radio/TV) <--- FWB 0.708 0.711 0.027 0.714
Q13 (Movement) <--- FWB 0.406 0.405 0.025 0.360
[image:5.595.58.287.319.540.2]PD: Pair-wise deletion, LD: List-wise deletion. Estimates were calculated from the optimized SEM. The values of cross-validation were obtained by the leave- one-out cross-validation.
Figure 2. SEM of correlation between HRQOL and sub-jected QOL in patients optimized with the PD matrix EWB, emotional well-being; FWB, functional well-being and PWB, physical well-being.
matrix, resulting in similar effects described before. The SD of the estimates evaluated by LOOV was reasonably narrow suggesting that the optimized SEM was not af-fected strongly by outlier(s). These results indicate that the HRQOL model with a path diagram described in
Figures 1 and 2 would be robust enough against missing values and outliers. The SEM analysis with both LD and PD matrices would have advantages with regard to the effect of missing data.
3.2.SEM of Pharmacist Competency in Improving QOL of Patients
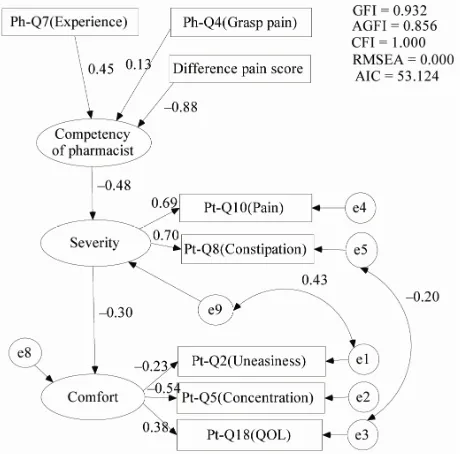
We previously reported the SEM for the competency of pharmacists to improve subjected QOL of patients [20]. The model consisted of four latent variables, expressing “ability of pharmacists,” “skill of assessment” of pain level in patients, “severity” of side effect and “comfort” level, respectively. The model suggested that the compe- tency of pharmacists can improve subjected QOL in cancer patients. Table 6 shows the covariance coeffi- cients used for SEM analysis of competency of pharma- cists to improve patients’ subjected QOL calculated with the PD and LD. Some coefficients were found to be af-fected by missing data, in contrast to the model of HRQOL. To establish the SEM, we introduced another parameter, i.e., the absolute value of difference of pain scores answered by patients and evaluated by pharma- cists. This variable would indicate the pharmacists’ com- petency to understand the patients’ condition. A smaller value for this variable would indicate the pharmacist’s ability to evaluate the patients’ pain more accurately. The optimized model established with the PD matrix is shown in Figure 3, and GOF criteria of the model were almost satisfactory: GFI = 0.932, AGFI = 0.856, CFI = 1.000, RMSEA = 0.000 and AIC = 63.124.
The final model consists of three latent variables, ex-pressing “competency of pharmacists,” “severity” of side effect, and “comfort” level. From the magnitude of esti- mates of standardized weight between variables, the model can be explained as follows: when pharmacists are highly competency to assess patients’ pain level based on experiences from previous association with a pain con- rol team, they can work to restrain unpleasant symptoms t
Table 6. Covariance matrix for competency of pharmacists derived by Pair-wise deletion and List-wise deletion.
Pt-Q2 Pt-Q5 Pt-Q8 Pt-Q10 Pt-Q18 Ph-Q4 Ph-Q7 Difference
Pt-Q2 (Uneasiness) 1.000
Pt-Q5 (Concentration) 0.237
(0.234) 1.000
Pt-Q8 (Constipation) 0.299
(0.222)
0.137
(0.203) 1.000
Pt-Q10 (Pain) 0.184
(0.205)
0.099 (0.141)
0.457
(0.568) 1.000
Pt-Q18 (QOL) –0.167
(–0.171)
–0.191 (–0.228)
–0.256 (–0.354)
–0.173
(–0.137) 1.000
Ph-Q4 (Grasp pain) 0.052
(0.086)
0.047 (0.221)
–0.024 (–0.087)
0.020 (–0.060)
–0.158
(–0.090) 1.000
Ph-Q7 (Experience) 0.027
(0.019)
–0.001 (–0.028)
–0.101 (–0.158)
–0.049 (–0.006)
0.215 (0.233)
–0.212
(–0.291) 1.000
Difference Pain score *1
–0.164 (–0.116)
–0.085 (–0.104)
0.157 0.183
0.305 (0.294)
0.114 (0.202)
–0.011 (–0.107)
0.220
(0.310) 1.000
SD *2 1.380
(1.377)
1.277 1.310
1.645 1.641
1.895 1.836
0.791 (0.816)
0.592 0.526
0.298 (0.607)
1.163 (1.091)
Pt and Ph indicate the questions for patients and pharmacist, respectively. Upper and lower values were obtained with pairwise deletion and listwise deletion, respectively. *1 Difference of pain score between by Pt and Ph. *2 SD is the standard deviation of the answer to each question. Please refer to questions in
Ta-bles 1 and 2.
Figure 3. SEM of competency of pharmacists to improve subjected QOL of cancer patients optimized with the PD matrix.
such as pain and constipation. If “severity” of side ef- fects can be reduced by competency of pharmacists, “comfort” level of patients would be increased with de- creasing uneasiness and increasing of subjected QOL. Because the covariate coefficients with the PD matrix were a little different from those with the LD matrix, the optimized path diagrams were slightly different from each other. However, the most important factor of com-petency of pharmacists in improving subjected QOL of patients was to assess the pain level of patients in both
models. The models suggest that pharmacists with prior experience in a pain control team and are competent to assess patients’ pain level can restrain the unpleasant symptoms of patients. As a result, subjected QOL in pa-tients will improve.
4.
Conclusions
The models for HRQOL of cancer patients and for pharmacists’ competency to improve the subjected QOL could be established using the SEM. If there was little effect of missing values and outliers on the SEM, similar SEMs were optimized with both the LD and the PD ma- trices. When using the PD matrix, AIC was not a good criterion because the sample sizes for computing covari- ance terms were different with each other. Therefore, SEM with the PD matrix should be used for confirmatory analysis after the model has been fixed using the LD matrix. In this study, we found that if the model is suffi- ciently robust and if there is little effect of missing val- ues and outliers, the PD matrix could be also effective to establish the models for HRQOL and competency of pharmacists by SEM. The two models established with LD and PD matrices strongly suggest that competency of pharmacists can improve subjected QOL of patients.
5.
References
[image:6.595.58.288.322.549.2]doi:10.1007/s11096-008-9242-3
[3] M. Kamatari, S. Koto, N. Ozawa, C. Urao, Y. Suzuki, E. Akasaka, K. Yanagimoto and K. Sakota, “Factors Af- fecting Long-Term Compliance of Osteoporotic Patients with Bisphosphonate Treatment and QOL Assessment in Actual Practice: Alendronate and Risedronate,” Journal of Bone and Mineral Metabolism, Vol. 25, No. 5, 2007, pp. 302-309.doi:10.1007/s11096-008-9242-3
[4] P. Gilbar and K. Stefaniuk, “The Role of the Pharmacist in Palliative Care: Results of a Survey Conducted in Aus-tralia and Canada,” Indian Journal of Palliative Care, Vol. 18, No. 4, 2002, pp. 287-292.
[5] World Health Organization, “Cancer Pain Relief: With a Guide to Opioid Availability,” 2 Edition, World Health Organization, New delhi, 1996.
[6] H. Schipper, “Guidelines and Caveats for Quality of Life Measurement in Clinical Practice and Research,” Oncol-ogy, Vol. 4, No. 5, 1990, pp. 51-57.
[7] S. Kaasa and J. H. Loge, “Quality of Life in Palliative Care: Principles and Practice,” Palliative Medicine, Vol. 17, No. 1, 2003, pp. 11-20.
doi:10.1007/s11096-008-9242-3
[8] J. E. Ware Jr and C. D. Sherbourne, “The MOS 36-Item Short-Form Health Survey (SF-36). I. Conceptual Frame Work and Item Selection,” Medical Care, Vol. 30, No. 6, 1992, pp. 473-483.
doi:10.1097/00005650-199206000-00002
[9] H. Schipper, J. Clinch, A. McMurray and M. Levitt, “Measuring the Quality of Life of Cancer Patients: The Functional Living Index-Cancer: Development and Vali-dation,” Journal of Clinical Oncology, Vol. 2, No. 5, 1984, pp. 472-483.
[10] D. F. Cella, D. S. Tulsky, G. Gray, B. Sarafian, E. Linn, A. Bonomi, M. Silberman, S. B. Yellen, P. Winicour, J. Brannon, et al., “The Functional Assessment of Cancer Therapy Scale: Development and Validation of the Gen-eral Measure,” Journal of Clinical Oncology, Vol. 11, No. 3, 1993, pp. 570-579.
[11] W. L. Ward, E. A. Hahn, F. Mo, L. Hernandez, D. S. Tulsky and D. Cella, “Reliability and Validity of the Functional Assessment of Cancer Therapy-Colorectal (FACT-C) Quality of Life Instrument,” Quality of Life Research, Vol. 8, No. 3, 1999, pp. 181-195.
doi:10.1023/A:1008821826499
[12] M. G. Carson, M. I. Fitch and M. L. Vachon, “Measuring Patient Outcomes in Palliative Care: A Reliability and Validity Study of the Support Team Assessment Sche- dule,” Palliative Medicine, Vol. 14, No. 1, 2000, pp. 25-
36.doi:10.1017/S1478951504040507
[13] M. Miyashita, K. Matoba, T. Sasahara, Y. Kizawa, M. Maruguchi, M. Abe, M. Kawa and Y. Shima, “Reliability and Validity of the Japanese Version of the Support Team Assessment Schedule (STAS-J),” Palliative & Supportive Care, Vol. 2, No. 4, 2004, pp. 379-385.
doi:10.1017/S1478951504040507
[14] R. H. Hoyle (Ed), “Structural Equation Modeling: Con-cepts, Issues, and Applications,” Sage Publications, Thou-sand Oaks, California, 1995.
[15] B. M. Byrne, “Structural Equation Modeling with Amos: Basic Concepts, Applications, and Programming (Multi-variate Applications Series),” Lawrence Erlbaum Assoc Inc. Publishers, Mahwah, New Jersey, 2001.
[16] C. H. Yeh, “Health-Related Quality of Life in Pediatric Patients with Cancer. A Structural Equation Approach with the Roy Adaptation Model,” Cancer Nursing, Vol. 25, No. 1, 2002, pp. 74-80.
doi:10.1097/00002820-200202000-00013
[17] K. H. Sousa and F. F. Dhen, “A Theoretical Approach to Measuring Quality of Life,” Journal of Nursing Measure- ment, Vol. 10, No. 1, 2002, pp. 47-58.
doi:10.1891/jnum.10.1.47.52545
[18] L. B. Meuleners, A. H. Lee, C. W. Binns and A. Lower, “Quality of Life for Adolescents: Assessing Measurement Properties Using Structural Equation Modeling,” Quality of Life Research, Vol. 12, No. 3, 2003, pp. 283-290.
doi:10.1023/A:1023221913292
[19] K. Shimozuma, “Quality of Life Assessment,” Breast Cancer, Vol. 9, No. 2, 2002, pp. 100-106.
doi:10.1007/BF02967573