Food security, developing
countries and multilateral
trade rules
December 2015
A. Matthews
The State of Agricultural
Commodity Markets
2015-16
Food security, developing countries and
multilateral trade rules
Alan Matthews
Background paper prepared for
The State of Agricultural Commodity Markets 2015–16
.
The designations employed and the presentation of material in this information product do not imply the expression of any opinion whatsoever on the part of the Food and Agriculture Organization of the United Nations (FAO) concerning the legal or development status of any country, territory, city or area or of its authorities, or concerning the delimitation of its frontiers or boundaries. The mention of specific companies or products of manufacturers, whether or not these have been patented, does not imply that these have been endorsed or recommended by FAO in preference to others of a similar nature that are not mentioned.
The views expressed in this information product are those of the authors and do not necessarily reflect the views or policies of FAO.
© FAO, 2015
FAO encourages the use, reproduction and dissemination of material in this information product. Except where otherwise indicated, material may be copied, downloaded and printed for private study, research and teaching purposes, or for use in non-commercial products or services, provided that appropriate acknowledgement of FAO as the source and copyright holder is given and that FAO’s endorsement of users’ views, products or services is not implied in any way.
All requests for translation and adaptation rights, and for resale and other commercial use rights should be made via www.fao.org/contact-us/licence-request or addressed to [email protected].
FAO information products are available on the FAO website (www.fao.org/publications) and can be
Contents
Acknowledgements... iv
Executive summary ... v
1. Introduction ... 1
2. The concept of policy space ... 4
3. Multilateral rules on import protection ... 6
3.1. Description of current disciplines ... 6
3.2. Import tariffs faced by developing countries... 7
3.3. Food security and current import disciplines in developing countries ... 11
3.3.1. What policy space currently exists? ... 11
3.3.2. How has developing countries’ use of policy space changed over time? ... 17
3.3.3. Has the AoA constrained developing countries’ policy space to set import tariffs? ... 20
3.4. Food security implications of the Doha Round Rev.4 proposals ... 21
4. WTO disciplines on domestic support ... 24
4.1. Description of current disciplines ... 24
4.2. Domestic support trends in developed countries ... 27
4.3. Domestic support limits and policy space in developing countries ... 30
4.4. Doha Round proposals on domestic support ... 34
5. Multilateral trade rules and price volatility ... 35
5.1. Export subsidies and measures with equivalent effect ... 36
5.2. Import safeguards ... 37
5.2.1. Special agricultural safeguards ... 37
5.2.2. Special safeguard mechanism ... 38
5.2.3. Policy space and import safeguards ... 42
5.3. Export restrictions ... 43
6. Conclusions ... 46
Annex 1. De minimis limits when world market prices are rising ... 49
Acknowledgements
This document was commissioned as a background paper for the preparation of the 2015–16 edition
of FAO’s flagship report The State of Agricultural Commodity Markets. It was prepared by Alan
Matthews, Professor Emeritus of European Agricultural Policy in the Department of Economics at Trinity College, Dublin. Its preparation was guided by a terms of reference prepared by FAO. The paper benefited from comments by participants at a series of meetings held by FAO in the first half of 2015 to provide input into the drafting of the report.
Executive summary
The WTO Agreement on Agriculture (AoA) is frequently criticised for not taking sufficient account of the needs of developing countries to pursue policies necessary to promote their food security. This paper assesses the extent to which existing and proposed trade rules in the AoA limit the policy space that developing countries have to pursue this goal.
Policy space refers to the room for manoeuvre available to countries to implement policies or commit budget expenditures which are not limited or constrained by AoA rules. The paper examines the extent of policy space available to developing countries to pursue their food security goals under the headings of import protection, domestic support, and the ability to respond to volatile world market prices. It examines the extent to which developing countries make actual use of the policy space that they currently have, while also drawing attention to areas where some change to AoA rules could be justified.
Developing countries have very heterogeneous needs as well as commitments under WTO rules, so there are inevitably exceptions to any generalizations that are made. With respect to import protection, most but not all developing countries have considerable unused policy space. Most developing countries have higher applied tariffs on agricultural imports than developed countries, and for most developing countries applied tariffs are well below bound rates.
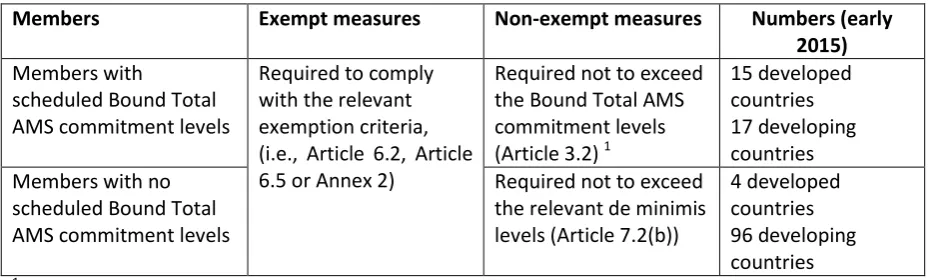
The most important elements in the AoA domestic support provisions for developing countries are the exemptions from any discipline or limitation of a broad range of policies which can play an important role in enhancing their food security. These policies include green box policies, policies in the ‘development box’, as well as other trade-distorting policies up to the limit of their aggregate measurement of support (AMS) ceiling(s). For most developing countries, their disciplined
trade-distorting support is limited to de minimis amounts under their AoA commitments. Most developing
countries report no or minimal use of such support.
However, a number of emerging economies have been increasing trade-distorting support particularly through the use of administered support prices. The interaction between the AoA formula for calculating market price support due to the use of administered prices and the much increased level of world market prices now compared to the AoA base period in the mid-1980s has highlighted the restricted policy space that developing countries have to use this policy instrument. While the current AoA rules limit the negative spillover effects of domestic policies likely to distort trade including for other developing countries, the paper argues that there is a case on both economic and equity grounds for revisiting WTO rules in this area.
Only a minority of developing countries have access to an automatic safeguard mechanism to respond to imported price or volume volatility. Developing countries have thus sought greater flexibilities in the Doha Round negotiations to use safeguards when faced with import volume surges or low world market prices. While the principle of a special safeguard mechanism for developing countries is accepted, the use of this mechanism needs to have careful limits given that stabilizing prices or volumes in one country destabilizes prices for all others.
Finally, the lack of disciplines on export restrictions on foodstuffs is part of the unfinished business of the Uruguay Round, and strengthened disciplines should be an important objective for WTO
1.
Introduction
The WTO occupies a distinct space in the emerging architecture of global food security governance. The Agreement on Agriculture (AoA) which resulted from the GATT Uruguay Round of multilateral trade negotiations is the first attempt to agree a comprehensive set of disciplines on members’ trade
policies.1 The Agreement itself recognizes that it is but the first step towards the long-term objective
of substantial progressive reductions in support and protection resulting in fundamental reform, and mandated negotiations to continue the process which began in 2000. These negotiations
subsequently became part of the Doha Round of multilateral trade negotiations launched in 2001 (WTO, 2001a).
The relationship between trade rules and food security has been a central element in these negotiations. The AoA is frequently criticised for not taking sufficient account of the needs of developing countries to pursue policies necessary to promote their food security. This paper examines the validity of this criticism. It assesses the extent to which existing and proposed rules limit the policy space that developing countries might need. It also explores the way in which AoA rules enable trade to make a positive contribution to food security, while also highlighting areas where the absence of rules, incomplete rules or inappropriate rules hinder the role that trade can play.
That trade rules impinge on food security is formally recognised in the AoA in its preamble and is explicitly mentioned in several provisions of the Agreement. The preamble notes “that commitments under the reform programme should be made in an equitable way among all members, having regard to non-trade concerns, including food security [...]”. Food security, in terms of the availability
of adequate supplies of basic foodstuffs from external sources, was an explicit basis for the Decision
on Measures Concerning the Possible Negative Effects of the Reform Programme on Net-Food-Importing Countries (also referred to as the Marrakesh Decision), which was designed to assist least developed countries (LDCs) and developing country net food importers faced with rising food prices as a result of the reform programme. Other provisions relevant to food security in the AoA include Article 10.4 which sets out the criteria for differentiation between legitimate international food aid and disguised government export subsidies; Article 12, which requires members (including
developing country net food exporters) which propose to introduce export restrictions or
prohibitions of foodstuffs to take account of their impacts on importing members’ food security and sets out a consultation process; and Annex 2, which lays out the conditions to exempt expenditure on the accumulation and holding of food stocks which form an integral part of a food security programme as well as domestic food aid programmes from counting towards a country’s allowed ceiling on trade-distorting support. Food security is also specifically addressed as part of the Doha mandate where “operationally effective special and differential treatment for developing countries is mandated to enable them to effectively take account of their development needs, including food
security and rural development” (WTO, 2001a).2
1Other WTO Agreements such as the Sanitary and Phytosanitary (SPS) Agreement, the Technical Barriers to
Trade (TBT) Agreement and the Agreement on Trade-Related Aspects of Intellectual Property Rights (TRIPS) are also relevant to the emerging governance of global food security but are not considered further in this paper. Although technically countries are members of the WTO, the two terms are used interchangeably in this report.
2Member country proposals to address food security are summarised in the WTO Secretariat backgrounder on
the agricultural negotiations,
However, there has been a continuing debate over whether the AoA disciplines and flexibilities are appropriate for developing countries seeking to promote their agricultural development and food security (Chatterjee and Murphy, 2014; Clapp, 2011; de Schutter, 2009; Díaz-Bonilla, 2014a;
Gonzalez, 2002; Elliott, 2015; Häberli, 2010; Häberli, 2012; Josling, 2015; Sharma, 2011; Smith, 2012; Tangermann, 2013). Criticisms range from arguments that the AoA rules are lop-sided and
essentially favour developed countries which can continue to heavily support their agricultural sectors, that they constrain the ability of developing countries to pursue their agricultural development and food security policies, and even that they undermine the right to food of developing countries. Critics allege that the liberalization of agricultural trade has benefited the larger, more export-oriented farmers, has led to the concentration of land and has marginalized small farmers and created unemployment and poverty. Olivier de Schutter, when UN Human Rights Council’s Special Rapporteur on the Right to Food, criticized WTO rules on the grounds that they are not compatible with “vital measures to rehabilitate local food production capacity in developing countries” such as higher tariffs, temporary import restrictions, state purchase from smallholders, active marketing boards, and targeted farm subsidies (De Schutter, 2009). Public opinion is also swayed by calls for greater ‘food sovereignty’ made by many NGOs, expressed as the right “of each nation to maintain and develop its own capacity to produce its basic foods respecting cultural and productive diversity” (Via Campesina, 1996). A common refrain is that existing WTO rules constrain food-insecure states’ policy space to improve their food security, even though many observers argue that the measures proposed would be ineffective or even counter-productive in helping countries to achieve this objective.
Another criticism is that WTO rules are no longer appropriate for the new reality of higher and more volatile food prices. According to de Schutter (2011, p. 3):
“Overproduction and declining prices dominated the agenda when States embarked on establishing a new international trade regime for agriculture during the Uruguay round of negotiations of the General Agreement on Tariffs and Trade (GATT). As a result, much of the existing WTO agricultural trade architecture, ranging from border protection, anti-dumping, and support for producers, are anchored within a framework primarily concerned with managing States’ policy response to declining agricultural prices”.
De Schutter suggests the global consensus on the need to support agricultural production in food insecure countries may well require creation of new types of food security trade-related measures and revising existing trade rules.
The difficulties that WTO members have in defining appropriate rules was underlined at the 2011 WTO Ministerial meeting which discussed food security. Two proposals were made, one calling for the removal and elimination of food export restrictions or extraordinary taxes for food purchased for non-commercial humanitarian purposes by the World Food Programme, while the other called for a ‘work programme’ on trade-related responses to mitigate the impact on food market prices and
volatility. However, a consensus could not be found for either proposal.3
In this paper, I do not discuss the normative debate about the optimal policies to pursue and improve a country’s food security. Whether more restrictive or more open trade policies lead to better food security outcomes for a developing country, and the relative merits of trade policies
3The proposals are described at
versus other measures to improve a country’s agricultural productivity and its population’s access to food, are heavily debated issues. For example, import protection which raises the price of food staples benefits farmers, at least those with a substantial market surplus, but will make access to food staples more difficult for consumers by raising their prices (for a flavour of this debate, see
McCorriston et al., 2013; OECD, 2013). For the purposes of this paper, I take an agnostic view on
these issues. The aim of the paper is specifically to examine the scope within the existing and
proposed AoA rules for countries to take the actions that they deem desirable. What is the ‘policy
space’ available to developing countries? How extensive are the measures that they are able to take, and how binding are the obligations that they have accepted in the AoA? Would the proposed changes in the AoA rules set out in the now somewhat dated Revision 4 (Rev.4) of the draft
modalities for agriculture put forward by the Chairman of the Special Session of the WTO Committee on Agriculture in 2008 (WTO, 2008b) change the policy space available to developing countries in significant ways?
However, the concept of ‘policy space’ cannot be limited to the freedom of action available to an individual country. A country’s ability to pursue its food security goals is inevitably influenced by the actions of other countries. Trade rules also have a role in creating a more supportive environment for individual countries to improve their food security by limiting the possible negative impacts and spillovers from the policy actions of other countries, and particularly those measures that distort trade. In this respect, much of the negotiating effort of developing countries in the Doha Round has sought to restrain the trade-distorting policies of developed countries. Thus, a second focus of the paper is to outline and document the trends in trade-distorting support in developed countries since the conclusion of the AoA. Have developed countries reduced their trade-distorting support over the past two decades? How do the trends compare across import tariffs, domestic support and export subsidies? What would be the impact on developed country trade-distorting support if the Rev.4 draft modalities were agreed?
Increasingly, however, this distinction between developed and developing countries is losing its relevance. Developing countries are growing in importance in international trade and the scale of their policy interventions means that, for many developing countries, the world market prices and the degree of import competition that they face is increasingly determined by other developing countries. There is thus a trade-off between increasing the flexibility that individual developing countries have to choose the policy instruments they wish to use to support their domestic agriculture and their population’s access to food, while limiting the potential for negative impacts from any trade distortions that might be induced by other developing countries making use of these same flexibilities.
developed countries (for example, Albania is treated as a developed country for its domestic support commitments).
Again, without taking a normative position on the usefulness or effectiveness of the specific policy instruments that countries might be allowed to use under WTO rules as part of their policy space, in line with the principle of special and differential treatment, it seems reasonable that developed countries should have the most constrained policy space while developing countries, and particularly LDCs, should have the greatest flexibility. The justification for this is that countries at different levels of socio-economic development have different capacities to make use of alternative policy
instruments; thus, developing countries, and particularly LDCs, with more limited capacities, should be less constrained by external disciplines in their policy choices.
For this reason, I have adopted a distinction between developed and developing countries based on socio-economic criteria rather than self-declared status in the WTO in making comparisons of available policy space in this paper (the LDC category remains defined by the UN list). The
classification used to define developed countries is the International Monetary Fund (IMF)’s list of ‘advanced economies’ for its World Economic Outlook, adapted to take into account customs
territories which are WTO members but not IMF country members.4 Countries not in the developed
country group and not on the LDC list are defined as developing countries. In some places in the paper, developing countries will be taken to mean those that have designated themselves as such in the WTO. Which definition of developing countries is used will be made clear where there is the possibility of ambiguity.
The paper is structured as follows. Section 2 elaborates on the dual nature of the policy space concept. Section 3 examines available policy space for developed and developing countries under AoA rules with respect to the use of import tariffs. Section 4 discusses the policy space developed and developing countries have to use domestic support instruments. Section 5 examines the scope that developed and developing countries have to address price volatility. Section 6 concludes.
2.
The concept of policy space
Under the AoA, WTO members accept certain obligations, differentiated by the status of the country (developed, developing, LDC) which constrain or limit their ability to use a number of policy
measures or budget expenditures, essentially those which potentially could have negative impacts on the trade of other countries (trade-distorting measures). Policy space refers to the remaining room for manoeuvre available to countries to implement policies or commit budget expenditures which are not limited or constrained by AoA rules.
The measure of the policy space available to a particular country will depend on which pillar of the AoA is under discussion. With respect to the market access pillar where the only policy measure permitted under AoA rules is the imposition of tariffs, policy space is measured by the height of a country’s bound tariffs. Countries are permitted to raise their tariffs to their bound levels but not to exceed them. In the domestic support pillar, a WTO member’s policy space is defined by its right to exempt support under some policies when calculating its Current Total Aggregate Measure of Support (CTAMS) as well as by the size of its limits on AMS support (Brink, 2015). In the case of export subsidies, a country’s policy space is defined by the limits on the quantities of subsidized
4
exports and the expenditure on export subsidies which it has committed not to exceed. Other elements of policy space refer to the rules governing the use of temporary import safeguards, export restrictions, or the rules governing food aid, government public stock-holding or domestic food assistance programmes.
Building on this definition, the following sections of the paper discuss the policy space available to developing countries under current and proposed AoA rules to pursue their food security objectives. I do not make a judgement as to whether using this policy space would be an effective or efficient way of addressing these objectives. However, it is useful to make four points at the outset.
There is a wide range of policies that countries can pursue to improve their food security
which are not disciplined or limited under WTO rules. For those policies which are disciplined because they directly affect the production decisions of farmers (e.g. market price support, trade policies, coupled direct payments, or input subsidies), one country’s policy space to make use of these policies is another country’s trade distortion. One country’s attempt to shield itself against imported price volatility and to stabilize its domestic prices has the effect of destabilizing further world market prices for all other trading countries. Discussion of the importance of policy space often ignores the fact that policy actions by one country will have negative spillover effects on other countries which can adversely affect their food security. Much of the criticism of WTO rules sees trade policy as purely a domestic policy issue, ignoring the spillover effects on other countries and their food security. The discussion of policy space cannot be limited to the freedom of action available to an individual country. It also refers to the right to be protected from the
negative effects of the policy measures adopted in other countries. If other countries heavily subsidize their exports, for example, such that world prices are depressed, this affects the ability of the first country to pursue its food security objectives in the same way as its own domestic policy measures.
WTO rules are an attempt to solve a collective action problem (Josling, 2014). Such problems
arise when countries, rationally pursuing their own self-interest, end up with an outcome which is less desirable than what could be achieved through co-operative action. Individual countries have an incentive to use trade policy to promote their own agricultural production or to stabilize their own domestic market. But the results of such actions can have negative consequences for other countries. If these countries react with offsetting measures, the final outcome can make all countries worse off. Even if in the short-run an individual country can do better by using trade policy solely as a domestic policy instrument, in the long-run such actions, particularly by the larger traders, are likely to have a cascading effect as other countries follow suit. The result is that the world market becomes an unreliable residual market with adverse consequences for all countries. Thus, one country accepting constraints on its own freedom of action in return for similar constraints on other countries’ freedom of action is not necessarily a reduction in its policy space, although the terms of the trade-off can be debated in any particular area.
Openness to trade can bring unwelcome impacts for food security, at least for specific
population sub-groups, as when import-competing sectors come under pressure from cheaper or better-quality imports, or world market price volatility is transmitted to the domestic market. However, there are invariably non-trade policies which can better tackle the negative effects of trade. Advocates of the use of trade policies, given their inevitable negative spillovers for other countries, need to show why such non-trade policies cannot be implemented or may not work in particular circumstances. Particularly for LDCs, lack of administrative capacity may be an argument to justify resort to trade policies in such cases.
Trade-distorting support and protection distorts wherever it is provided. Multilateral
developed country policies while maximizing policy space for developing countries. This view is underpinned by the belief that conditions of competition in agricultural trade between rich and poor countries are unfair (HLPE, 2011; WTO, 2000). This North-South view of multilateral agricultural trade negotiations corresponds less and less to reality. South-South agricultural trade is growing in importance. While developing countries’ share of agricultural trade is currently around 40 percent, their share in the growth of trade is higher and well over half (Matthews 2014b). In future, trade rules will increasingly apply to trade between what today are called developing countries, making the question ‘whose policy space?’ an even more urgent one. Also, while agricultural support, and particularly its trade-distorting component, in OECD countries has been falling, such support has been growing rapidly in a number of the larger middle-income developing countries (OECD, 2014). It is thus important to think about the appropriateness of WTO rules in the context where South-South
agricultural trade becomes the norm.
3.
Multilateral rules on import protection
3.1.
Description of current disciplines
For those countries that are WTO members, their ability to apply tariffs on imports of agricultural products is now constrained by their commitments under the AoA. Under the AoA, countries undertook to bind 100 percent of their tariff lines on agricultural products. The bound tariff commitments were derived on the basis of the Modalities for the Establishment of Specific Binding
Commitments under the Reform Programme (MTN.GNG/MA/W/24) which had four key elements:
For agricultural products subject to ordinary customs duties only, the reduction commitment
was implemented on the bound duty level or, in the case of unbound duties, on the level applied as at 1 September 1986. In the case of products subject to unbound ordinary customs duties, developing countries were given the flexibility to offer ceiling bindings on these
products.
For agricultural products subject to border measures other than ordinary customs duties,
the reduction commitment was implemented on customs duties resulting from
“tariffication” of such measures. Tariffication meant establishing the equivalent ad valorem
tariff by establishing the actual difference between internal and external prices.
Ordinary customs duties, including those resulting from tariffication, were reduced for
developed countries, over the six-year period commencing in the year 1995, on a simple average basis by 36 percent with a minimum rate of reduction of 15 percent for each tariff line. Developing countries were required to reduce these duties by 24 percent with a minimum rate of reduction of 10 percent for each tariff line over a ten-year period to 2004. LDCs were exempted from the reduction commitments.
Where there were no significant imports minimum access opportunities had to be established
through tariff rate quotas to represent 5 percent of domestic consumption by the end of the implementation period. Current access opportunities in excess of these minimum access quantities had to be maintained.
acceding to the WTO up to the end of 2013 (excluding countries which later became EU members) is 20 percent. Of the 22 countries in this group, 17 are considered as developing countries in the WTO.
The schedule of bound tariff commitments that each country submitted to the WTO when signing the Marrakesh agreement in 1995 (or attached to its accession protocol if it was not an original member and acceded subsequently to the WTO) thus sets the maximum tariff that any country can apply to an agricultural import. However, there is a procedure open to all WTO members that want subsequently to change a bound tariff commitment for whatever reason. When a tariff concession is modified or withdrawn, the principle is that compensation in the form of new concessions should be granted in order to maintain a general level of concessions not less favourable to trade. The GATT 1994 provides a procedure for the modification or withdrawal of agreed tariff concessions in agreement with those countries that are deemed to have a ‘principal supplying interest’. These are countries with a significant export trade with the country proposing the change in the tariff
concession.5 However, it is widely recognized that this is an arduous procedure which is not
undertaken lightly and there is no guarantee of a successful outcome.
3.2.
Import tariffs faced by developing countries
One objective of the Uruguay Round negotiations on agricultural trade liberalization was to lower protection and support in developed countries as one way to contribute to food security in developing countries. It was hoped that the AoA, by disciplining developed country policies, would help to lift world market prices, providing greater incentives to farmers in developing countries, particularly if developing countries also reformed their policies, and thus positively contribute to their welfare and food security (Anderson and Tyers, 1993; Anderson, 1998).
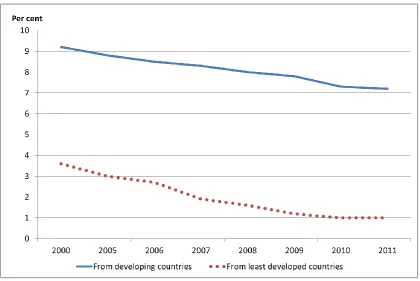
In reporting on progress towards the Millennium Development Goal (MDG) Target 8.A to develop further an open, rule-based, predictable, non-discriminatory trading and financial system, the UN MDG Monitoring Report 2014 examined trends in the tariff barriers facing developing country exporters (United Nations, 2014) using data prepared by the WTO (Figure 1). Developed country tariffs are still over 7 percent for agricultural exports from developing countries, even when preferential agreements are taken into account. However, this average tariff on agricultural goods dropped by 1.3 percentage points between 1996 and 2004, and by a further 1.4 percentage points by 2012. For LDCs, the average tariffs that they face in developed country markets have now dropped below 1 percent on their agrifood exports, resulting in a preference margin of almost 6.8 percentage points compared with competing exports originating from other developing countries.
So developed country agricultural tariffs have been falling,6 even if a more ambitious rate of
5
For example, in 2000 India negotiated modified tariff rates on imports of rice, maize, sorghum and millet which had previously been bound under GATT at zero tariffs with the US, EU and Australia. See Government of India, Ministry of Commerce and Industry, Negotiations under Article XXVIII of the GATT 1994,
http://commerce.nic.in/wtomar2k2.htm, accessed 24 March 2015. In 2012 Ukraine submitted a request to renegotiate its bound tariffs on 371 items, just four years after its accession to the EU. This proposal was received very critically by other WTO members, many of which called on Ukraine to withdraw the request (see the ICTSD Bridges report, 28 November 2012 at http://www.ictsd.org/bridges-news/bridges/news/goods-council-ukraine-renegotiation-request-russia-trade-policies-under). In October 2014 Ukraine withdrew its proposal while imposing a one-year tariff surcharge of 10 percent on agriculture products and five percent on non-agriculture products (exempting specified “vital commodities”) under GATT 1994 Article XII to address Ukraine’s balance of payments crisis. The Ukrainian request was clearly unusual in its scope and justification; nonetheless, countries do have the possibility to renegotiate individual bound tariff lines provided equivalent compensation is offered. This needs to be kept in mind if problems arise in further reducing tariffs on products of particular interest for the food security, livelihood concerns and rural development of a developing country.
6This contradicts the claim made by some developing countries in their proposal for a Development Box (WTO,
progress would have contributed even more to improving export opportunities for developing country farmers.
Figure 1: Average tariffs levied by developed countries on agricultural exports from developing countries and least developed countries (LDCs), 2001–11 (percentage ad valorem)
Source: WTO (2014c, Table F.4).
Another perspective on the trend in farm protection in developed countries is provided by indicators
from the OECD’s Producer Support Estimate database.7 The Producer Nominal Protection Coefficient
(producer NPC) measures the ratio between the average price received by producers at farm gate (including payments per tonne of current output), and the border price (measured at farm gate). It can be considered as a measure of applied protection although it will underestimate the applied tariff if there are cases of tariff redundancy. These cases arise where a country is a net exporter of a commodity, so that the producer price is closely determined by world market prices (in the absence of export subsidies). The country may have a positive applied tariff on this commodity, but its role in supporting producer prices is effectively redundant. The producer NPC also does not take input subsidies into account although these are relatively unimportant in developed countries.
A second indicator is the Producer Nominal Assistance Coefficient (producer NAC). This measures the ratio between the value of gross farm receipts (including support) and gross farm receipts valued at border prices (measured at farm gate). It thus takes into account, in addition to market price support and payments coupled to output captured by the NPC, other budgetary payments to individual producers (for example, agri-environment payments, disaster payments, regional
payments and decoupled income support). These other budgetary payments would mostly meet the green box criteria and thus not be limited under AoA rules (see Section 4.2). The NPC is thus a better indicator of the trend in trade-distorting support, but the NAC trend is also shown for comparison. In
7Note that this database now also covers a number of both OECD and non-OECD countries which have
[image:14.595.73.494.150.431.2]both cases, a value of 1 implies the absence of support and values greater than 1 indicate either
positive price support (for the NPC) or total support (for the NAC).8
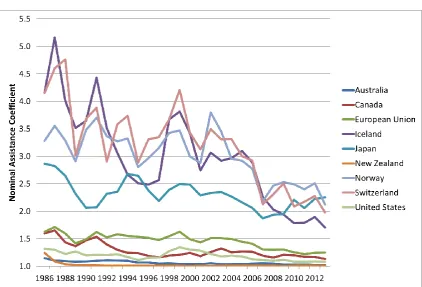
Both indicators show a clear reduction in farm protection and support in developed countries over time. The largest fall in agricultural protection took place prior to the tariff reductions under the AoA which were made over the period 1995–2000. The average NPC for the nine countries in Figure 2 fell from 2.42 in 1986–88 to 1.98 in 1992–94. However, it continued to fall steadily to 1.74 in 2000–02, 1.51 in 2005-07 and to 1.31 in 2011–13. While some of the recorded reduction in developed country agricultural protection in the period since 2005–07 is due to stronger world market prices, policy reforms since the introduction of the AoA have also been important. In this connection, the
possibility that the 2014 United States Farm Bill might lead to a reversal in the downward trend in US farm support if world prices fall and trigger large counter-cyclical payments is a worrying
development (Glauber and Westhoff, 2015; Smith, 2014).
Comparing these trends with the trend in the NAC for the nine countries underlines that some of the reduction in trade-distorting support has been replaced by other forms of support or transfers to producers. The simple average NAC for the nine countries was 2.43 in 1986–88 and 2.05 in 1992–94, values very close to the NPC values for those years. Following the introduction of the AoA, the average NAC fell to 2.01 in 2000–02, to 1.77 in 2005–07 and to 1.55 in 2011–13. Thus, over the period since the AoA came into force, the NAC has also fallen but not by as much as the NPC. There has been a relative increase in the share of support which is deemed not to be trade-distorting under the AoA’s green box rules. Whether this support really has only a minimal impact on trade is
disputed; this issue is taken up again in Section 4.2.
8Support measured in the PSE database is defined and measured differently to the amount of support
Figure 2: Trend in Nominal Protection Coefficients in developed countries, 1986–2013
Source: Own calculations based on OECD PSE database.
Figure 3: Trend in Nominal Assistance Coefficient for developed countries, 1986–2013
[image:16.595.72.495.420.707.2]3.3.
Food security and current import disciplines in developing countries
Many developing countries claim to want the possibility to protect their farmers in the face of low world market prices or an import surge as a way to improve their food security in some
circumstances. Bound tariffs represent the policy space available to a country with respect to import protection, as in principle a country can raise its tariffs to the bound levels.
3.3.1. What policy space currently exists?
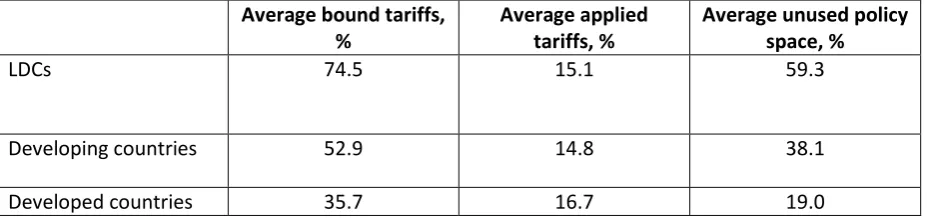
[image:17.595.68.532.324.433.2]When looking at the pattern of bound tariffs, a clear hierarchy emerges (Table 1). LDCs have the highest tariff bindings on average, followed by developing countries, with the lowest bound tariffs in developed countries. However, when the tariffs actually applied are examined, there is almost no difference between the three groups. The consequence of this is that, on average, both LDCs and developing countries have considerably more unused policy space (the difference between their average bound and applied tariffs) than developed countries. While these averages paint a broad picture, there is an enormous amount of heterogeneity within these categories.
Table 1: Average tariff structures, by main country groups, 2013
Average bound tariffs, %
Average applied tariffs, %
Average unused policy space, %
LDCs 74.5 15.1 59.3
Developing countries 52.9 14.8 38.1
Developed countries 35.7 16.7 19.0
Source: Own calculations based on WTO tariff data (WTO 2015). Countries are classified according to socio-economic status (see Section 1) rather than by their self-designated status in the WTO.
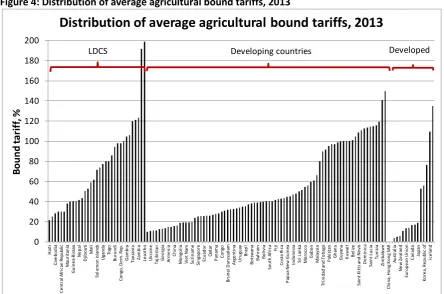
Figure 4: Distribution of average agricultural bound tariffs, 2013
Source: Own calculations based on WTO tariff data (WTO 2015).
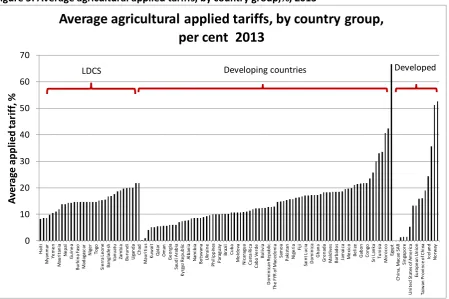
As shown already in Table 1, the distribution of applied agricultural tariffs is much more even both within and across the country groups (Figure 5). Most applied tariffs fall within the range 10–20%, but there are some outliers. Haiti has the lowest applied tariff among LDCs (8%), followed by
Lesotho (9%), even though the latter has the highest average bound tariff of any WTO member.9
Among developing countries low rates are applied by Brunei, Mauritius, Singapore and many of the oil states in the Middle East. Among important agricultural producers Chile has the lowest applied rate of 6%. On the other hand, four developing countries have average applied tariff rates over 40% (Egypt 67%, the Republic of Korea 53%, Turkey 42% and Morocco 41%), while India comes next with an average applied tariff rate of 34%. Applied tariffs in developed countries follow the hierarchy of bound tariffs, ranging from 0% for China, Hong Kong SAR, and 1% for Australia and New Zealand to 36% for Switzerland and 51% for Norway.
9
This discrepancy arises because of its membership of the South African Customs Union. 0 20 40 60 80 100 120 140 160 180 200 H ai ti C am b o d ia C e n tr al A fr ic an Re p ub lic M au ri ta n ia G u in e a-Bi ss au N e p al D ji b o u ti M al i So lo m o n Is la n ds Ug an d a To go Bu ru n d i C o n go , D e m . Re p . G am b ia Ta n za n ia Za m b ia Le so th o U kr ai n e Ta ji ki st an G e o rg ia A rm e n ia C h in a M o n go li a V ie t N am Su ri n am e Si n ga p o re Ec u ad o r Q at ar P an am a C o n go Br u n e i D ar u ss al am A rg e n ti n a U ru gu ay Br az il Bo ts w an a Ba h ra in Bo li vi a So u th A fr ic a Fi ji C o st a Ri ca P ap u a N e w G u in ea In d o n e si a Sr i L an ka M o ro cc o G ab o n M al ays ia Tr in id ad a n d T o b ag o P aki st an G h an a G u ya n a K u w ai t B e li ze Sa in t K it ts a n d N e vi s D o m in ic a Sa in t Lu ci a Tu n is ia Zi m b ab w e C h in a, H o n g K o n g SA R A u st ra li a N e w Z e al an d Eu ro p e an U n io n C an ad a Ja p an K o re a, Re p u bl ic o f Ic e la n d B o u n d ta ri ff , %
Distribution of average agricultural bound tariffs, 2013
Figure 5: Average agricultural applied tariffs, by country group,%, 2013
Source: Own calculations based on WTO tariff data (WTO 2015).
Combining the information on bound and applied tariffs yields an indicator of unused policy space, which is the difference between the two average tariff rates. While its bound tariff represents the full policy space available to a country, its unused policy space gives scope to increase current tariffs in the light of an unexpected fall in world market prices. Unlike bound tariffs, applied rates may be changed without formal notice to the WTO or compensation of trading partners as long as they do
not exceed the bindings.10 A country’s unused policy space also represents the extent to which
further reductions in bound tariffs in the Doha Round would not require changes in its applied
tariffs.11 There are again very considerable differences between countries within each of the three
country groups (Figure 6).
Among LDCs, six countries have less than 20 percentage points of unused policy space. However, as
discussed in Section 3.4, LDCs are not likely to be asked to reduce their bound rates further as part of a
Doha Round outcome. Twenty-four developing countries have less than 20 percentage points of unused policy space. The most important country in this group is China, where the margin between its bound and
applied tariffs is just 0.2 percent.12 Some of these countries are recently acceded WTO members that
accepted low bound rates on accession, and for which special arrangements are likely to be made in a
10
However, countries are not allowed to turn their tariffs into a variable levy in which the tariff level is directly related to the level of the international price, see Chile-Price Band System DS 207 which resulted from a complaint brought by Argentina against the price band system used by Chile to stabilise its domestic prices, https://www.wto.org/english/tratop_e/dispu_e/cases_e/ds207_e.htm. The result of the Chile-Price Bands case showed that varying applied tariffs even within the bound ceiling could be found illegal if the way that they are applied is inconsistent with the footnote to Article 4 AoA (Gifford & Montemayor 2010).
11
In the tariff literature, unused policy space is referred to as ‘water in the tariff’.
12 The list includes Côte d'Ivoire, Tajikistan, Suriname, Albania, Viet Nam, Republic of Korea, Kyrgyz Republic,
Jordan, Cabo Verde, Ecuador, Georgia, Armenia, Tonga, Democratic Republic of the Congo, Thailand, Saudi Arabia, Samoa, Morocco, Mongolia, Panama and Turkey.
0 10 20 30 40 50 60 70 H ai ti M ya n m ar Ye m e n M au ri ta n ia N e p al G u in e a Bu rki n a Fa so M ad ag as ca r N ig e r To go Si e rr a Le o n e Ba n gl ad e sh V an u at u Za m b ia Bu ru n d i U ga n d a C h ad M au ri ti u s K u w ai t Q at ar O m an G e o rg ia Sa u d i A ra b ia K yr gyz Re p u b lic A lb an ia N am ib ia Bo ts w an a U kr ai n e P h il ip p in es P ar ag u ay Br az il C u b a M o ld o va N ic ar ag u a C o st a Ri ca C ab o V e rd e Bo li vi a D o m in ic an Re p ub lic Th e F YR o f M ac e d o n ia Sa m o a P aki st an N ig e ri a Fi ji Sa in t Lu ci a D o m in ic a G h an a G re n ad a M al d ive s B ar b ad o s Ja m ai ca M e xi co Be li ze G ab o n C o n go Sr i L an ka Tu n is ia M o ro cc o Eg yp t C h in a, M ac ao SA R Si n ga p o re U n it e d S ta te s o f A m e ri ca Eu ro p e an U n io n Ta iw an P ro vi n ce o f C h in a Ic e la n d N o rw ay A ve ra ge a p p lie d ta ri ff , %
Average agricultural applied tariffs, by country group,
per cent 2013
Doha Round outcome. Others have low unused policy space because they have unusually high applied tariffs at present (Morocco, Turkey, the Republic of Korea). Thailand is the only other populous Asian country on the list, while Suriname and Panama are the only countries from Latin America.
Figure 6: Unused agricultural tariff policy space by country groups,%, 2013
Source: Own calculations based on WTO tariff data (WTO, 2015).
What emerges from these tabulations is not only the great heterogeneity of country situations, but also a sense that the differences between countries are rather arbitrary and not linked to any evident criteria, such as level of development. This pattern is the result of historical differences in applied tariffs and protection (for countries which bound their tariffs at the outset of the AoA at their applied rates or on the basis of tariffication) or, in the case of developing countries which had the option to offer ceiling bindings, in the different choices they made with respect to these ceiling bindings. The timing of accession to the WTO has also been important as acceding members after 1995 have had to offer lower bound tariffs as part of their accession agreements. While there is a general pattern that poorer and more vulnerable countries have greater import policy space, there are many exceptions.
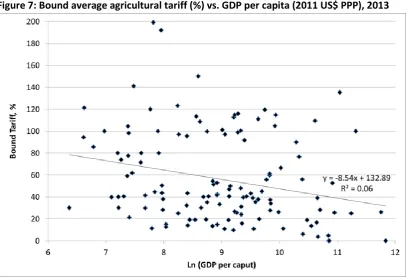
The rather arbitrary nature of import policy space is explored further in the following two figures, which compare bound and applied average agricultural tariffs with GDP per capita. The presumption is that poorer countries have relatively larger numbers of poor and vulnerable small farmers and
thus have greater need for policy space in the form of high bound tariffs.13 Figure 7 shows a weak
negative relationship (in line with the aggregate figures in Table 1) but huge variation around this trend. Many developing countries opted for ceiling bindings, but it appears there was no sense among poorer countries that they necessarily needed greater import policy space. This is also borne out by the evidence in Figure 8, which shows the agricultural tariffs actually applied. Here the negative relationship virtually disappears. Most countries seem content with average agricultural tariffs in the range 10–20 percent, with the dispersion increasing as one moves to the right of the
13
A more direct measure of the vulnerability of the farm population might be average farm income (constructed as agricultural value added divided by the agricultural workforce). GDP per capita is here used as a proxy, but there are obvious exceptions. Gabon, for example, has a high GDP per capita but much of its rural population is still very poor.
0 20 40 60 80 100 120 140 160 180 200 C e n tr al A fr ic an Re p ub lic H ai ti Se n e ga l Si e rr a Le o n e G u in e a-B is sa u M au ri ta n ia D ji b o u ti M al i Rw an d a U ga n d a To go Bu ru n d i M o za m b iq u e G am b ia U n it e d Re p . o f T an za n ia Za m b ia Le so th o C h in a, m ai n la nd Th e F o m e r Yu go sl av Re pu bl ic o f M ac e do ni a Su ri n am e A lb an ia K yr gy st an C ab o V e rd e G e o rg ia To n ga Th ai la n d Sa m o a M o n go li a Tu rke y Un it e d A ra b E m ir at e s H o n d u ra s O m an Si n ga p o re Sr i L an ka P h il ip p in es M e xi co D o m in ic an Re p ub lic Bo li vi a (P lu ri n at io n al S ta te o f) M al d ive s B ru n e i D ar u ss al am Sw az il an d P ap u a N e w G u in ea Eg yp t Ba h ra in V e n e zu e la (B o liv ar ia n R ep ub lic o f) G u at e m al a C am e ro o n C o lo m b ia Ja m ai ca In d ia Be li ze G re n ad a A n ti gu a an d Ba rb u d a Ba rb ad o s D o m in ic a Sa in t Lu ci a M au ri ti u s U n it e d S ta te s o f A m e ri ca Ja p an M o n te n e gr o Ta iw an P ro vi n ce o f C h in a A u st ra li a M o ld o va Sw it ze rl an d N o rw ay Percent
chart; higher-income countries include those both with much lower and much higher applied tariffs than for countries as a whole.
Figure 7: Bound average agricultural tariff (%) vs. GDP per capita (2011 US$ PPP), 2013
Source: Own calculations.
Figure 8: Applied average agricultural tariff (%) vs. GDP per caput (2011 US$ PPP), 2013
Source: Own calculations.
[image:21.595.75.488.421.701.2]both high bound tariffs and much unused import tariff policy space does not necessarily hold true for each and every tariff line.
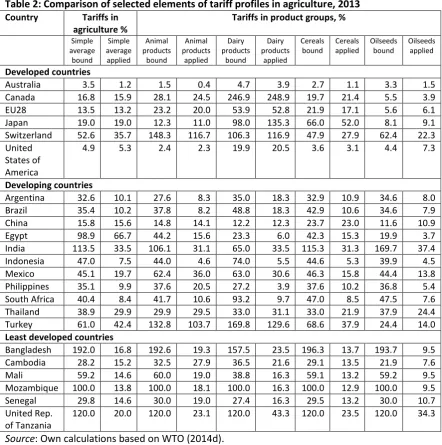
A more detailed tariff-line examination was carried out by Bernabe (2008) for selected members of the G-33 group with respect to 16 identified ‘special products’ (LDC members of the group were excluded as they would not be required to reduce bound tariffs under the Rev.4 draft modalities while tariff data were not available for some others). These emerged as the most commonly identified potential Special Products (‘proxy’ special products) from country studies conducted by the International Centre for Trade and Sustainable Development (ICTSD). The products are: rice, corn, wheat, beans, milk, dairy products, bovine meat, goat meat, sheep meat, pork, chicken, potatoes, tomatoes, onions, vegetable oils and sugar (ICTSD, 2007). In addition, researchers in 16 country case studies identified country-specific lists of potential Special Products which were also used in Bernabe’s analysis.
The purpose of her analysis was to assess if there was a need to exempt special products from further tariff reductions because the difference between bound and applied tariffs was already very low. Further reductions in this tariff overhang would then limit the policy space of these countries to implement their desired applied tariff level. Products with tariff overhangs that were below 10 and 20 percentage points, respectively, were deemed appropriate for exclusion from further tariff cuts either because further bound tariff cuts would necessitate cuts in existing applied tariffs, or because of the need to maintain a buffer between bound and applied tariffs to address problems arising from downward volatility in world market prices. Of the 30 G-33 Members covered by the study, nine had at least one special product that has zero or negative overhang. Seventeen countries had at least one special product with a tariff overhang less than 10 percentage points, while twenty had special products that have tariff overhangs under 20 percentage points. These numbers increase if the country-specific lists of special products are used, given that the country-specific lists were drawn up, in part, taking account of commodities with low tariff overhangs.
Table 2 shows greater detail for four individual product groups that are important to food security, namely, cereals, oilseeds, meat and dairy products, for an arbitrary selection of countries drawn from each of the three country groups. The extent to which the average tariff gap is a good predictor of the unused policy space for individual commodities depends on the extent of tariff dispersion in a country’s tariff schedule; the greater the degree of tariff dispersion in both bound and applied tariff structures, the more likely it will be to find products where the gap between the bound and applied tariff may be relatively small. There is some evidence that many developing countries have more even tariff structures, thus making this outcome less likely (coefficients of variation for bound and applied tariffs for individual WTO members are given in WTO (2014b)). This would mean that the average tariff gap can be a good proxy also for the unused policy space available for individual products. The extent to which the unused policy space differs across the four product groups in Table 2 can be evaluated by comparing the gap between bound and applied rates for each product group with the average gap for all agricultural products. In general, there are minimal differences between the tariff gaps for the individual product groups and the overall average tariff gap,
Table 2: Comparison of selected elements of tariff profiles in agriculture, 2013 Country Tariffs in
agriculture %
Tariffs in product groups, %
Simple average bound
Simple average applied
Animal products
bound
Animal products
applied
Dairy products
bound
Dairy products
applied
Cereals bound
Cereals applied
Oilseeds bound
Oilseeds applied
Developed countries
Australia 3.5 1.2 1.5 0.4 4.7 3.9 2.7 1.1 3.3 1.5
Canada 16.8 15.9 28.1 24.5 246.9 248.9 19.7 21.4 5.5 3.9
EU28 13.5 13.2 23.2 20.0 53.9 52.8 21.9 17.1 5.6 6.1
Japan 19.0 19.0 12.3 11.0 98.0 135.3 66.0 52.0 8.1 9.1
Switzerland 52.6 35.7 148.3 116.7 106.3 116.9 47.9 27.9 62.4 22.3
United States of America
4.9 5.3 2.4 2.3 19.9 20.5 3.6 3.1 4.4 7.3
Developing countries
Argentina 32.6 10.1 27.6 8.3 35.0 18.3 32.9 10.9 34.6 8.0
Brazil 35.4 10.2 37.8 8.2 48.8 18.3 42.9 10.6 34.6 7.9
China 15.8 15.6 14.8 14.1 12.2 12.3 23.7 23.0 11.6 10.9
Egypt 98.9 66.7 44.2 15.6 23.3 6.0 42.3 15.3 19.9 3.7
India 113.5 33.5 106.1 31.1 65.0 33.5 115.3 31.3 169.7 37.4
Indonesia 47.0 7.5 44.0 4.6 74.0 5.5 44.6 5.3 39.9 4.5
Mexico 45.1 19.7 62.4 36.0 63.0 30.6 46.3 15.8 44.4 13.8
Philippines 35.1 9.9 37.6 20.5 27.2 3.9 37.6 10.2 36.8 5.4
South Africa 40.4 8.4 41.7 10.6 93.2 9.7 47.0 8.5 47.5 7.6
Thailand 38.9 29.9 29.9 29.5 33.0 31.1 33.0 21.9 37.9 24.4
Turkey 61.0 42.4 132.8 103.7 169.8 129.6 68.6 37.9 24.4 14.0
Least developed countries
Bangladesh 192.0 16.8 192.6 19.3 157.5 23.5 196.3 13.7 193.7 9.5
Cambodia 28.2 15.2 32.5 27.9 36.5 21.6 29.1 13.5 21.9 7.6
Mali 59.2 14.6 60.0 19.0 38.8 16.3 59.1 13.2 59.2 9.5
Mozambique 100.0 13.8 100.0 18.1 100.0 16.3 100.0 12.9 100.0 9.5
Senegal 29.8 14.6 30.0 19.0 27.4 16.3 29.5 13.2 30.0 10.7
United Rep. of Tanzania
120.0 20.0 120.0 23.1 120.0 43.3 120.0 23.5 120.0 34.3
Source: Own calculations based on WTO (2014d).
These numbers may give a misleading impression of the number of commodities that are actually affected. Bernabe found just 45 specific instances of potential special products in these 16 countries when potential special products have negative, zero or minimal tariff overhangs, given existing bound and applied tariff rates. This suggests that any perceived problem of lack of policy space even at the individual tariff line level is limited, and is highly specific to particular commodities in
particular countries. As suggested above, such problems can be addressed making use of the WTO’s provision for renegotiating specific tariff lines rather than investing large amounts of negotiating capital to defend rules of which the great majority of developing countries will never take advantage.
3.3.2. How has developing countries’ use of policy space changed over time?
total number of agricultural tariff lines over the period. The period since 2006 begins before the first price spike in the recent period in 2007–08 so the period covered was of considerable volatility in world prices. A number of observers have noted that many countries responded to the increase in world market prices by reducing applied border tariffs in order to mitigate the rise in domestic prices (Konandreas, 2012).
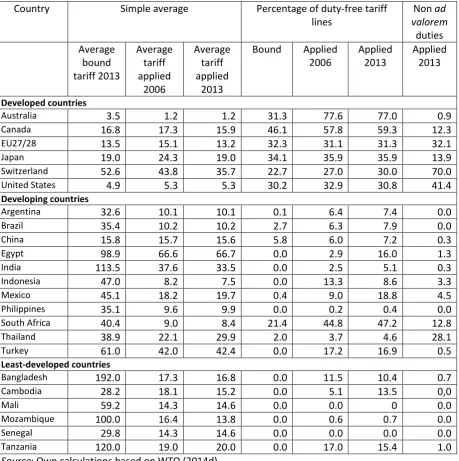
The change in the average applied tariff over time is only a partial indicator of how a country has used its import tariff policy space. Only most favoured nation (MFN) tariffs are considered, so no account is taken of lower protection as a result of a country entering into preferential trade agreements. The simple averages are measured over all agricultural tariff lines, so they include highly processed food commodities, alcoholic beverages and tobacco as well as basic food commodities more relevant to food security. Also, the average is unable to capture the possibility that a country might lower its import tariff on some commodities (say, basic foodstuffs important to household budgets) while raising tariffs on other food or drink commodities (perhaps to make up for any tariff revenue shortfall). Here the second indicator, the change in the share of duty-free tariff lines, can help to indicate whether tariff dispersion has increased or not. Finally, for countries which make use of specific tariffs, a change in applied tariffs may reflect changes in world market (import) prices rather than a discretionary use by the country of its policy space. To evaluate the potential
importance of this effect, the proportion of non-ad valorem tariff lines in total agricultural tariff lines
is also shown in Table 3.
In examining changes in average applied tariffs over time, very small changes can be discounted as these may reflect changes in the tariff structure and the number of tariff lines. Such changes could affect the simple average applied tariff without implying any change in the level of protection provided by the tariff structure. Many of the developed countries in the sample in Table 3 have reduced their applied tariffs in recent years, in line with the previous discussion (Figure 1). The final
column shows that these countries make significant use of non-ad valorem tariffs, and higher world
market prices would have the effect of reducing applied ad valorem tariffs even in the absence of
discretionary policy changes. Another characteristic of developed countries’ agricultural tariff schedules is the high proportion of duty-free tariff lines (which implies higher average tariffs on those tariff lines which carry a tariff). Both Australia and Canada offered duty-free access on a much higher proportion of their tariff lines than they were required to under their schedules of
commitments, but there was little overall change in the proportion of duty-free lines among the developed countries in the sample over the period.
For developing countries, despite the evidence that many countries lowered import tariffs on some foodstuffs in response to the increase in world market prices, the picture shown in Table 3 is more mixed. Applied tariffs were reduced in India, Indonesia and South Africa, but increased in Mexico and Thailand, and marginally in the Philippines and Turkey. Only South Africa and Thailand make
significant use of non ad valorem tariffs in the agricultural sector, which could explain some of the
observed average tariff reduction in South Africa. A stronger pattern emerges when looking at the share of duty-free tariff lines. These are, in general, not a feature of developing countries’ bound tariff commitments (South Africa is an exception). In practice, countries have chosen to apply duty-free treatment to a proportion of agricultural imports and this proportion has tended to increase over time, sometimes significantly (for example, Egypt increased its share of duty-free tariff lines from 3 percent in 2006 to 16 percent in 2013).
A mixed picture also emerges for the least developed countries. Average applied tariffs increased marginally in Mali, Senegal and Tanzania, while decreasing in Bangladesh, Cambodia and
Mozambique. Non ad valorem tariffs play no role in explaining changes in this group of countries. In
in the sample in Table 3 reduced the proportion of duty-free lines, while one (Cambodia) substantially increased its share.
Table 3: Change in applied agricultural tariffs, 2006–13
Country Simple average Percentage of duty-free tariff
lines
Non ad
valorem
duties Average
bound tariff 2013
Average tariff applied
2006
Average tariff applied
2013
Bound Applied
2006
Applied 2013
Applied 2013
Developed countries
Australia 3.5 1.2 1.2 31.3 77.6 77.0 0.9
Canada 16.8 17.3 15.9 46.1 57.8 59.3 12.3
EU27/28 13.5 15.1 13.2 32.3 31.1 31.3 32.1
Japan 19.0 24.3 19.0 34.1 35.9 35.9 13.9
Switzerland 52.6 43.8 35.7 22.7 27.0 30.0 70.0
United States 4.9 5.3 5.3 30.2 32.9 30.8 41.4
Developing countries
Argentina 32.6 10.1 10.1 0.1 6.4 7.4 0.0
Brazil 35.4 10.2 10.2 2.7 6.3 7.9 0.0
China 15.8 15.7 15.6 5.8 6.0 7.2 0.3
Egypt 98.9 66.6 66.7 0.0 2.9 16.0 1.3
India 113.5 37.6 33.5 0.0 2.5 5.1 0.3
Indonesia 47.0 8.2 7.5 0.0 13.3 8.6 3.3
Mexico 45.1 18.2 19.7 0.4 9.0 18.8 4.5
Philippines 35.1 9.6 9.9 0.0 0.2 0.4 0.0
South Africa 40.4 9.0 8.4 21.4 44.8 47.2 12.8
Thailand 38.9 22.1 29.9 2.0 3.7 4.6 28.1
Turkey 61.0 42.0 42.4 0.0 17.2 16.9 0.5
Least-developed countries
Bangladesh 192.0 17.3 16.8 0.0 11.5 10.4 0.7
Cambodia 28.2 18.1 15.2 0.0 5.1 13.5 0,0
Mali 59.2 14.3 14.6 0.0 0.0 0 0.0
Mozambique 100.0 16.4 13.8 0.0 0.6 0.7 0.0
Senegal 29.8 14.3 14.6 0.0 0.0 0.0 0.0
Tanzania 120.0 19.0 20.0 0.0 17.0 15.4 1.0
Source: Own calculations based on WTO (2014d).
picked up in the medium-term comparison shown in Table 3. They also note that the Indian cut flower tariff was raised from 30 to 60 percent in the FY 2005/06 budget, reportedly to protect an
infant industry with expanding employment and export potential.14
Despite this caveat, the message conveyed by Table 3 is that applied tariff structures for agricultural imports appear to be ‘sticky’. This may reflect the importance of tariffs as a source of government revenue rather than their role in helping to achieve domestic food price objectives.
An alternative source of data on changes in developing countries’ support for their agricultural sectors are the nominal rates of assistance (NRA) to developing country agriculture calculated in the World Bank Agricultural Distortions Project (Anderson 2013). This dataset has the advantage of a longer time series thus allowing post-1995 trends to be seen in a historical perspective. The nominal rate of assistance compares domestic market prices with external prices in each year (thus following the methodology set out for tariffication in the AoA modalities, although the NRA also includes direct payments linked to output) but it does not measure border tariffs directly. Domestic market prices could be influenced by, in addition to border tariffs, other policy instruments including quantitative import restrictions, administered prices as well as exchange rate misalignment. The nominal rate of assistance for developing country agriculture increased between 1990–94 and 2000– 04 (the period over which developing countries phased in the AoA) before falling somewhat in 2005– 2010 (most likely due to the high world market prices in that period). Although indirect evidence, it contradicts those who claim that the AoA not only prevented developing countries from supporting their agriculture but also forced the opening up of their markets. Developing countries on average increased their protection of agriculture over this period. It is again important to emphasize that the experience of individual countries may differ from this average for all developing countries.
3.3.3. Has the AoA constrained developing countries’ policy space to set import tariffs?
This evidence shows that WTO tariff bindings have not been a major factor in constraining the ability of developing and least-developed countries to set their applied tariffs in the period since the AoA came into force (see also Sharma, 2007; Laroche Dupraz and Postolle, 2013). The evidence also contradicts the claim often made in the literature that the AoA forced the further opening up of markets in developing countries (Ching and Khor, 2013; Lilliston and Hansen-Kuhn, 2013; McKeon, 2011). The AoA did require developing countries that used ordinary customs duties only or that set bound duties using the tariffication formula to reduce these bound duties by 24 percent on average over the ten-year period 1995–2004, with a minimum reduction for any tariff line of 10 percent. However, all developing countries signing the AoA had the option to choose ceiling bindings for previously unbound tariff lines (and 83 percent of all developing country agricultural tariff lines were unbound prior to the Uruguay Round, see Tangermann, 2002) from which to make these cuts, and LDCs in any event were not required to reduce bound tariffs. It appears that bound tariffs for many countries were set at sufficiently high levels that most developing countries have retained the
flexibility to apply tariffs at the level they wanted. 15
14
Baldwin and Alcamo work for the US International Trade Commission (USITC). Another USITC publication notes that “The Indian government frequently changes its rates on heavily traded international commodities, such as wheat, rice, sugar, and vegetable oils, to mitigate food price inflation, depending on market conditions. If domestic agricultural prices rise, tariff rates are lowered to create downward pressure on those prices to minimize the impact on consumers; when prices fall, the rates are often increased to protect farmers by raising the overall cost of imports.” (USITC, 2009).
15
Another claim in the literature is that the adoption of low applied tariffs by developing countries is the result of structural adjustment programmes, implying that they are not the first choice of developing countries themselves (Margulis, 2014). It is implied that developing countries would choose to implement much higher tariffs if left to their own devices and if they were not under the supervision of external agencies. Tariff reform and reduction was often part of Structural
Adjustment Programmes in the 1980s and 1990s designed as conditions for countries in balance of payment difficulties to access funding from the IMF and the World Bank. (Ingco, 1995), in her analysis of agricultural trade liberalization in the Uruguay Round, observed that many Latin American countries had undertaken unilateral trade reforms in the late 1980s or early 1990s and consolidated this liberalization in their commitments under the AoA. However, the number of developing countries entering into IMF arrangements fell dramatically during the 2000s as
macroeconomic and growth indicators improved, and only began to slowly increase again following the economic crisis in 2008 (see Annual Reports of the IMF Executive Board). The tariff choices of developing countries since the entry into force of the AoA are thus much less likely to have been the result of external pressures; it is much more plausible to see them as the outcome of domestic political economy pressures as is also the case for developed countries (Anderson, 2010). In any event, WTO rules do not apply to applied tariffs, but to bound tariffs. Only where applied tariffs are equal to bound tariffs can there be evidence that WTO rules have constrained the policy space of developing countries. Yet in no developing countries (with the exception of China) have applied tariffs been consistently set at close to the bound rates.
3.4.
Food security implications of the Doha Round Rev.4 proposals
The ongoing Doha round of multilateral trade negotiations is intended “to achieve substantial improvements in market access; reductions of, with a view to phasing out, all forms of export subsidies; and substantial reductions in trade-distorting domestic support” (WTO, 2001a). Some developing countries fear that a lack of sufficient flexibilities in the current and proposed WTO rules could lead to economic and social disruption if tariffs on sensitive products are substantially reduced and if they are prevented from taking action to offset a sudden surge in imports or unusually low world market prices.
These countries sought exemptions from tariff reductions for products they saw as important for their food security (special products, SP), as well as for the right to protect themselves from destabilizing import competition (special safeguard mechanism, SSM). In addition, all countries would have the right to designate a specified number of tariff lines on sensitive products, where lower tariff reductions than mandated by the formula approach would apply, in return for increases
in market access through tariff rate quotas (Box 1). It is not easy to work out from the Rev.4 draft modalities how individual countries might be affected by an agreement on that basis. This would depend partly on how countries responded to the various flexibilities offered in the modalities, particularly the provisions for special and sensitive products. It is also unclear if the Rev.4 modalities can form the basis for a successful Doha Round outcome and what further changes might need to be made to secure the agreement of all parties. Nonetheless, the Rev.4 draft modalities remain the most specific guidelines as to how WTO rules might change in the future.
Developing countries’ food security will be affected by the additional commitments undertaken by developed countries as well as by the impact of the draft modalities on import protection policy space. The tariff-cutting formula in the Rev.4 draft modalities is aggressive, particularly relative to the approach used in the Uruguay Round negotiations. Based on the application of the tariff reduction formula alone, the weighted average applied tariffs in developed countries would fall by
more than 50 percent and by 18.5 percent in developing countries (Laborde et al., 2012). This
difference reflects both the impact of the differentiated formula reductions and the much greater gaps between bound and applied tariffs in developing countries (Table 3).
The inclusion of flexibilities reduces the cuts in applied rates in the developed countries, although there would still be a substantial cut in their average applied rates. In the developing countries, by contrast, the inclusion of flexibilities reduces the cut in average applied rates to 0.8 percent of the initial tariff rate. Overall, applied tariffs facing both developed and developing countries (including in other developing country markets) after taking account of flexibilities would fall by around 20 percent. Brink (2014) examines the possible implications for some individual developing countri