Global Substance Flow Analysis of Indium
+1Akihiro Yoshimura
+2, Ichiro Daigo and Yasunari Matsuno
Department of Materials Engineering, Graduate School of Engineering, The University of Tokyo, Tokyo 113-8656, Japan
Interest in recycling of rare metals has greatly increased recently because of the rapid growth in the demand for, and uneven distribution of, natural resources. Substanceflow analysis (SFA) is a useful tool for determining theflow of substances in specific geographic regions. However, few SFAs have been conducted for rare metals. In this paper, we focus on indium and conduct SFAs of indium both in Japan and globally. Indium is primarily used as indium tin oxide (ITO), whose end uses can be categorized into two groups: liquid crystal displays and plasma panel displays; these are then assembled intofinal products. We quantified theflow of indium during its life cycle through mining, smelting and refining, manufacturing, use and waste management. For mining, smelting and refining, data were collected on the indium content in ore and production of primary metallic indium during 19992008. For manufacturing, we estimated the content of indium in final products, and estimated the input of indium in production as ITO in Japan. Then, we extrapolated the result to an SFA at the global scale. In-use stock and discarded indium were estimated by dynamic SFA, in which time-series data on the input of indium intofinal products and their lifetime distribution were used. We considered the loss of indium in each process to be the potential recyclable amount. We found that the extraction rate of indium in the mining, smelting and refining process was 811%, and the loss of indium in this process was 4,826 t in 2004. The loss in manufacturing amounted to 316 t, the in-use stock of indium was 116 t and the discarded indium in end-use products amounted to 5 t globally in 2004. Therefore, it was concluded that the biggest recovery potential of indium is during mining, smelting and refining.
[doi:10.2320/matertrans.M2012279]
(Received August 16, 2012; Accepted October 16, 2012; Published December 25, 2012)
Keywords: indium, in-use stock, liquid crystal display, plasma display panel, recyclable amount, substanceflow analysis
1. Introduction
There has recently been a rapid increase in the wide-spread use of devices using liquid crystal displays (LCDs), such as cellular phones and large-screen television sets. LCDs need transparent and conductive electrodes, which are made from indium tin oxide (ITO). Consequently, the demand for ITO has been increasing and, as alternative materials using zinc1) or high polymers2) are yet to be developed, it is expected that the demand for indium will continue to grow. Therefore, improvements are needed to make the production and recovery of indium more efficient, but the details of the flow and stock of indium, both in Japan and globally, are currently unknown. Substance flow analysis (SFA) is a useful tool for estimating substance
flows and stock in a society. Three studies related to SFAs of indium have been reported to date. Ueki et al.examined the production, supply and demand of indium in Japan from 1990 to 2007,3) and applied the results to analyze theflow of indium used for ITO in Japan in 2007 to estimate the loss in manufacturing of LCD panels. However, this study did not cover the entire life cycle of indium. Nakajima et al. focused on the manufacturing processes for flat panel displays to investigate the flow of indium in 2004.4) However, this study covered the flow of indium in Japan in one year only and did not consider theflow after thefinal products had been manufactured. Endo et al. projected the depletion of indium based on the results of indium flow in mining and smelting and the potential demand for LCD products.5) However, they focused on only four types of products using LCDs and assumed that the thickness of ITO
film in each product was the same. In addition, because the main objective of their study was to assess future resource depletion, they did not analyze the current situation in detail.
To assess the recyclable amount of indium, it is important to understand the substance flow of indium throughout its life cycle, i.e., from mining, smelting and refining, to use in products, and then to its discard. It is also necessary to assess theflow not only in Japan but also globally because indium is used worldwide. Therefore, the goal of this study is to estimate globally the life-cycle flow and in-use stock of indium to determine the potential recyclable amount of indium.
2. Methods
2.1 System boundary
The system boundary, which defines the processes investigated in this study, is depicted in Fig. 1. As shown in Fig. 1, indium is mined, smelted and refined to the primary metal, and then used for each product. In this study, the use of indium was categorized as either ITOfilm or other products. Although the demand for indium for other products was analyzed, the flow after its use for these products was not taken into account.
Indium is made into ITOfilms by a spattering process. Part of the scrap generated during this process is collected and recycled for secondary metal production. ITOfilms are then made into LCD or plasma display panel (PDP) modules, and used in final products. The final products accumulate in societies during their usage and are then discarded at the end of their life span. The methods adopted for analyzing the indium flow in each process are explained in detail in the following subsections.
+1This Paper was Originally Published in Japanese in J. Japan Inst. Metals
75(2011) 493501.
+2Graduate Student, The University of Tokyo
2.2 Estimation of indium flow in mining, smelting and refining
Because indium is a by-product of zinc, we estimated the amount of indiumflow based on the consumption of zinc ore and its indium concentration. As statistical data on zinc ore production were not available, the annual volume of zinc ore production was estimated using the average zinc concen-trations of ore,6) the total amount of primary zinc metal production6)and its yield rate.7)Then, to estimate the amount of indium contained in zinc ore, the average indium concentration of zinc ores in the world was obtained. As the indium concentrations of ores differ among mining sites, a weighted average of the concentration was calculated based on the reserves of 27 mining sites around the world.8)Data on the annual production of primary indium metal were obtained from statistics available since 1999.
Using all the above data, the flow of indium in mining, smelting and refining was estimated. The loss of indium in tailings at mining sites, i.e., during the beneficiation process, and in the residue at smelters could not be determined.
2.3 Estimation of indium flow in the manufacturing
process
2.3.1 Uses of indium investigated in this study
Indium is used for ITO transparent electrodes, compound semiconductors, fluorescent substances and low-melting-point alloys. Data on annual global demand for indium for each use were not available; however, in Japan, most indium is used for ITO, which has accounted for more than 85%each year since 2003.9)Other uses of indium include variousfinal products, making it difficult to estimate the substanceflow after usage in these final products. Therefore, in this study, although the annual demand for indium for uses other than for ITO was estimated,flows after use in otherfinal products were not investigated. The annual global demand for indium for use in ITO was estimated for 19992008 by multiplying the primary indium metal production in the world by the share used for ITO in Japan.
2.3.2 Identification of products using ITO
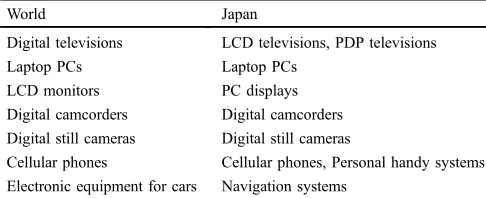
Two products that use ITO as transparent electrodes are LCD and PDP modules, which are intermediate products.9) The annual production volumes of these products in Japan were obtained,10)but not the global volumes or the monetary production value. Therefore, we first estimated the amount of indium contained in each type of final product in Japan for which detailed data were available. Then, assuming that the amounts of indium contained in the final products were proportionate to those products’monetary production values,
[image:2.595.127.471.67.175.2]we estimated the indium contained in each type of final product throughout the world. The final products that use ITO electrodes and for which the annual monetary production values for Japan and the world were obtained are shown in Table 1.11) There are nine categories of products for Japan and seven for the world.
Data on the annual monetary production value of thefinal products were available only for 2003 and 2004 in Japan, North America, the EU and some other regions, along with projections from 2005 to 2008, which were made in 2005.11) We therefore estimated the substance flow of indium in the world in 2004, the most recent year for which statistical data were available. Because data on the amount of indium used for each type of final product were not available for 1999 2002, we estimated the amounts for these years by adopting the ratio of the amount of indium used in each type offinal product to the annual primary metal production, using 2003
figures for both. Although otherfinal products use ITO, e.g., medical equipment and analytical instruments, theflows for LCD and PDP modules used in these products were not investigated further after their use in thefinal products. The amount of intermediate products used for thesefinal products was estimated from the share of the inputs to the products in Japan, which was calculated by dividing the inputs of LCD modules to each type offinal product by the gross production of LCD modules obtained from the inputoutput table for Japan.12)
2.3.3 Estimation of the amount of indium in final
products
The yield rate of indium in ITO electrodes in the manufacturing process is known to be very small.4) Consequently, it is not possible to directly estimate the indium contained in final products from the annual demand for indium for ITO. Therefore, in this work, the amount of indium in final products was estimated using a bottom-up
Fig. 1 System boundary of this study.
Table 1 Specified end-use products containing indium tin oxide in the world and Japan.
World Japan
Digital televisions LCD televisions, PDP televisions
Laptop PCs Laptop PCs
LCD monitors PC displays
Digital camcorders Digital camcorders Digital still cameras Digital still cameras
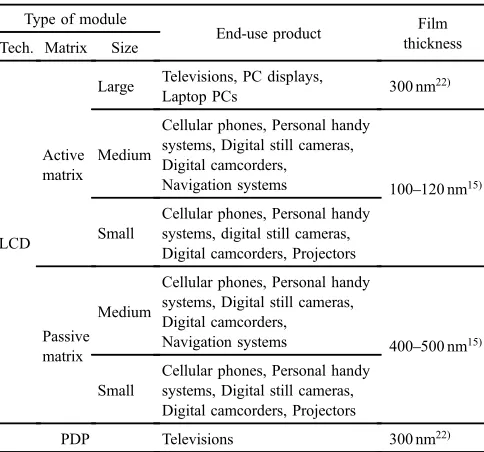
[image:2.595.305.548.240.339.2]approach. With this approach, it is necessary to define the area of the LCD, thefilm thickness of the electrodes and the amount of indium used per unit volume of ITO. The latter was calculated using the density of ITO (7.10 g/cm3) and the content of In2O3 (90 mass%).13) The film thickness of the electrode in LCDs differs from that in PDPs. We also distinguished between active-matrix LCDs and passive-matrix LCDs because the film thickness of electrodes for these LCDs differ.14) In addition, because the areas of the displays vary among LCDs, we classified the products based on their display areas. Table 2 shows the classification of end-use products used in this work.
The annual production of LCDs, as given in the Yearbook of Machinery Statistics,10) has been classified in detail for active-matrix LCDs and passive-matrix LCDs since 1997. From 1997 to 2006, active-matrix LCDs were classified into two categories: under 7.7 inch, and 7.7 inch or over; since 2007, they have been classified into three categories: under 3.0 inch, 3.0 inch to 7.7 inch, and 7.7 inch or over. In this work, we categorized these as“small LCD”,“medium LCD” and“large LCD”, respectively. Because the classifications of small LCD and medium LCD did not exist until 2007, the annual production volumes of these LCDs for earlier years were estimated by applying the 2007 production ratio of these sizes of LCDs.
By contrast, passive-matrix LCDs are not classified by size. As passive-matrix LCDs are not structurally suitable for use in large-LCD products, it was assumed that passive-matrix LCDs are used only for medium or small LCDs.15) The production ratio of medium and small passive-matrix LCDs in each year was assumed to be the same as that of active-matrix LCDs.
There is no detailed information about the display area of active-matrix large LCDs (i.e., 7.7 inch or more). The display sizes of products using large LCDs, as explained in subsection 2.3.2 and identified in Table 2, were obtained
from other sources.16,17)The production of each type offinal product was obtained from the Machinery statistics.10)
Products using medium or small LCDs were identified as shown in Table 2. We assumed that the average display sizes of medium and small LCDs were 5 inch and 2.5 inch, respectively. The annual production of each type of final product was obtained from the Machinery statistics regardless of whether they used active- or passive-matrix LCDs. The ratio of active- and passive-matrix LCDs used in cellular phones could be obtained;18)the ratios of other products were assumed to be the same as that of cellular phones, and thus the numbers of active- and passive-matrix LCDs in otherfinal products were estimated. However, it was assumed that car navigation systems use only medium LCDs19)and projectors use only small LCDs.20)
Although we were able to obtain statistical data on the production of PDP modules after 2004, there was no classification by display size. Therefore, it was assumed that PDP modules were used only for televisions, for which we obtained the proportions of different display sizes from industry documents.21)
We then estimated the yield rate in the manufacturing processes by dividing the amount of indium contained infinal products by the indium input into the ITO production process, and compared the results with previous studies.3)
2.4 Estimation of in-use stock and discard of indium
The in-use stock and discard of materials in products can be estimated using a top-down approach or a bottom-up approach.22) The top-down approach estimates the in-use stock and discard of materials in a society by assessing the annual inputs of the material to each product. The bottom-up approach makes estimates from the amount of products in use and the material use intensity in the products.
The lifetime distributions for each type of product were estimated and used to analyze the in-use stock of indium in products and the discard of end-of-life products. Because of difficulties in obtaining data on the average life span of each product, except for Japan,23) the data for Japan shown in Table 3 were used for all countries. A Weibull distribution was used to estimate the lifetime distribution function.
[image:3.595.49.291.93.319.2]The lifetime distribution functions for cathode ray tube (CRT) televisions were used for LCD televisions and PDP
Table 2 Types of modules using indium tin oxide, specified end-use products andfilm thickness corresponding to the product types.
Type of module
End-use product Film
thickness Tech. Matrix Size
LCD Active matrix
Large Televisions, PC displays,
Laptop PCs 300 nm
22)
Medium
Cellular phones, Personal handy systems, Digital still cameras, Digital camcorders,
Navigation systems 100120 nm15)
Small
Cellular phones, Personal handy systems, digital still cameras, Digital camcorders, Projectors
Passive matrix
Medium
Cellular phones, Personal handy systems, Digital still cameras, Digital camcorders,
Navigation systems 400500 nm15)
Small
Cellular phones, Personal handy systems, Digital still cameras, Digital camcorders, Projectors
PDP Televisions 300 nm22)
Table 3 Parameters of lifetime distribution function and the average lifetime of end-use products.
End use
Parameters in Weibull
distribution function Average life span (years) Reference Shape parameter Scale parameter
LCD/PDP televisions 3.1 13 12 24)
Computer monitors 4.8 8.4 6.7 24)
Laptop computers 2.2 7.4 7.4 24)
Cellular phones
/Personal handy systems 3.1 4.8 4.3 24)
Digital camcorders 3.1 7.5 6.7 25)
Digital still cameras 3.1 4.0 3.6 25)
[image:3.595.305.549.94.240.2]televisions, and those for CRT monitors were used for PC monitors and laptop PCs. Because car navigation systems are inseparable from cars, the distribution functions for cars were used. For digital camcorders and digital still cameras, the average life spans were obtained; however, the shape and scale parameters, which determine the distribution function, were not obtained. Therefore, those for cellular phones, which are similar in use pattern, were used for digital camcorders and digital still cameras. Projectors were not investigated in this work because data on the average life span were not obtained and, given the amounts of production and shipment, the indium contained in these products is negligible.
2.5 Global substance flow analysis of indium
The worldwide SFA of indium was conducted using the results of the flows for mining, smelting and refining in section 2.2, and for manufacturing processes in section 2.3 and for in-use stock and discards in section 2.4. It was assumed that all indium contained in end-of-life products was discarded, which approximates the current situation of recovery of indium from the end-of-life products were taken into account. The recyclable amount of indium in each process during its life cycle was then investigated.
3. Results
3.1 Analysis of indium flow in mining, smelting and
refining
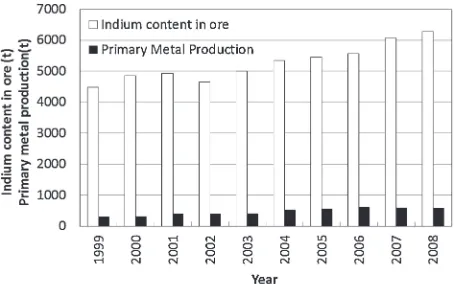
The average concentration of indium in zinc ores was estimated as 39 ppm, based on the data in the literature;6) the average zinc concentration was estimated as 8.7%. The amount of indium in the ores was estimated using a yield rate in the primary metal production of zinc of 80%,7) and assuming that there has been no change in indium and zinc concentrations in zinc ores. The results are shown in Fig. 2, along with the annual primary indium metal production.
The results indicate that the loss by dissipation in mining, smelting and refining was about 90% each year since 1999. It is likely that the lost indium is in the mining tailings and the sludge from smelters. The yield rates for other metals were estimated as follows: 86% for copper,26) 73% for
silver,27)73% for chromium,28)82% for zinc7)and 87% for nickel.29) These figures demonstrate that the yield rate for indium is significantly lower than those for other metals, which may be attributed to the difficulty of extracting indium compared with other metals.30) The indium included in the residue of zinc ores is extracted by using liquids such as acids, and then purified by electrolytic refining. Currently, there is no demand to improve the efficiency of extraction from ores because present demand is being fully met.
3.2 Flow analysis at the demand stage
3.2.1 Results for domesticflows in Japan
(1) Indium contained infinal products
The amounts of indium in the annual production of the nine types of final product are shown in Fig. 3. It was estimated that LCD televisions, which have both large production numbers and large display areas, accounted for the greatest part. PDP televisions, whose production is small but whose average display areas are large, also accounted for a large part. However, despite their large average display areas, PC monitors accounted for a small part because few PC monitors are produced in Japan. Final products using medium or small LCDs accounted for only a small proportion of the total.
(2) Indium contained in LCD and PDP modules
The amounts of indium in LCD and PDP modules produced between 2004 and 2008, which were estimated based on both production volume and monetary production value, are shown in Fig. 4.
When the estimation was based on production volume, large LCDs accounted for 50% of indium usage, whereas medium or small LCD and PDP modules accounted for 20 and 30%, respectively. When based on monetary production value, all types of LCDs used about 40% of the indium consumed. Although the amounts based on production volume are greater than those based on monetary production value, the differences do not exceed 10%. In analyzing the
flows of indium, we had originally considered that it would be more reasonable to make estimates based on production volume, in which large, medium and small LCD and PDP modules were separately investigated. However, we sub-sequently found that was no great difference if flows were estimated based on monetary production value.
The yield rate in the production process was calculated as 2% by dividing the amount of indium contained in LCD and PDP modules by the amount of indium metal input for ITO production. In previous studies,4) the yield rate was estimated as 3% by obtaining data on the yield rates of each process in ITO production. The top-down approach was used in previous studies, whereas we used a bottom-up approach to estimate the amount of indium infinal products. This involved multiplying the indium use intensity of each type of final product by its annual production volume. The results obtained using the different approaches were fairly close.
[image:4.595.56.283.618.760.2]3.2.2 The global demand for indium
Figure 5 shows the amount of indium in the annual global production of the specified end products estimated by extrapolation from the nine types of final product in Japan. The demand for indium has increased since 1999, with the
demand in 2004 three times that of 1999. In particular, the large growth in the use of cellular phones and Personal Handy-phone System (PHS) has had a great influence on the increase in demand for indium. Since 2002, products with large display areas such as digital television sets, laptop PCs and PC monitors have also proliferated. It was estimated that the amount of indium used in ITO except for the seven types of final product was 57.2 t in total in 2004.
3.3 Global in-use stock and discard of indium
The in-use stock and discard of indium contained in end-of-life products were estimated at a global scale. Because data from 1999 and later were used for the estimation, only the results for 2003 and 2004 are shown in Figs. 6 and 7. Although data before 1999 could not be included, it is evident that there were great increases in the amount of in-use stock and discard in 2003 and 2004. Cellular phones and PHS accounted for the largest share®approximately 80% of the total discard®because of the shortness of their life spans. The in-use stock of PC monitors was the second largest, which is attributable to their relatively large display areas. The estimated amount of discarded indium in digital televisions, which accounted for a relatively large share of in-use stock, was very small because they have a longer life span than other products.
3.4 Summary of the substanceflow of indium
Figure 8 shows the substance flow of indium in Japan in 2008, with the analysis based on the latest available data. In Japan, 234 t of primary metal indium was consumed for the production of ITO. In total, 751 t of indium was consumed for the production of ITO, of which 517 t came from secondary indium ingots. However, the actual amount of indium infinal products was 18.7 t, although 732 t of indium
Fig. 4 Amounts of indium in all ITO products in Japan extrapolated based on production volume and production value.
Fig. 5 Amounts of indium in annual global production of specified end products.
[image:5.595.148.451.70.242.2] [image:5.595.108.490.282.448.2] [image:5.595.49.291.491.639.2]went into the ITO production processes. As the production of secondary indium was 517 t, it was estimated that losses during the recovery processes amounted to 215 t. The previous study by Nakajima et al.3) put losses during the production of secondary indium at approximately 50% in 2004, which is similar to the results obtained in this work.
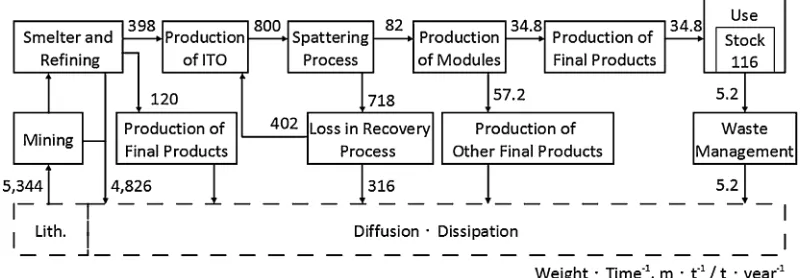
Figure 9 shows the substanceflow of indium in the world in 2004. As the indium contained in ores was 5,344 t, the amount of indium dissipated in mining, smelting and refining was estimated as 4,826 t.
The production of primary and secondary metals was 518 and 402 t, respectively. It was estimated that 800 t (i.e., 87%) of these metals was used for the production of ITO films, and the rest (i.e., 120 t) was consumed for other uses. With ITOfilms, it was estimated that the amount of indium in the
final products was 82 t, and 718 t went into the residue from the ITO production processes. Because the production of secondary indium metals was 402 t, it was estimated that losses during recovery processes amounted to 316 t.
The yield rate of ITO production processes in Japan was around 2%(as mentioned in 3.2.2) compared with 10% for the world. However, the in-use stock of indium in products globally might have been overestimated, because of the following factors. First, the monetary production value of the
final products was simply used to extrapolate the results of
Japan to the world. However, the display areas of LCD and PDP modules in final products were not taken into account, which might have led to uncertainty in the results. Second, the amount of indium in products that we did not analyze in detail in this work was estimated by extrapolation based on the monetary production values, as described in 2.3.2. The share of LCD and PDP modules used for each product in Japan in 2005 was applied to all counties, so the actual share used in each country was not reflected in the estimates.
Of the 82 t of indium contained in the final products manufactured in 2004, it was estimated that 35 t was contained in the seven types of product that we identified. In the dynamic SFA for the seven types offinal product, the in-use stock and discard of indium in 2004 were estimated as 120 and 5.2 t, respectively.
3.5 The recyclable amount of indium
The substance flow of indium shows that the amount of indium dissipated into the environment can be divided into three categories: dissipation in mining, smelting and refining; losses during the recovery process; and discard of end-of-life products. A comparison of these three flows revealed that dissipation was largest in mining, smelting and refining (4,800 t), followed by losses during the recovery process (320 t) and discard of end-of-life products (5.2 t).
Fig. 7 Amounts of indium in discarded end-of-life products of the world.
[image:6.595.50.280.68.265.2] [image:6.595.223.536.70.273.2] [image:6.595.92.502.316.456.2]The recyclable amount of indium is the amount that is currently discarded and not collected or reused. Great differences®more than a factor of 10®were observed between the three dissipation flows. The recyclable amount of indium in mining, smelting and refining was the largest and was about 10 times greater than the production of the primary metal. Thus, improving the yield rate in mining, smelting and refining is considered to be the most efficient approach for achieving a stable supply of indium to meet future increase in demand.
Another important finding is that, even though indium contained in end-of-life products can be recovered, the recovered amount would be about 1% of the production of the primary metal. The main reason for this is the small yield rate in the ITO production process. Because demand for indium has been increasing since 2004, the in-use stock and discard of indium in 2008 were also estimated, as 300 and 20 t, respectively (note, however, that the results have low reliability because the production value of the final products in the world was a projection from 2005). If indium contained in end-of-life products was recovered, approximately 4% of the demand of indium was covered in 2008. By contrast, dissipation during mining, smelting and refining amounted to about 5,720 t and the losses during ITO production processes amounted to about 200 t, which was similar to the results for 2004. This analysis confirms that the optimum target for indium recovery is the dissipation flow during mining, smelting and refining.
4. Conclusion
In this paper, a global SFA of indium from mining and smelting through to the discard in end-of-life products was conducted. Because the available data on physical flows of indium needed to calculate the material flows were insufficient, the global indium flow was estimated by extrapolating the results for Japan based on monetary production value.
The results show three dissipation flows of indium®in mining, smelting and refining, losses during the recovery process, and discard of end-of-life products®which suggest potential targets for recovering indium and hence enhancing future supply. The amount of dissipation during mining, smelting and refining is about 10 times that of the production of the metal, or 500 t/y. By contrast, even though indium
contained in end-of-life products could be recovered, the recovered amount would have been only about 1 and 4% of the production of the primary metal in 2004 and 2008, respectively. It is therefore suggested that it would be more efficient to recover indium from the dissipation flow during mining, smelting and refining than from end-of-life products.
Acknowledgments
The authors thank Prof. T. Okabe and Dr. K. Nose of The University of Tokyo, Prof. A. Suzuki of Osaka Sangyo University, and Dr. K. Takahashi of NTT for valuable discussions and comments.
This work was partially supported by JSPS KAKENHI Grant Number 22686084.
REFERENCES
1) Homepage of Electron Devices Lab. of Osaka Sangyo Univ., 2007 nendosei no page, Innovation Japan 2007, http://ms-lab.eic.osaka-sandai.ac.jp/electron/2007/innovation_japan.pdf, 2011/1/13. 2) Homepage of Shin-Etsu Polymer Co., Ltd., Investor Relations,
Oshirase, http://www.shinpoly.co.jp/ir/whatsnew/2009/PDF/20090810-SEPLEGYDA.pdf, 2010/11/24.
3) R. Kamiki and A. Hosoi: Kikinzoku·Rare Metal no Recycle Gijutu Syusei, (NTS Inc., 2007) pp. 397420.
4) K. Nakajima, K. Yokoyama, K. Nakano and T. Nagasaka:Mater. Trans. 48(2007) 23652369.
5) K. Endo, M. Yamashita, Y. Toba, H. Nakajo, H. Shiba, S. Okumura, Y. Miyahara and K. Takeda:J. MMIJ123(2007) 123129.
6) Homepage of Japan Oil, Gas and Metals National Corporation: Supply Side Analysis 2010 (3)®Lead/Zinc®, JOGMEC Virtual Mineral Resource Information Center, http://www.jogmec.go.jp/mric_web/ kogyojoho/2010-11/MRv40n4-10.pdf, 2011/1/10.
7) T. E. Graedel, D. van Beers, M. Bertram, K. Fuse, R. B. Gordon, A. Gritsinin, E. M. Harper, A. Kapur, R. J. Klee, R. Lifset, L. Memon and S. Spatari:J. Ind. Ecol.9(2005) 6790.
8) Homepage of National Institute of Advanced Industrial Science and Technology, Institute for Geo-Resources and Environment, Green Report 2010, http://unit.aist.go.jp/georesenv/result/green-report/ report10/p71.pdf, 2011/3/10.
9) Homepage of Japan Oil, Gas and Metals National Corporation: Kobutsu shigen materialflow Heisei 21nendo chosa report, JOGMEC Virtual Mineral Resource Information Center, http://www.jogmec. go.jp/mric_web/jouhou/material/2009/In.pdf, 2010/10/13.
10) Ministry of Economy, and Industry, Economic and Industrial Policy Bureau, Research and Statistics Department: YEARBOOK OF MACHINERY STATISTICS (19872008).
[image:7.595.98.498.73.212.2]11) Japan Electronics and Information Technology Industries Association: Handotai chosa toukei iinkai, Chuchoki shijo chosa syouiinkai, Sekai no shuyo denshikiki kara mita handoutai shijo no chuchokitembo 2005, (Japan Electronics and Information Technology Industries Association, 2007), pp. 3233, pp. 3639, pp. 4647, pp. 5051, pp. 8485. 12) Ministry of Internal Affairs and Communications, Statistics Bureau:
InputOutput table of Japan (2005).
13) Homepage of Mitsubishi Material Electronic Chemicals Co., Ltd.: Dodensei zairyo, http://www.mmc-ec.co.jp/business/fine/e01_conductive. html#ito, 2011/1/21.
14) CMC Publishing Co., Ltd.: 2001nen Ekisho Display kouseizairyo, (2001) p. 108.
15) Homepage of Science Graphics Co., Ltd.: LCD no kozo, kisogenri, 2011/3/10.
16) Homepage of Ministry of Economy, Trade and Industry Commerce and Information Policy Bureau, Information and Communication Elec-tronics Division: Television juzouki no genjo ni tsuite, http://www. meti.go.jp/committee/materials2/downloadfiles/g81111a05j.pdf, 2010/ 12/10.
17) Homepage of Japan Electronics and Information Technology Industries Association, Information Terminals and Technologies Committee, Display Senmon Committee: Ekisho monitor oyobi Note PC you Ekisho Display no shijokibo mitoshi ni tsuite, http://home.jeita.or.jp/is/ statistics/intelterm/2009/100825-1_display.pd, 2010/12/10.
18) Y. Kim: Keiei Shirin41(2004) 107116.
19) Homepage of Impress Watch Corporation, Car Watch, http://car.watch. impress.co.jp/docs/news/20100511_366353.html, 2011/3/10.
20) Homepage of Quartz Crystal Industry Association of Japan: Ekisho Projector, http://www.qiaj.jp/pages/frame20/docs/handbook-projector-01.pdf, 2011/3/10.
21) Yano Research Institute Ltd.: Raremetal 2020 nen tenbo, Jidosha sangyo, Shoene sangyo, Electronics sangyo, Bunyabetsu juyou jittai to choki juyou yosoku, (Yano Research Institute Ltd., 2010) p. 260. 22) T. Hirado, I. Daigo, Y. Matsuno and Y. Adachi:Tetsu to Hagane95
(2009) 96101.
23) Homepage of National Institute for Environmental Studies: Lifespan database for Vehicles, Equipment, and Structures, http://www.nies. go.jp/lifespan/index.html, 2011/3/10.
24) M. Oguchi, T. Kameya, T. Tasaki, N. Tamai and N. Tanigawa: Waste Manag. Res.17(2006) 5060.
25) Cabinet Office, Economic and Society Research Institute, Department of Business Statistics:Kakeishohi no doko, Shohi doko chousa nempou 2008, (Toko Co., Ltd. 2008).
26) T. E. Graedel, D. Vanbeers, M. Bertram, K. Fuse, R. B. Gordon, A. Gritsinin, A. Kapur, R. J. Klee, R. J. Lifset, L. Memon, H. Rechbergere, S. Spatari and D. Vexler:Environ. Sci. Technol.38(2004) 12421252.
27) J. Johnson, J. Jirikowic, M. Bertram, D. Vanbeers, R. B. Gordon, K. Henderson, R. J. Klee, T. Lanzano, R. Lifset, L. Oetjen and T. E. Graedel:Environ. Sci. Technol.39(2005) 46554665.
28) J. Johnson, L. Schewel and T. E. Graedel:Environ. Sci. Technol.40 (2006) 70607069.
29) B. K. Reck, D. B. Muller, K. Rostkowski and T. E. Graedel:Environ. Sci. Technol.42(2008) 33943400.