Hydrogen Visualization in Steels Using Ag Decoration Method
+1Eiji Akiyama
1,+2and Saburo Matsuoka
21Materials Reliability Unit, National Institute for Materials Science, Tsukuba 305-0047, Japan
2Research Center for Hydrogen Industrial Use and Storage, Kyushu University, Fukuoka 819-0395, Japan
The relation between hydrogen distribution and metallographic microstructure was investigated by means of Ag decoration technique for a SUS304 austenitic stainless steel, and martensitic and spheroidized SCM440 steels precharged with hydrogen. Preferential distribution of Ag particles was seen on the slip lines of the deformed and hydrogen-charged SUS304 stainless steel, suggesting that the slip lines act as hydrogen trap sites. The martensitic SCM440 steel showed almost no selective Ag deposition, indicative of apparently homogeneous distribution of hydrogen. This is probably because the distribution of dislocations with relatively high concentration and thefine structure including lath boundaries etc. acting as hydrogen traps is homogeneous. The spheroidized SCM440 steel showed almost no Ag deposition on the coarse cementite particles and the Ag particle distribution on the other areas did not show clear selectivity. This result suggests that the hydrogen does not diffuse through the cementite particles. The smallest Ag particle size observed by means of atomic force microscope was in the order of 10 nm. Though the minimum size of the Ag particle does not necessarily indicate the resolution of the hydrogen visualization, Ag decoration technique is useful to observe the hydrogen distribution. [doi:10.2320/matertrans.M2014431]
(Received November 28, 2014; Accepted March 26, 2015; Published May 25, 2015)
Keywords: hydrogen, hydrogen embrittlement, delayed fracture, steel, hydrogen visualization, silver decoration
1. Introduction
High strength steels and other metals such as Al, Ti and Zr alloys have possibility to be suffered from hydrogen embrittlement caused by hydrogen intruding from the service environment, for example atmospheric corrosion environ-ment, hot water, sour gas and high pressure hydrogen gas and so forth. In recent years, hydrogen embrittlement becomes more important issue due to the needs for increase in the strength level of the materials and because of the demands for ensuring safety and reliability of materials used for hydrogen energy, such as high-pressure vessels of hydrogen gas.
It is expected that the status of hydrogen and hydrogen distribution in materials are well understood in order to clarify the mechanism of hydrogen embrittlement. However, the direct observation of hydrogen is difficult if stable hydride is not formed, because hydrogen, that is the smallest atom in the periodic table, diffuses in metallic materials at room temperature and is released from the materials as a form of gas. It has been reported that 0.1 mass ppm or even lower hydrogen concentration can cause hydrogen embrittlement fracture in high strength steels.1)Such low concentration of hydrogen also makes the hydrogen observation difficult.
There are some techniques for observation of hydrogen in materials such as tritium autoradiography,25) hydrogen microprint technique,612) Ag decoration method,1315) sec-ondary ion mass spectrometry (SIMS),16)etc. Ag decoration is relatively easy to carry out for hydrogen observation as well as hydrogen microprint technique.
Ag decoration method utilizes reduction reaction of Ag ion, which is equilibrated with a complex ion (eq. (1)), caused by adsorbed hydrogen (Hads) on the metal surface leading to formation of Ag metal precipitates. The distribu-tion of hydrogen can be visualized by Ag particles distributed on the sample surface.
AgðCNÞ2Agþþ2CN ð1Þ
HadsþAgþ!HþþAg ð2Þ We have successfully observed distribution of hydrogen entry in an artificial crevice during crevice corrosion1719)and the hydrogen distribution around crack initiation sites and fracture surface of a single-crystal stainless steel.20) These hydrogen observations are relatively macroscopic, but if we can observe hydrogen distribution corresponding to micro-structures of metals, it will provide us an insight about the role of hydrogen on hydrogen embrittlement fracture. In this study, more microscopic observation of hydrogen distribution has been tried using hydrogen-charged SUS304 steel and martensitic and spheroidized SCM440 steels.
2. Experimental Procedure
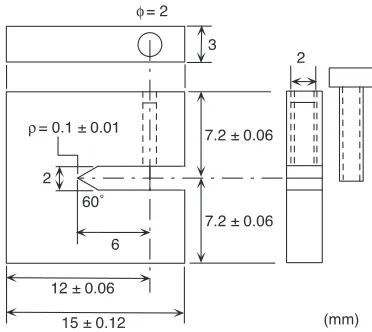
SUS304 and SCM440 steels were used for the experi-ments. CT test pieces shown in Fig. 1 were machined from solution-treated SUS304 steel. The chemical composition of the SUS304 steel is shown in Table 1. One side of the test piece was electro-polished for Ag decoration observation. The load was applied using a bolt, and the back strain measured by using a strain gage attached on the back of the CT test piece was adjusted to 600 µ¾. The loaded test pierce was charged with hydrogen galvanostatically for 2 h in a 0.1 M NaOH aqueous solution at 1 mA/cm2 and at room temperature. A Pt wire was used as a counter electrode. After the hydrogen charging the loaded specimen was washed with deionized water and acetone followed by drying in air. Subsequently, the test piece was unloaded, and then immersed in a 4.3 mM K[Ag(CN)2] aqueous solution for Ag decoration for 10 min at room temperature. Saitoh et al.
have reported that the efficiency of Ag deposition is dependent on the solution pH.15) In the present study, the solution was used as prepared without any additional pH control.
After the Ag decoration, the Ag-decorated side of the CT test piece was observed by using an optical microscope, a +1This Paper was Originally Published in Japanese in J. Japan Inst. Met.
Mater.77(2013) 622626.
+2Corresponding author, E-mail: AKIYAMA.Eiji@nims.go.jp
SEM and an atomic force microscope (AFM). EPMA was used to confirm that the particles distributed on the surface were Ag.
One of the SCM440 steels used in this study was heat treated at 880°C for 45 min and quenched and tempered at 450°C for 90 min to obtain martensite. The other was deformed 70% at 700°C followed by heat treatment at the same temperature for 168 h for spheroidization of carbides. Both of the steels were machined to sheet specimens with a thickness of 0.5 mm and a size of 15 mm©15 mm. One side of the specimens was electropolished. The chemical compo-sition of the SCM440 steel is shown in Table 1.
An electrochemical cell shown in Fig. 2 was used for experiments using the sheet specimens of SCM440 steels. There is a circular hole on the bottom of the cell, and a specimen wasfixed on the bottom using o-rings with an inner diameter of 8 mm. An Al foil was attached to the specimen
for conduction. A 0.5 M NaCl+0.04 M NH4SCN aqueous solution was used for electrochemical hydrogen charging and the specimen was galvanostatically polarized at a cathodic current of 1 mA/cm2. The hydrogen-charged surface of the specimen was opposite to the electropolished surface. Hydrogen charging was continued for 3 h followed by immersion of the specimen in a 4.3 mM K[Ag(CN)2] aqueous solution for 30 min at room temperature for Ag decoration.
One of the reasons why the hydrogen charging was carried on the surface opposite to the electropolished surface used for observation is to avoid contamination of the surface during hydrogen charging for the specimen, which is less corrosion-resistant to the hydrogen charging solution compared with SUS304 specimens. Another reason is not to observe the distribution of hydrogen on the hydrogen entry surface reflecting hydrogen entry efficiency but to observe the distribution of hydrogen diffusing through the specimen. In the case of SUS304 steel, the diffusivity of hydrogen in austenite is quite low, and therefore the Ag decorated surface for observation was the same as the hydrogen-charging surface. In contrast, the diffusivities of hydrogen in both SCM440 steels are much higher than that in SUS304 steel and the hydrogen can diffuse to the surface opposite to the hydrogen entry side. The penetration of hydrogen through the SCM440 steels specimens is predicted from the thicknesses of the specimens and results of electrochemical hydrogen permeation tests.21)
3. Results
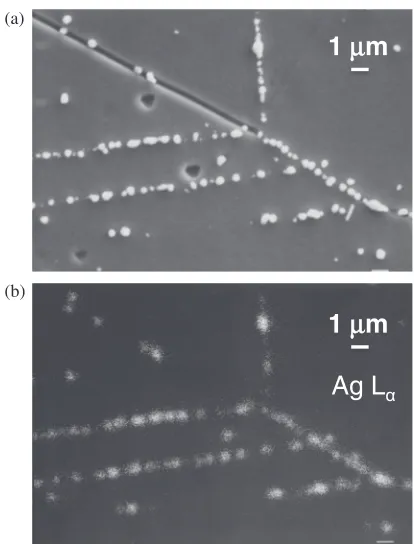
Figure 3 shows the Ag decoration image taken by means of SEM around the notch root of the CT test piece of SUS304 steel. The notch root is seen in the upper part of Fig. 3(a). It is considered that the Ag precipitates are seen as white dots in the figure. The SEM image and the correspondent EPMA image of Ag in Fig. 4 ensure that the white dots are Ag. A trench running diagonally from the upper left to the lower right is presumably a grain boundary corroded by the electropolishing. The black spots seen in the right hand side of Fig. 4(a) are probably pits formed during electro-polishing.
Since the distribution of Ag in Fig. 4(b) is correspondent to the distribution of white dots in Fig. 4(a), it is confirmed that the particles seen in Fig. 4(a) are Ag. Byproduct of AgCN, which is not a product of reduction reaction of Ag ion, forms needle crystal.13) Because the particles observed in Fig. 4(a) are spheroidal or hemisphere, the particles are presumably Ag precipitates in metallic state formed by the reduction reaction of Ag ions.
[image:2.595.74.260.69.235.2]Selective distribution of Ag particles was observed on lines presumably correspondent to slips. This suggests that the reduction reaction of Ag ions by hydrogen occurs on slip. On the other hand, selective distribution of Ag particles was seen on some limited grain boundaries. In that case whole coverage of Ag particles on a grain boundary was not observed but only on some part of the grain boundary showed high density of Ag particles. For instance as can bee seen in Fig. 4(a), deposition of Ag particles selectively occurred on grain boundary where the grain boundary was intercepting some slip lines.
Table 1 Chemical composition of SUS304 and SCM440 steels (mass%).
C Si Mn P S Cr Ni Mo Fe SUS304 0.06 0.60 1.57 0.032 0.009 18.30 8.30 ® bal. SCM440 0.40 0.24 0.81 0.020 0.007 1.03 ® 0.16 bal.
Pt counter electrode (Anode)
Galvanostat
Solution
Terminal Specimen (Cathode)
[image:2.595.58.282.281.546.2]AFM images of the Ag-decorated surface of the SUS304 steel test piece is shown in Fig. 5. The border between the bright and dark areas showing a difference in level recognized by means of AFM was regarded as annealing twin, and marked by TW in the figure. The trenches were assumed to be correspondent to grain boundaries (GB) that
were probably preferentially dissolved during electropolish-ing, and the line on theflat surface where Ag particles were selectively distributed is considered to be slip line (SL). The selective precipitation of Ag on the slip line suggests selective distribution of hydrogen whereas no selective deposition of Ag was observed on the annealing twins.
[image:3.595.331.522.64.333.2]As shown in Fig. 5(b), the small particles observed by means of AFM were in the size of several tens of nm. As will be discussed later, the resolution of the Ag decoration may not that high as the scale of the smallest particle size, but Ag decoration method is expected to be effective for the relationship between hydrogen distribution and micro-structure.
Figure 6 shows AFM observation of Ag-decorated surface of the SCM440 martensitic steel after hydrogen charging. Since fine cementite particles are distributed, it is not easy to differentiate Ag particles from cementite when the Ag particle size is similar to that of cementite particle. Never-theless, the relatively large particles or the particles with decent height looking brighter in the image are presumably Ag. Some other areas were also observed, but no clear selective Ag deposition was seen on boundaries such as prior austenite grain boundary, packet, block or lath boundaries, and Ag particles were almost homogeneously distributed.
Though selective distribution of hydrogen was suggested on the defects in case of SUS304 steel as mentioned before, hydrogen distribution on the martensitic steels was almost homogeneous. It has been reported that the interface between cementite and matrix and dislocations act as hydrogen trap from the results of TDA of hydrogen.22)To the contrary, other researchers have reported that ¾ carbide and cementite do not play a role of hydrogen trap.23) In the present study,
(a)
(b)
1
µµ
m
1
µ
m
Ag L
Fig. 4 SEM photograph and Ag L¡mapping image of the Ag decorated surface of the deformed CT specimen of SUS304 steel. (a) SEM photo (b) Ag L¡mapping.
10
µ
m
TW
GB
GB
GB
TW SL
SL SL
SL
TW SL
1 µm
(a)
(b)
Fig. 5 (a) AFM image of the Ag decorated surface of the deformed CT specimen of SUS304 steel. GB shows grain boundary, TW twin and SL slip line. (b) A magnified image of the area shown by the white square in (a).
(a)
100 µm
(b)
20 µm
[image:3.595.66.273.66.340.2] [image:3.595.65.272.382.656.2]meaningful relationship between hydrogen and cementite was not seen from the Ag decoration results. Even when hydrogen concentration is high, it is possible to think that the amount of trapped hydrogen aroundfine carbides is not enough to form reduced Ag particles or that the trapped hydrogen may not diffuse to the surface to reduce enough Ag ions for formation visible Ag deposits. Hence, the observa-tion results do not necessarily deny the possibility of selective distribution of hydrogen at the cementite/ferrite interface, but in any case the present Ag decoration observation did not show clear relationship between hydrogen and micro-structure.
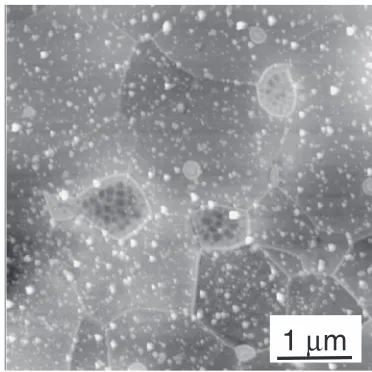
An example of Ag decoration results of the spheroidized SCM440 steel is shown in Fig. 7. The particles with honeycomb-like texture are spheroidized cementite. Less Ag particles were observed on the spheroidized cementite. Except for on the spheroidized cementite particles, Ag particles were almost homogeneously distributed, and no significant selectivity of Ag deposition on the grain boundaries was seen.
The hydrogen charging methods for the spheroidized SCM440 steel and for the martensitic SCM440 steel were the same but the Ag particles on the surface of the spheroidized SCM440 steel was much dense in comparison with that on the martensitic steel. This is presumably because the diffusion of hydrogen in the spheroidized steel is faster than that in the martensitic steel so that the hydrogen reached to
the observation surface of the spheroidized steels during hydrogen charging and during Ag decoration was more than that of the martensitic steel. The observation results suggest that the cementite does not act as diffusion path for hydrogen and that the grain boundaries of ferrite are not preferential diffusion path.
4. Discussion
In this study, microscopic hydrogen visualization was attempted by using Ag decoration method in conjunction with AFM observation for SUS304 austenitic stainless steel and SCM440 martensitic and spheroidized steels. AFM observation allowed us to see small Ag particles in the size of several tens nm. In the case of hydrogen microprint technique, a liquid nuclear emulsion including AgBr crystals whose diameter is about 300 nm is applied on the observation surface, and metallic Ag deposits reduced by hydrogen are observed.10)Therefore, in terms of Ag particle size, it can be expected that Ag decoration method has higher resolution than hydrogen microprint technique. However, relatively coarse Ag particles tended to be formed on the surface with increase of the coverage of precipitated Ag instead of dense distribution of fine Ag particles. This implies that adsorbed hydrogen in the vicinity of an Ag particle might be transferred to the Ag particle according to surface diffusion and the hydrogen adsorbed on Ag reduced Ag ions leading to further growth of the Ag particle. Assuming the surface diffusion, it is needed to consider that the size of thefine Ag particle does not necessarily correspond to the resolution of hydrogen observation. Nevertheless, as shown in the case of SUS304 test piece, hydrogen observation corresponding to microstructure was successfully performed.
Both of Ag decoration method and hydrogen microprint technique utilize reduction reaction of Ag ions by adsorbed hydrogen. Accordingly, the observed Ag particles distribu-tion does not reflect only the location selectivity of adsorbed hydrogen but also the selectivity of hydrogen diffusion. Ag deposition on the surface is considered to be enhanced if the amount of adsorbed hydrogen preferentially trapped on
(a)
(b)
2
µ
m
1
µ
m
Fig. 6 AFM image of the Ag decorated surface of the SCM440 martensitic steel specimen.
1
µ
m
[image:4.595.79.262.64.412.2] [image:4.595.333.519.69.255.2]hydrogen-trapping sites is high enough or if hydrogen diffusion is fast through the sites to supply hydrogen for reduction of Ag ions. On the contrary, Ag deposition may not be significant when hydrogen diffusion is slow even if the trapped hydrogen concentration is high.
Whether the interface between cementite and ferrite matrix acts as hydrogen trap is controversial.22,23) Though the interface between the coarse spheroidized cementite and ferrite matrix is not necessarily the same, it is interesting to see whether selective deposition occurs or not on the interface on the spheroidized cementite and ferrite matrix. However, preferential distribution of Ag particles corre-sponding to hydrogen concentration was not observed on the interface in this study. As described before, no preferential Ag deposition does not necessarily mean low concentration of hydrogen, because selective reduction reaction of Ag ions does not take place if trapped hydrogen atoms do not sufficiently diffuse to the surface. What we can say from the observation results of the spheroidized SCM440 steel in the present study is that the spheroidized cementite does not act as diffusion path of hydrogen. Thus, Ag decoration method utilizes reduction of Ag ions on the metal surface, and both location of hydrogen and diffusion property affects the observed distribution of Ag particles.
The Ag decoration on the strained SUS304 austenitic stainless steel test piece suggested selective distribution of hydrogen on slips. The observed surface was the same as the hydrogen-charged surface because hydrogen diffusion in austenite is extremely slow compared to the SCM440 steels. Therefore, we cannot simply conclude that the hydrogen observed on the slip lines was accumulated by diffusion but it is also possible to think that the slip lines are preferential sites for hydrogen entry under hydrogen charging. Though further investigation is required, it can be said that there should be correlation between slip and hydrogen. Considering about the volume of the deposited Ag particles, Ag ions were reduced by hydrogen adsorbed at the beginning of the Ag decoration and by hydrogen diffused to the surface during the immersion of the specimen in the Ag decoration solution.
Thus, Ag particle distribution observed by the Ag decoration method reflects not only the adsorbed hydrogen on the surface but also diffusion of hydrogen in steels. Therefore, to analyze hydrogen distribution in more detail, it is expected to apply tritium autoradiography,12)which allows us to observe hydrogen in a stationary state in conjunction with Ag decoration method or hydrogen microprint technique reflecting hydrogen diffusion.
5. Conclusions
Hydrogen visualization was performed by means of Ag decoration method on a SUS304 stainless steel and martensitic and spheroidized SCM440 steels. Ag particles preferentially precipitated on slip lines on strained SUS304
steel test piece indicating selective distribution of hydrogen on slips. Ag particles were almost homogeneously distributed on the martensitic SCM440 steel. In the case of the spheroidized SCM440 steel, precipitation of Ag on cementite particles was hardly observed but was seen almost homoge-neously on the ferrite matrix. This fact suggests that cementite is not diffusion path of hydrogen. Though it is required to consider about the influence of hydrogen diffusion, it can be said that Ag decoration method is a simple and easy way for hydrogen visualization with relatively high resolution because selective deposition of
fine Ag particles in the size of 10-nm order was observed.
Acknowledgments
Thanks are due to Professor Katsuhiko Asami and Mr. Yoshihiro Murakami of Institute for Materials Research, Tohoku University for assistance of SEM and EPMA measurements and to Dr. Masao Hayakawa for advises.
REFERENCES
1) N. Suzuki, N. Ishii, T. Miyagawa and H. Harada: Tetsu-to-Hagané79
(1993) 227232.
2) H. Saito, K. Miyazawa and M. Mori: J. Japan Inst. Metals62(1998) 215223.
3) L. M. Foster, T. H. Jack and W. W. Hill: Metall. Trans.1(1970) 3117 3124.
4) H. Saitoh and M. Mori: Kinzoku Materials Science & Technology67
(1997) 10271036.
5) H. Saitoh, T. Hishi, T. Misawa, T. Ohnishi, Y. Noya, T. Matsuzaki and T. Watanabe:J. Nucl. Mater.258263(1998) 14041408.
6) S. Kuramoto, K. Ichitani, A. Nagao and M. Kanno: Tetsu-to-Hagané86
(2000) 1723.
7) K. Koyama, G. Itoh and M. Kanno: J. Japan Inst. Met. Mater.62(1998) 790795.
8) M. I. Luppo and J. Ovejero-Garcia:Corros. Sci.32(1991) 11251136.
9) A. Nagao, S. Kuramoto, M. Kanno and T. Shiraga: Tetsu-to-Hagané86
(2000) 431.
10) J. Ovejero-García:J. Mater. Sci.20(1985) 26232629.
11) T. E. Pérez and J. Ovejero García:Scr. Met.16(1982) 161164.
12) H. K. Yalçì and D. V. Edmonds:Mater. Charact.34(1995) 97104.
13) J. Yao and J. R. Cahoon:Metall. Trans. A21(1990) 603608.
14) T. Schober and C. Dieker:Metall. Trans. A14(1983) 24402442.
15) H. Saitoh, T. Hishi and T. Misawa:Mater. Trans. JIM37(1996) 373 378.
16) K. Takai, Y. Homma, K. Izutsu and M. Nagumo: J. Jpn. Inst. Met.60
(1996) 11551162.
17) T. Sundararajan, E. Akiyama, Y. Katada and K. Tsuzaki:ISIJ Int.46
(2006) 10811085.
18) T. Sundararajan, E. Akiyama and K. Tsuzaki:Electrochem. Solid-State Lett.8(2005) B30B33.
19) T. Sundararajan, E. Akiyama and K. Tsuzaki:Scr. Mater.53(2005) 12191223.
20) M. Koyama, E. Akiyama, T. Sawaguchi, K. Ogawa, I. V. Kireeva, Y. I. Chumlyakov and K. Tsuzaki:Corros. Sci.75(2013) 345353.
21) E. Akiyama, S. Li, T. Shinohara, Z. Zhang and K. Tsuzaki:
Electrochim. Acta56(2011) 17991805.
22) W. Y. Choo and J. Y. Lee:J. Mater. Sci.17(1982) 19301938.