Spray Degassing as a Method for Hydrogen Removal in Aluminum Melts
Ruizhi Wu
1;2, ZhiKun Qu
3, Baode Sun
2and Da Shu
21College of Materials Science & Chemical Engineering, Harbin Engineering University, Harbin 150001, P.R. China 2State Key Laboratory of Metal Matrix Composites (Shanghai Jiaotong University), Shanghai 200030, P.R. China 3
Department of Chemistry, Harbin Normal University, Harbin 150025, P.R. China
A continuous hydrogen-removal method from aluminum melt, spray degassing, is presented. The equilibrium equation of this method is discussed theoretically. Theoretical equilibrium analysis shows that the final hydrogen content of the melt is only affected by the purging gas flow rate and the melt mass flow rate. The hydrogen content of the outlet melt always contains a constant during the whole degassing time. The final hydrogen content of the melt decreases with increasing purging gas flow rate and increases with increasing melt mass flow rate. Compared with the rotary impeller degassing method, spray degassing consumes less treatment time and purging gas volume. Experiments were conducted using the method to remove the hydrogen in aluminum melt. The experimental results show that, the spray degassing is a good
hydrogen-removal method. [doi:10.2320/matertrans.48.1029]
(Received November 1, 2006; Accepted March 1, 2007; Published April 25, 2007)
Keywords: Spray degassing, hydrogen-removal, refinement, aluminum melt
1. Introduction
The hydrogen-removal in aluminum melt is an indispen-sable task before the melt is used to produce products.1)In
the aluminum industry, purging inert gases into the melt is a common degassing practice. Among all the degassing methods, the rotary impeller degassing method is the most popular in aluminum industry. The rotary impeller degassing is an environmental compatible method and has a relatively high degassing efficiency.2,3)
In rotary impeller degassing, hydrogen-removal efficiency mainly depends on the gas-liquid contact area and contact time between the purging gas and aluminum melt. Accord-ingly, small purging gas bubbles are desired in the degassing process. Increasing the rotor speed, decreases the purging gas bubble size.4–6)However, because hydrogen can be absorbed
from water-vapor in atmosphere during the degassing process, increasing the rotor speed will make the regassing become more serious.7,8) Therefore, the rotary impeller
degassing method can reduce the hydrogen content of the melt to only less than 0.1 cm3/100 g Al.9,10)
In order to improve the hydrogen-removal efficiency further, a new continuous degassing method, spray degass-ing, was presented.11) In this method, aluminum melt is atomized into small droplets and sprayed into ambient purging gas. During this process, the hydrogen in melt droplets can be easily brought out from melt by purge gas. After the spray degassing process, the purified melt droplets combine into melt flow again. In the spray degassing process, very tiny melt droplet size can be gained. This leads to a huge liquid-gas contact area between the purging gas and the aluminum melt. And there does not exist regassing in the spray degassing process because the melt droplets exist in an ambient purging gas and do not contact with the atmosphere. Therefore favorable degassing factors are provided in spray degassing method.
In the present paper, the hydrogen-removal equilibrium equation of the spray degassing method is discussed theoretically and is compared with that of the rotary impel-ler degassing method. The experiments using this method
to remove the hydrogen in aluminum melt are also con-ducted.
2. Theoretical Equilibrium Analysis of the Spray De-gassing Method
Initially, the partial pressure of hydrogen in purging gas is zero (PH2¼0), so the hydrogen in the melt droplets diffuses
into the purging gas. During this process, the hydrogen-content of the melt droplets ([pct H]) decreases and the partial pressure of hydrogen in the purging gas increases. According to hydrogen balance, the following equation can be con-structed:
qð½pctHi ½pctHfÞ
mH
¼2GPH2
P0
ð1Þ
From the analysis of the process of spray degassing, it is known that the partial pressure of hydrogen in the outlet purging gas will reach equilibrium with the initial hydrogen content of the melt if the degassing efficiency reaches its maximum value. According to Sievert’s law, the following equation will be satisfied:12,13)
½pctHi¼0:01K
ffiffiffiffiffiffiffiffi
PH2 p
ð2Þ
UsingCito substitute for the [pct H]iin equation (2):
Ci103
22:4 2¼K
ffiffiffiffiffiffiffiffi
PH2 p
Ci¼11:2103K
ffiffiffiffiffiffiffiffi
PH2 p
ð3Þ
Substituting equation (3) into equation (1) and substitut-ingCfor [pct H], the equilibrium equation becomes:
Cf ¼Ci
mHG
56K2P
0q
C2i ð4Þ
Equation (4) is the equilibrium equation of spray degass-ing. From the equation, it is known that the final hydrogen content of the aluminum melt (Cf) is affected by purging gas
flow rate (G) and melt flow rate (q). Figure 1 and Figure 2 respectively show numeric value of the final hydrogen content of aluminum melt under the condition of different
purging gas flow rate (G) and melt mass flow rate (q). The data used in the Fig. 1 and Fig. 2 are listed in Table 1.
It is known from the Fig. 1, the relationship between Cf
andGis linear. The final hydrogen content of the melt (Cf)
decreases with increasing purging gas flow rate (G). Figure 2 shows that, the final hydrogen content of the melt (Cf) increases with increasing melt mass flow rate (q). Under
the condition of the purge gas flow rate of 30 SCFH (standard cubic feet per hour), the melt mass flow rate should be less than 4.78 kg/s if the final hydrogen content of the melt is required to be less than 0.1 mL/100 g Al.
3. Comparison of Equilibrium Equations for Spray Degassing and Rotary Impeller Degassing
In rotary impeller degassing method, the equilibrium equation is:15)
1
Cf
1
Ci
¼ mHG
56K2MP
0
t ð5Þ
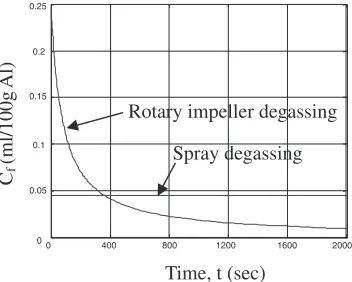
In rotary impeller degassing, the final hydrogen content of the melt is affected by the purging gas flow rate (G), the melt mass (M) and the degassing time (t). As the degassing time increases, the final hydrogen content of the melt decreases. In spray degassing, the time for the melt particles to move from the top to the bottom of the treatment tank is fixed. So the degassing time of each melt particle is fixed. The final hydrogen content of the melt is independent of time. This can be found in eq. (4) also. The hydrogen content of outlet melt always retains constant during the whole degassing time.
To compare the equilibrium equations between spray degassing and rotary impeller degassing, sample calculations for equations (4) and (5) are presented in Fig. 3. The data used in the sample calculations are given in Table 1.
From Fig. 3, it is known that, under the condition of same melt mass and purging gas flow rate, it takes 360 seconds for rotary impeller degassing to achieve the same final hydrogen content as that of spray degassing whose melt mass flow rate is 3.5 kg/s. To treat the same melt mass as rotary impeller degassing, the treatment time required for spray degassing is:
227=3:5¼65seconds
That is to say, under the sample calculations, to gain the same final hydrogen content of melt, the required treatment time ratio of rotary impeller degassing to spray degassing is 72 : 13. Accordingly spray degassing requires less treatment time and purging gas than rotary impeller degassing.
4. Experiments
The material used in the experiments is commercial purity aluminum. The experimental equipment is shown in Fig. 4. Aluminum was melted in a graphite crucible by an induction coil. The aluminum melt was sprayed by high-pressure gas (nitrogen) at the sprayer. Then the melt droplets were degassed by the purging gas (argon) in the treatment tank, which was kept at 750C by a resistance heater. The
processed melt flowed out of the treatment tank through a melt outlet and was collected in a small resistance furnace. The specimens for tensile test and metallographic analysis (for inclusions observation) were taken before and after spray
0 2 4 6 8 10 12 14
0 0.05 0.1 0.15 0.2 0.25
×10-6
G (k-mol/sec) Cf
(ml/100g Al)
Fig. 1 Relationship between purge gas flow rate and final hydrogen content of melt (in this calculation,q¼3:5kg/s).
5 10 15 20 25 30
0 0.05 0.1 0.15 0.2 0.25 q (kg/sec) Cf (ml/100g Al)
Fig. 2 Relationship between melt mass flow rate and final hydrogen
[image:2.595.81.260.72.210.2]content of melt (in this calculation,G¼10:53106k-mol/s).
Table 1 The data used in example calculations.
Symbols Values of parameters
Ci 0.25 mL/100 g Al
mH 1
K 1:2810414Þ
M 227 kg
G 10:53106k-mol/s (30 SCFH)
q 3.5 kg/s
P0 1 atm
0 400 800 1200 1600 2000
0 0.05 0.1 0.15 0.2 0.25
Time, t (sec) Cf
(ml/100g Al) Spray degassing
Rotary impeller degassing
Fig. 3 Comparison of equilibrium equation between rotary impeller
[image:2.595.340.516.73.214.2] [image:2.595.86.253.261.397.2] [image:2.595.46.292.463.564.2]degassing respectively. The hydrogen content of the melt was also measured before and after spray degassing respectively. The ultimate tensile strength and elongation of the as-cast specimens were measured on a WE-60 tensile-strength tester. The size of as-cast specimens was 1050mm. The fracture generated in the tensile-strength test was observed using EDAX-S-520 scanning electron microscope. The metallographic structure of the as-cast specimens was observed by OLYMPUS optical microscope and is analyzed with LECO image analysis software. An ELH-III type hydrogen analyzer, of which the precision is 0.01 mL/100 g Al, was used to measure the hydrogen content of the melt.
The experimental parameters are shown in Table 2, and the hydrogen content before and after the treatment is shown in Table 3 respectively. Table 3 demonstrates that the hydrogen removal effect of spray degassing is equal to or better than that of the present rotary degassing methods.
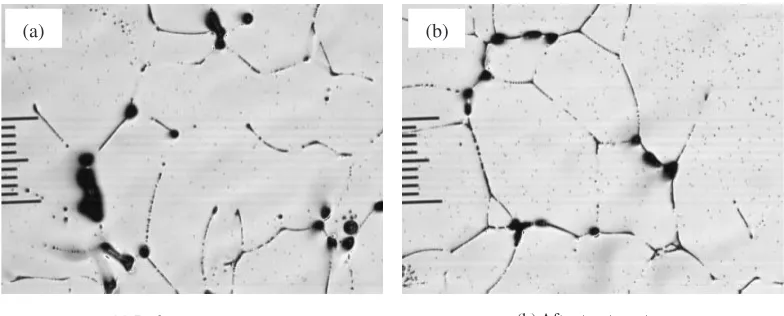
Metallographic observations are shown in Fig. 5. Statistic analysis revealed that the inclusion content percentages were respectively 0.081% and 0.093%. These results show that the spay degassing method does not affect the inclusion content of the melt.
The mechanical properties of as-cast specimens are given in Table 4, which suggests that the ultimate tensile strength and elongation percentage of the specimens are low, because the inclusions are not removed from the melt. However, the spray degassing process improves the ultimate tensile strength and elongation percentage of the specimens.
The scanning electron microscope photographs of speci-men fracture are shown in Fig. 6. It is found that there are inclusions and large porosities in the specimen fracture before the treatment. The fracture mechanism is the cleavage fracture mode that is caused by porosities, inclusions and shrinkage cavities. In contrast, there is almost no porosity in the specimen fracture after the treatment. The fracture mechanism is a typical microvoid coalescence fracture mode.
5. Conclusions
The equilibrium equation of spray degassing can be expressed as equation (4). The final hydrogen content of the melt is affected by only the purging gas flow rate and the melt mass flow rate. The hydrogen content of the outlet melt always contains a constant during the whole degassing time. The relationship between final hydrogen content of melt and purge gas rate is linear. The final hydrogen content of melt Purge gas
Hydrogen detection 1
2
3
4 Melt outlet
Hydrogen detection
Nitrogen gas
Fig. 4 Equipment of melt experiments: 1. crucible; 2. sprayer; 3. the
[image:3.595.69.269.71.265.2]treatment tank; 4. small furnace for hydrogen detection.
Table 2 Experimental parameters.
Items Parameters
Experimental material Commercial pure aluminum
Melt mass (kg) 1
Spraying gas pressure (MPa) 0.2
Purging gas flow rate (l/min) 10
Melt flow rate (kg/s) 0.1
[image:3.595.307.549.84.174.2]Temperature (C) 750
Table 3 Hydrogen content of the melt.
Before treatment (mL/100 g Al)
After treatment (mL/100 g Al)
0.25 0.08
0.24 0.07
0.24 0.08
(a) Before treatment (b) After treatment
(a) (b)
[image:3.595.305.550.211.274.2] [image:3.595.101.493.601.759.2]decreases with the increase of purge gas flow rate. The final hydrogen content of the melt increases with increasing melt mass flow rate. Spray degassing consumes less treatment time and purging gas than rotary impeller degassing. Under the same conditions, to gain the same final hydrogen content of melt, both the required purging gas volume and the treatment time ratios of rotary impeller degassing to spray degassing are72 : 13. Experiment results show that the spray degassing method exhibits superier hydrogen-removal in the aluminum melt and does not affect inclusions in the aluminum melt.
Acknowledgements
The work was supported by Harbin Engineering University Fundamental Research Funding Project (002100260739).
REFERENCES
1) R. Z. Wu, B. D. Sun, H. J. Ni,et al.: J. Mater. Sci.39(2004) 2867.
2) A. R. Robert: JOM5(1997) 16.
3) A. C. Kevin and J. H. Michael: Light Metals (2001) 1017.
4) B. Marc, O. Thierry, A. Micheal and L. B. Pierre: Light Metals (2002) 861.
5) T. S. Shih and K. Y. Weng: Mater. Trans.45(2004) 1852.
6) R. Z. Wu, D. Shu, B. D. Sun, J. Wang,et al.: Trans. Nonferrous Met. Soc. China15(2005) 1130.
7) S. T. Johansen, S. Graadahl, P. Tetlie and B. Rasch: Light Metals (1998) 805.
8) L. B. Pieer: Light Metals (2002) 869.
9) J. F. Peter, J. W. Mccollum and A. F. Robert: Light Metals (2001) 1041. 10) D. W. Peter: Light Metals (1998) 791.
11) R. Z. Wu, D. Shu, B. D. Sun, J. Wang,et al.: Mater. Sci. & Eng. A408
[image:4.595.115.483.71.499.2](2005) 19.
Table 4 Ultimate tensile strength and elongation percentage of the
specimens.
Tensile strength(MPa) Elongation(%)
Before treatment 50.3 37.2
After treatment 62.2 53.3
(a) (b)
(c) (d)
[image:4.595.45.292.567.608.2]12) A. M. Samuel and F. H. Samuel: J. Mater. Sci.27(1992) 6533. 13) T. A. Engh: Light Metals (1984) 1329.
14) G. K. Sigworth: AFS Transactions81(1987) 73.
15) G. K. Sigworth and T. A. Engh: Metall. Trans. B13B(1982) 447.
Appendix
[pct H]i Initial hydrogen-content of melt droplets, mass
percentage
[pct H]f Final hydrogen-content of melt droplets, mass
percentage
mH Atomic weight of hydrogen, g/mol
q Melt flow-rate, kg/s
G Purging gas flow-rate, k-mol/s
PH2 Partial pressure of hydrogen in outlet purge gas,
atm
P0 Pressure of purging gas, atm
K Sievert’s constant
Ci Initial hydrogen-content of melt droplet, cm3/100 g
Al
Cf Final hydrogen-content of melt droplets, cm3/100 g
Al
M Mass of treated melt in rotary degassing method, kg