Abstract—There were extensive researches on the topic of performance management in various organizations across multiple fields. Literature on performance measurements in logistics can be divided into specific measures and their application in the context or complete framework for performance measurements. In this paper, the focus of the discussion will be the formulation of the framework which handles performance measurements for package delivery service and how the metrics measure the performance and their application in the context of package delivery service.
Index Terms—Analytics, SERVQUAL, Performance Management, Parcel, Logistics
I. INTRODUCTION
ackage delivery services play an important role in providing communications and transfer of items in an economy. The traditional postal service of physical delivery of communication items such as mail has been superseded by package delivery, courier services and other auxiliary services. The privatization movement has changed the postal service where public postal services are deregulated and forced to compete with one another. The decline of physical post service and deregulation has forced the postal service to evolve competitively with strong focus on the market and customer needs. While pricing remains a powerful tool in maintaining competitive edge, package delivery services requires other qualitative factors to achieve the edge [1][9].
Due to the market potential of the package delivery service, proper performance measurement is needed in order to improve the overall service level. Many postal companies around the world have been implementing new approaches to support innovative operational practices that maintain or improve their market share [4]. The parcel delivery service consists of carriers that transport items that can be handled by one person [14]. In the context of logistics, the parcel delivery service is commonly considered as part of third-party service provider that ensures a smooth movement of goods within the supply chain [19]. Benchmarking techniques such as analytic hierarchy process are popular as they are able to incorporate both qualitative and quantitative measures. However, the qualitative aspects of the
Manuscript received Feb 22, 2013; revised Mar 30, 2013.
Murphy Choy. Author is with the School of Information System, Singapore Management University (e-mail: [email protected]).
Koo Ping Shung. Author is with the School of Information System, Singapore Management University.
Ma Nang Laik Author is with the School of Information System, Singapore Management University
methodology require a well thought framework in order to ensure consistency. While benchmarking approaches appear to be quite popular, the performance measurement approach remains widely popular among the practitioners. This approach is well suited to the postal delivery service which has strong service level agreement that can be used to drive service performance. The choice of service providers is strongly dependent on the service qualities provided by the service providers [3][19]. The key factors include the ability to maintain and maximize level of service, increasing the service coverage provided, and niche market specialization.
There were research that demonstrated service quality improvement is a must [6] for any providers to attain competitive advantage and failure to do so would lead to competitive disadvantages [8]. Thus, any approaches towards effective service quality will correlate with good performance for any service industries and are measured to gain customer satisfaction [15]. In this paper, we will be adapting the SERVQUAL model to measure customer satisfaction towards service quality and relate them to performance measurements [12][15].
II. SERVQUAL MODEL AND CUSTOMER SATISFACTION Services are intangible [2] due to them being performances instead of physical objects. Precise specifications for the performances do not work in the same way as the specifications set in physical goods. Services cannot be counted, measured directly or tested ahead for quality assurance. Unlike physical goods which operate independent of the environment, performance of services can be subjected to environment changes which necessitate adaptations to deliver the service. The intangibility of services makes it difficult for service providers to evaluate their service quality and how well they performed [20].
Services are also highly dependent on the delivery of the service. As services are performances, they are ultimately dependent on the service provider which involves human labour. The heterogeneous nature of human labour as well as human interactions makes the the consistency of the delivery of the services difficult to measure. The human factor also creates a layer of uncertainty between the intended service delivery and the actual service delivered.
Lastly, services are produced and consumed simultaneously [7][18]. Due to this simultaneous nature, quality in services cannot be created at production and then delivered to the consumer separately. The delivery requires human interactions which is very difficult to control [11]. Even if the delivery of the service is well controlled due to
Performance Measurement Design for a Parcel
Delivery Company
Murphy Choy, Ma Nang Laik and Koo Ping Shung
excellent delivery training, the consumers' participation in the delivery process can affect the final service delivery quality. The consumer's aspect becomes even more important in the cases where consumer's participation is needed to complete the delivery.
In the literature discussions [10][11], there are several main themes:
1. Service quality evaluations are complex and difficult for the consumer than goods quality evaluation.
2. Service quality evaluations are the result of comparing consumer expectations with actual service performance.
3. Service quality evaluations involve both the process of delivery and outcome of a service. Given the lack of physical and tangible aspects to evaluate service quality [13][16][20], the usual tangible aspects are limited to physical facilities, equipments and personnel. While price is commonly considered to be the pivotal quality indicator in cases where other information is not available, it is not considered to be the main quality indicator or performance indicator. Because of the lack of tangible aspects to evaluate quality, the measurement of quality is therefore tenuous. Some researchers have attempted to measure the gap between expectations and performance as a way to establish service quality. Others measure the quality by evaluating whether the performance has met the expectations [5][17].
The SERVQUAL model is developed [15] to address some of the gaps in the research. The model has 10 major characteristics.
Reliability is defined as the measure of consistency in terms of performance and as well as the dependability. This measure has several interpretations. It could be defined as the firm performing the service right without repeats or the firm honoring its promises. The measures most commonly related with this characteristic are accuracy and timeliness.
Responsiveness is defined as the willingness of the labour to provide services. This measure is strongly related to the timeliness concept used in the previous characteristic with some minor changes. Instead of timeliness, the concept should be the speed of reaction to external stimuli. Common measures for this characteristic are turnaround time and reaction time.
Competence is referred to the acquisition and retention of the skills and knowledge necessary to perform the service. This measure comprises of two components, the first component is the knowledge and the second component is skill. In order to perform any service, the labour must be equipped with the right knowledge. The right knowledge does not guarantee smooth delivery and good delivery requires skill.
Access is referred to ease of contact. This is again another measure of timeliness. Unlike the previous measure, this
measure of timeliness refers to the amount of waiting time. If you make any customer wait too long, they will go away.
Courtesy is referred to as the appropriate protocol for customer engagement. The measure may include items such as politeness or friendliness. Any rude or unruly service provider will naturally incur the wrath of customers. However, cross-cultural issues and conflicts may be referred to as a courtesy issue. This is common when the parties have different cultural practices. Courtesy can also refer to image of the company or the labour.
Communication refers to the continuous engagement of the customers in the preferred language. The company has to make sure the services are well explained and that the terms and conditions are understood by the customers. The measure involves the number of language mismatch. The secondary measure is the ease of understanding. Even with the right language, we cannot ensure good understanding of the service and we can measure the number of incidents involving miscommunications.
Credibility refers to the trustworthiness and honesty of the organization. The measure is usually some factors involving the company name or reputation. This is extremely difficult to measure and the most common measure is the number of complaints received. With the advent of social media, the channel has contributed greatly to the measurement of credibility.
Security is defined as the risk – free level. This measure is defined by the probability of loss or stolen items. This can be tracked using lost items. With new data protection acts, the risk has been extended to data privacy issues which need proper data security framework.
Know your customer is an important aspect of business and it is usually defined as understanding the customer's need. This is commonly measured by the amount of information that the organization keeps about the customer as well as analysis done on the behaviour of the customer. Alternatively, it can be measured by how often an update is done on a customer record.
While services do not usually have tangibles, occasionally tangibles such as facilities for the service, receipts and other physical items are considered tangibles. These are measured by customers' reception of them.
The paper is structured with the following sections. In the next section, we attempt to link these measurements of quality with performance measures. In section 4, we discuss about the measures and how they can be implemented. Section 5 discusses the case study and section 6 presents our conclusions.
model has defined 10 characteristics that are related to quality and we will be transforming these characteristics to drive performance in package delivery services.
Reliability in package delivery service can be defined as timeliness of the delivery. In most package delivery service, there is a concept of time to deliver which is a form of service level agreement with the customer. Reliability can also refer to the confidence in the delivery before deadline. Reliability can also refer to the confidence in the final delivery. One common measure of reliability of package delivery is the measurement of how many packages that reached the final destinations. Another alternative measure is the number of packages who were sent to wrong destinations. Both measures effectively focused on the final outcome of the delivery and whether the delivery is correct or wrong. Thus reliability embodies many aspects of the performance and quality.
Responsiveness for package delivery service can be defined as speed that the labour can pick up and deliver the package. As mentioned in the earlier section, the measure has relations with the concept of timeliness and more of a reaction time to external stimuli. In this case, the measure would be the measurement between the time of contact to time of package collection or from point of collection to point of delivery. Both measure important information about the performances. The first measure will determine the reaction time to any package delivery request which can be perceived by the customer as the eagerness to engage them as well as their importance. The second measure is basically another form of measure for reliability but can be perceived as the importance of the package to the delivery provider.
The two separate and distinct components of competence require more thorough formulation of measures. The knowledge measure is something that is both internal and external. The internal aspect of the knowledge involves the understanding of the knowledge and how it can be used. This aspect can be tested using tests during training sessions and the scores can then be used as a measure. The external aspect of knowledge can be determined by the capability of the labour to answer any questions directed professionally. This can be measured as an external measure by deriving the number of complaints against any labour for incorrect or insufficient explanations. The skill component can be tested by the number of complaints received for any labour with regards to the management of the delivery process.
Access is referred to ease of contact with the labour and service provider. This measure of timeliness refers to the amount of waiting time for the labour or service provider to react. Too much waiting or extended period of lack of feedback can result in severe frustration for the customers.
Courtesy refers to the appropriate protocol for customer engagement which is usually a subsection of knowledge. The measures include items such as politeness or friendliness towards the customer. Any rude or unruly labour will naturally incur the wrath of customers that will result in complaints and a direct measurement of the
etiquette of the labour. The complaints can be through various channels such as phone calls or even complaints on twitter and social media.
Communication in this context refers to the continuous updating of the package delivery status to the customer using the proper medium and language. This measure can be evaluated through the number of complaints received. Constant feedback is also critical and this can be measured by the frequency of the updates to the customer which acts as reassurance of the delivery situation. Communication measures can also be defined as the number of customer call in inquires for a single package.
Security in the context of package delivery service refers to the security of the package. This measure can be defined by the extent of damage to the package. The customers would naturally assume that the packages are well protected and handled gently. Any packages experiencing serious damages would be considered less than acceptable and that no proper security was in place to protect it. The even more serious problem would be the case where the object is opened during the delivery which would imply a breach of security. This kind of incident will require proper investigation. Another possible security issue is the likelihood of improper delivery which resulted in lost packages. These cases are mainly due to labour committing fraud or delivering the goods in an inappropriate manner. Both cases can be measured using complaints.
Credibility, Know your customer and tangibles are aspects of the quality which are not directly applicable in the package delivery service. Any service provider without credibility will not even receive the basic license to provide the service. Package delivery services usually handles customers who are not entirely regular and on ad-hoc basis making it difficult to produce any interesting analysis of the customer's behaviour. As package delivery has no tangibles, there are no tangibles for comparison.
IV. PERFORMANCE MEASURES AND IMPLEMENTATION The most useful performance measures are only as powerful as the data driving it. Any proper performance measure implementation requires careful evaluations of the data quality as well as the data content. Improper use of the data to construct the performance measures would result in biases and inaccuracy which might affect the true view of the performances. To ensure good understanding of the measures, we will be defining the various measures and the factors which they correspond to in SERVQUAL framework.
Let i be the package i for delivery ,
∀
i
∈
{
1,
…
, I
}
Let d
ibe the intended destination for package i
Let e
ibe the actual destination for package i
Let s
ibe the starting location for package i
Let t
sibe the pick up time for packagei at starting location s
iReliability in package delivery service has been defined using several measures. The first measure refers confidence in the delivery before deadline. This measure can be construed as the proportion of deliveries delivered before the final service level agreement deadline.
Reliability can also refer to number of packages that reached the final destination d.
The alternative measure is the number of packages who were sent to wrong destinations. This alternative measure can be calculated as the number of packages that went to a wrong destination or the maximum number of wrong destinations for any package. The first measure is the complement of the previous measure.
The second measure is as below.
Both measures are effective in measuring the final outcome of the delivery although the second measure in this case is not normalized and cannot be compared easily. Good performances in these measures will indicate excellent service quality as well as performances.
Responsiveness has been defined as speed that the labour can pick up and deliver the package. The more appropriate measure would be the measurement between the time of contact to time of package collection. The measure can be perceived by the customer as a form of engagement. The measure is defined as follow
Measuring competency is very difficult for both the internal and external competency. As mentioned in the previous section, we discussed about the use of tests to validate the internal aspects of the knowledge. While this is easily achievable, it is unclear how the test results will correlate to knowledge. The more appropriate and long term measure is a mixture of both test results and training period provided. The first measure of exam results can be separated into short term, midterm and long term test period. Given that it is period based testing, the measure can be weighted according to the period in the prior testing. The most common weighted moving average is the exponential weighted moving average. Thus we can apply the concept to the measure.
Competency can be calculated as the average number of training days in the past u time period.
External measures are harder to measure due to the inability to extract the required information easily. To measure knowledge in the external aspect, we can track the number of cases of complaints about the labour's lack of knowledge. A simple and effective measure of competency will be to calculate the number of complaints in the last u time periods.
The measure can be broken down into complaints about the lack of product knowledge and situations which can be attributed to lack of skills. The latter can then be used to measure the skill level of the labour. All the remaining measures such as Access, Courtesy and Communication can be measured in the same manner.
Let t
cibe the contact time for packagei
Let tibe the expected delivery time as defined
by the service level agreement for package i
Let kibe the expected pick up time as defined
by the service level agreement for package i
Let xibe the binary variable for delivery within the agreed service level time as defined below
xi= {
1, ∀ i ,(td
i−tsi≤ti)
0, otherwise
Let yibe the binary variable for correct delivery final destination ,
yi= {
1, ∀ i ,(ei=di)
0, otherwise
Let zibe the binary variable for pick up within
the agreed service level time as defined below
zi= {
1, ∀i ,(tsi−tci≤ki)
0, otherwise
Reliability=
∑
i=1I
xi
I
Reliability=
∑
i=1I yi I
Reliability=1−
∑
i=1 Iyi
I
Reliability=MAX(I−
∑
i=1
I yi)
Responsiveness=
∑
i=1I
tc
i−tsi
I
Let u bethe time period , u
∈
{
1,
…
,U
}
where
1
is the latest period , U is the oldest period
Let g
ube the score for time period u
Let a be the weight
Competency
=
a
(
g
1+(
1
−
a
)
1g
2+…+(
1
−
a
)
(u−1)
g
u)+(
1
−
a
)
(u)
g
uLet mube the number of training days for period u ,
Competency=
∑
u=1U
mu
U
Let r
ubethe number of complaints received for period u ,
Competency=
∑
u=1U
ru
Security can be measured in terms of the proportion of damaged goods or the amount of compensation for damaged goods.
For the case of compensation, we can calculate the average compensation for the last u time periods.
In the next section, we will discuss about some of the measures described here and how they are implemented in the next section.
V. CASE STUDY: SERVICE DELIVERY COMPLIANCE PERFORMANCE REPORT
[image:5.595.51.286.504.640.2]The service package provider needs a performance report on their package delivery service. The provider believes that the existing business process is inefficient and merit further investigation. To facilitate their investigation and improve the performance, they need a report which incorporates all the quality measures that are relevant. However, the database has limited information and certain aspects of quality service such as customer complaints are not recorded. The level of compliance with the existing process is also a mystery to the management and they wish to motivate the labour to comply with the business process.
Fig. 1 illustrates the overview of the service type for outbound service – to deliver the item out of the country is shown above.
Using the SERVQUAL framework and the relevant measures, we will attempt to develop a performance report that incorporates the information. The information provided includes the time stamp for each stage of delivery for any packages. Thus we have the time information. The data base also provides the ending process which indicates whether the item has been delivered to the right destination or there was a delivery failure. These two information can be used to generate measures that relate to reliability, security as well
as responsiveness.
To measure reliability, we have to consider the appropriate measures to be used. Given that some of the package services have time limits, we can use the measure that calculates the number of deliveries on time. At the same time, since we know the starting time and ending time for each delivery, we can also estimate the maximum and minimum time for the particular business process. In terms of security, we can observe the start and end status as well as validating the existing process according to the business process map for the operation. Using the measures, we came up with the following measures.
1. # Occurrence 2. Start Status 3. End Status 4. Mean time taken 5. Min time taken 6. Max time taken 7. Is the process correct? 8. % SLA satisfied
These measures however, only measure the performance of the labour at the process level and do not represent the entire business operations. However, they do provide insights into business processes which are taking too long, lapse in process compliance or have poor service level agreement fulfilment levels. At the aggregated level for the different business processes, we have the following information as the measures.
1. Type of Service 2. No of Items
3. No of failed delivery 4. No of Delivered Items
5. No of Items considered delivered 6. Average length of process 7. Average time in Hours 8. Maximum time in Hours 9. Minimum time in Hours
At the service level, the measures of failed deliveries and length of process add additional dimensions giving us additional insights to the reliability as well as responsiveness of the various services. Applying the measures to the company, we modified the report to reflect the data that is available for use. Using the information, we develop the following report.
Service
Type
Process Flow occurrence# % StatusStart StatusEnd
Mean time taken (Hr)
Min Time take n (Hr)
Is the proce ss corre
ct % SLA satisfied?
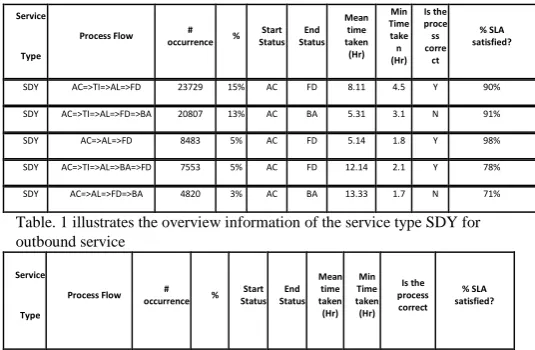
[image:5.595.297.565.604.779.2]SDY AC=>TI=>AL=>FD 23729 15% AC FD 8.11 4.5 Y 90% SDY AC=>TI=>AL=>FD=>BA 20807 13% AC BA 5.31 3.1 N 91% SDY AC=>AL=>FD 8483 5% AC FD 5.14 1.8 Y 98% SDY AC=>TI=>AL=>BA=>FD 7553 5% AC FD 12.14 2.1 Y 78% SDY AC=>AL=>FD=>BA 4820 3% AC BA 13.33 1.7 N 71%
Table. 1 illustrates the overview information of the service type SDY for outbound service
Service
Type
Process Flow #
occurrence %
Start Status
End Status
Mean time taken
(Hr) Min Time taken (Hr)
Is the process correct
% SLA satisfied?
Let fibe the binary variable for damaged ,
fi= {
1, package i is damaged
0, otherwise
Security=
∑
i=1I
fi
I
Let w
ube the compensation amount for period u ,
Average Compensation=
∑
u=1U
wu
U
0 5 10 15 20 25 30
SDY NOR REG TWC SDC TIC 1HR AIP TWP URP 3HR
Ot
h
ers
Sh
ar
e
o
f th
e
Ou
tb
o
u
n
d
Se
rv
ic
e
s(%
)
1 HR AC=>AL=>FD 10186 36.3% AC FD 0.61 0.21 Y 99%
1 HR AC=>AL=>FD=>BA 9569 34.1% AC BA 0.63 0.22 N 98%
1 HR AL=>FD 2952 10.5% AL FD 0.63 0.25 Y 98%
[image:6.595.45.541.40.665.2]1 HR AL=>FD=>BA 2903 10.3% AL BA 0.72 0.30 N 99%
Table. 2 illustrates the overview information of the service type 1HR for outbound service
Service
Type
Process Flow #
occurrence %
Start Status
End Status
Mean time taken (Hr)
Min Time taken (Hr)
Is the process correct
% SLA satisfied?
3 HR AC=>AL=>FD 4104 35% AC FD 2.531 1.12 Y 95% 3 HR AC=>AL=>FD=>BA 3781 33% AC BA 3.566 1.85 N 81% 3 HR AL=>FD 1249 11% AL FD 2.781 1.91 Y 98% 3 HR AL=>FD=>BA 1229 11% AL BA 2.113 1.31 N 97%
Table. 3 illustrates the overview information of the service type 3HR for outbound service
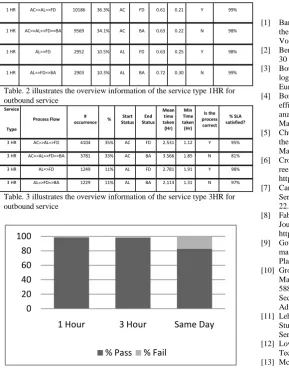
Fig. 2 illustrates the overview failure rate of the service type for outbound service
The report gave much insight to the operation of the company. Among all the services, we have chosen SDY, 1 HR and 3 HR service types which have contributed to about 40% of the total service types and show the detail of the performance report. The first few findings include the appearance of process flows which do not conform to the existing processes. The report also gave insights to the percentage of deliveries made within the SLA limits. Additional insights were derived from the delivery time as well as the number of times an illegal process was found. These information gave insights on the sources of problem and how much impact they are having on the operation.
VI. CONCLUSION
The SERVQUAL framework can be modified to formulate performance measures which can be used to drive performance. In this paper, we have demonstrated the various facets to performance measures and how they are related to quality measures. The research has also narrowed the scope of the various measures to the key performance measures as well as formulating the various formulas and calculations needed to arrive at the measures. The paper also demonstrated in a small case study on how the various measures can be applied both at a business process level and an aggregated service level. Hopefully, this paper will prompt more research in the relations between quality and performance in package delivery services.
REFERENCES
[1] Bard, J.F., Binici, C. and deSilva, A.H. (2003), “Staff scheduling at the United States postal service”, Computers & Operations Research, Vol. 30 No. 5, pp. 745-71.
[2] Berry, LeonardL. (1980), "Services Marketing Is Different," Business, 30 (May-June), 24-28.
[3] Bourlakis, M. & Melewar, T.C. (2011). Marketing perspectives of logistics service providers: Present and future research directions. European Journal of Marketing, 45(3), 300 – 310.
[4] Borenstein, D., Becker, J.L. and Prado, V.J. (2004), “Measuring the efficiency of Brazilian post office stores using data envelopment analysis”, International Journal of Operations & Production Management, Vol. 24 No. 10, pp. 1055-78.
[5] Churchill, G. A., Jr., and C. Suprenaut (1982), "An Investigation into the Determinants of Customer Satisfaction," Journal of MarketingResearch, 19 (November), 491-504.
[6] Cronin, J. & Taylor, S. (1992). Measuring service quality: a reexamination and extension, Journal of Marketing, 56(3), 55-68. http://dx.doi.org/10.2307/1252296
[7] Carmen, James M. and Eric Langeard (1980), "Growth Strategies of Service Firms," Strategic Management Journal, 1 (January-March), 7-22.
[8] Fabien, L. (2005). Design and implementation of a service guarantee. Journal of Services Marketing, 19(1), 33-38. http://dx.doi.org/10.1108/08876040510579370
[9] Gouveˆa, M.A., Toledo, G.L. and Filho, L.N.R. (2001), “The prices of mailing services evaluated by companies”, Marketing Intelligence & Planning, Vol. 19 No. 4, pp. 282-94.
[10] Gronroos,Christian(1978), "A Service-Oriented Approach to Marketing of Services," European Journal of Marketing, 12 (no. 8), 588-601. (1982), Strategic Management and Marketing in the Service Sector, Helsingfors: Swedish School of Economics and Business Administration
[11] Lehtinen, Uolevi and Jarmo R. Lehtinen (1982), "Service Quality: A Study of Quality Dimensions," unpublished working paper, Helsinki: Service Management Institute, Finland OY
[12] Lovelock, C.H. & Wirtz, J. (2004). Services Marketing: People, Technology, Strategy (5th ed.). Englewood Cliffs, NJ: Prentice Hall. [13] McConnell, J. D. (1968), "Effect of Pricing on Perception of Product
Quality," Journal of Applied Psychology, 52 (August), 300-303. [14] Morlok, E.K., Nitzberg, B.F., Balasubramaniam, K. & Sand, M.L.
(2000). The parcel service industry in the U.S.: Its size and role in commerce. School of Engineering and Applied Science, University of Pennsylvania, Philadelphia, PA. Retrieved November 26, 2011 from http://www.seas.upenn.edu/sys/logistics/parcelstudy.html.
[15] Parasuraman, A., Zeithaml, V. A. & Berry, L. L. (1985), A Conceptual Model of Service Quality and Its Implications for Future Research. Journal of Marketing, 49(4), 41 – 50. http://dx.doi.org/10.2307/1251430
[16] Olander, F. (1970), "The Influence of Price on the Consumer's Evaluation of Products," in Pricing Strategy, B. Taylor and G. Wills, eds., Princeton, NJ: Brandon/Systems Press.
[17] Smith, Ruth A. and Michael J. Houston (1982), "Script-Based Evaluations of Satisfaction with Services," in Emerging Perspectives on Services Marketing, L. Berry, G. Shostack, and G. Upah, eds., Chicago: American Marketing, 59-62.
[18] Upah, Gregory D. (1980), "Mass Marketing in Service Retailing: A Review and Synthesis of Major Methods," Jour- nal of Retailing, 56 (Fall), 59-76.
[19] Vijayvargiya. A, & Dey, A.K. (2010). An analytical approach for selection of a logistics provider. Journal of Management History, 48(3), 403 – 418.
[20] Zeithaml, Valarie A. (1981), "How Consumer Evaluation Processes Differ between Goods and Services," in Marketing of Services, J. Donnelly and W. George, eds., Chicago: American Marketing, 186-190.
0 20 40 60 80 100
1 Hour 3 Hour Same Day
[image:6.595.43.333.48.417.2]