MASTER THESIS
EXPLORING THE EFFECT OF
DESIGN EFFICIENCY IN
INDIVIDUAL PREFERENCE
ESTIMATION
Operationalizing reliability, validity and feasibility of a
value clarification exercise in both efficient- and
D-efficient experimental design to determine the optimal
number of choice tasks
AUTHOR
Evelien Welhuis
DEPARTMENT OF HEALTH TECHNOLOGY AND
SERVICES RESEARCH
EXAMINATION COMMITTEE
Dr. J.A. van Til
M.G.M. Weernink, MSc
2016
CONTENTS
ABSTRACT ... 3
INTRODUCTION ... 4
Theoretical framework ... 5
METHODS ... 6
Clinical decision ... 6
Selection of attributes and levels ... 7
Experimental design ... 7
Study population ... 7
Survey and data collection ... 8
Statistical analysis ... 8
RESULTS ... 8
DISCUSSION ... 10
Strengths and limitations ... 12
Implications and recommendations for clinical practice ... 12
REFERENCES ... 14
ABSTRACT
Background: In recent years there is an increase in treatments available for patients to manage their disease. Some treatments consist of preference sensitive decisions, where the evidence for the superiority of one treatment over another is either not available or does not allow differentiation. Due to that, both clinician and patient
experience difficulties in choosing one treatment option, resulting in an increasingly more complex decision making process. To face this problem, decision support tools including value clarification exercises (VCEs) are increasingly used. They help patients making their preferences explicit in their trade-off between pros and cons in treatment options and to enable shared decision making. Yet, it is still unclear what design is best to achieve the most reliable, valid and feasible individual preference estimation.
Objective: The aim of this study is to investigate to what extent an efficient– and D-efficient design of a VCE based on Best-Worst-Scaling Case 2 (BWS-2) are affecting reliability of preference estimates, validity of treatment
preference and feasibility of a preference survey questionnaire.
Methods: A sample of the general population, men and women aged 18-80 years, completed a VCE based on BWS-2 exploring their preferences with regard to underlying attributes of a clinical decision (treatment for localized prostate cancer or breast cancer). A fully balanced and orthogonal fractional factorial design was used as basis for the experimental design of the questionnaire. The fractional set of 16 scenarios was divided in three blocks with respectively 6, 6 and 4 choice tasks. Informative introductions and evaluative questions in-between the sections were included as well. This structure was used to operationalize reliability, validity and feasibility in both an efficient- and D-efficient experimental design.
Results: Results showed that answering more than 12 choice tasks was not feasible for respondents, due to an increase in cognitive burden and less willingness to answer additional choice tasks. Response time decreased with the number of choice tasks. Predicted preferences and differences in preference for treatments showed a tendency towards smaller preference for one treatment after answering 12 choice tasks. Decision congruence between stated- and final preferences showed a significant interaction with 75% respondents’ agreement. In addition, a small increase in preference certainty was indicated.
Discussion: The main findings indicate that a VCE should be limited to 12 choice tasks, with regard to feasibility. The results of reliability and validity indicated no strong evidence in providing an optimal number of choice tasks. Experimental designs are arguably important in the design phase of a VCE, due to its major influence in the trade-off between statistical efficiency and response efficiency. In particular selecting attributes and levels and generating the design needs to be carefully considered in further research, needed to refine the VCE and determine what method and choice design fits best in clinical context in order to ensure reliable and valid estimates.
INTRODUCTION
In clinical practice, physicians find it hard to adequately assess patient values for outcomes of care [1], nor can they accurately predict how pros and cons of
treatments are evaluated from the patient’s points of view [2]. Research has shown that patients prefer to take on a more active role in health care decisions [3]. However, due to lack of providing- and obtaining information in the decision process between the physician and patient, clarity in process and outcome is failing in decision making. Hence, there is need for shared decision making. Elwyn et al. (2010) defines Shared Decision Making (SDM) as “An approach where clinicians and patients share the best available
evidence when faced with the task of making decisions, and where patients are supported to consider options, to achieve informed preferences” [4]. Decision making has become a more complex process for both clinicians and patients, because there are a variety of treatments available that carry different risk-benefit profiles. This complex process occurs particularly in preference-sensitive decisions, where the evidence for the superiority of one treatment over another is either not available or does not allow differentiation [5]. Due to lack of evidence in preference-sensitive decisions, uncertainty about the best course of action increases [6]. For patients, various decision support tools, such as decision aids, are developed which can help them to participate in health decisions. These tools provide information about the pros and cons of treatment options and help patients become more involved by making the decision explicit [7]. Despite the abundance in patient information materials, the exploration and incorporation of patient preferences is difficult for both physicians and patients. Patients need support to find out what question they should ask to provide
themselves with complete information about benefits, risks and trade-offs that have to be made for a well-informed treatment decision. To help elicit patients’ treatment values and provide explicit value clarification to support patients make well-informed decisions, value clarification methods or exercises (VCMs or VCEs) are increasingly incorporated into decision aids. They make
patients aware of their own personally held values in comparing available choice options. Fagerlin et al. (2013) defined “values clarification method” as “Strategies that are intended to help patients evaluate the desirability of options or attribute of options within a specific decision context, in order to identify which option he/she prefers” [8]. Fagerlin et al. concluded in their systematic review that at present there are no best practices established for value clarification and either many VCMs are not based on any decision theory or are not reported [8, 9].
A method that has a strong theoretical basis is ‘conjoint analysis (CA)’, which can be defined as a general approach for measuring stated preferences of respondents for goods and services (i.e. health care interventions or treatments). CA refers to preferences or value trade-offs for a set of alternatives that were pre-specified in terms of levels of different
(most and least preferred) from a set of three or more items. BWS consists of three types: best worst object scaling (case 1), best worst attribute scaling (case 2) and best-worst multi profile scaling (case 3). Case 1 involves asking the best and worst object, which can be used to determine relative importance of attributes [14]. In contrast to case 1, case 2 shows only the levels. The same attributes appear in each choice task, while their levels change. In case 3, respondents choose between alternatives that include all the attributes, with their levels varying in a sequence of choice sets (also called a best-worst-discrete choice experiment). Considering all conjoint methodologies, ACA has the advantage that paired comparisons are increasingly tailored to what participants consider relevant trade-offs. However, when patients are doubtful in the start of the questionnaire, the adaptive method may lead to unreliable results. Another issue is whether the prior estimates are sufficiently accurate in themselves to be able to appropriately guide the design [15].
Researchers are limited in DCE and BWS with regards to the number of attributes and levels to include, as the choice tasks quickly become too large, complex and time-consuming for respondents [16]. Subsequently, this limitation has consequences for the efficiency of experimental design, that is, whether the design is optimal. The number of choice tasks asked in each choice set is more in BWS-3 compared to DCE, but the cognitive burden is less than asking them to evaluate additional choice sets and asking for the best in each, which is the case in DCE [17]. Some authors argue that BWS also reduces cognitive burden of the task
because the BWS task seem easier to understand for people [18 potoglou best-worst scaling, 19, 20]. In this study, we aimed to develop a VCE based on BWS case 2 to be used in a decision aid supporting treatment choice for localized prostate cancer and breast cancer. Decisions made in the design phase with regard to task design and experimental design may affect the reliability of preference estimates, validity of treatment preference, and feasibility of the preference survey questionnaire. To investigate this, the following research question is formulated:
What is the effect of an efficient- and D-efficient design in stated preferences survey on the reliability of preference estimates, validity of treatment preference and feasibility of a VCE based on BWS case 2?
Theoretical framework
Huber and Zwerina (1996) identify four features which when jointly satisfied indicate an optimal (efficient) design. The features are:
• Orthogonality: Perfect orthogonality requires that each pair of levels appears equally often across all pairs of attributes within the design. Attributes are uncorrelated with one another across the design.
• Level balance: A perfect balanced design requires that each level within an attribute appear an equal number of times.
• Minimal overlap: The probability that an attribute level repeats itself in each choice set should be as small as possible.
• Utility balance: Requires that utilities of alternatives within choice sets are the same, the alternatives should be equally attractive to patients. [21, 22]. Because it is for most combinations of attributes, levels and alternatives impossible to create a design that satisfies all these features, most studies consider maximizing orthogonality and balance as common goal.
response efficiency to achieve an optimum in designing an experimental design.
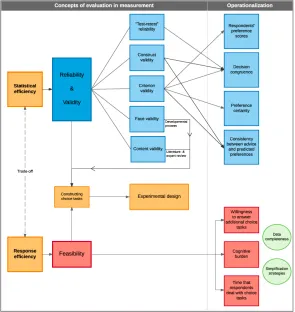
Statistical efficiency is related to both reliability and validity. Reliability implies consistency of preference estimates and validity is about producing the desired results of treatment preference. By administering the same test twice over a period of time to a group of individuals the test-retest reliability can be measured. Studies of Ryan et al. (2006) and Skjoldborg et al. (2009) both used the test-retest approach and investigated preferences by using the method of conjoint analysis. Both studies found that there was stability of preferences between two periods [25, 26]. The concept of validity distinguishes various forms of validity, such as construct validity, criterion validity, face validity and content validity. While construct- and criterion validity are linked to the
operationalization phase, face- and content validity are directly related to the experimental design and constructing choice tasks by means of the
developmental process of designing a VCE. Response efficiency is related to feasibility, which is the extent of how successfully the VCE can be completed accounting for factors that affect it. Examples of affecting factors are willingness to answer additional choice tasks in a VCE, cognitive burden and response time, all of which are related to data completeness and simplification strategies. More data incompleteness reflects less feasibility in the context of the VCE.
Simplification strategies are methods that respondents use when they are confronted with unfamiliar or complex information or decisions. The earlier the simplification strategies occur, the lower the feasibility of the VCE is. In the decision making process, numerous errors are caused by cognitive biases and simplifying heuristics [27-29]. According to Stanovich and West (2000) people have two systems for cognitive functioning to provide effective strategies for improving decision making [30]. System 1 refers to the intuitive system in simple decisions, which is typically fast, automatic, effortless and emotional. System 2 is the opposite of system 1, including slower, conscious,
effortful and logical reasoning. When people are confronted with unfamiliar, complex or overwhelming information or decisions, the cognitive functioning approaches to switch from system 2 to system 1. At that moment people simplification strategies arise, which can lead to decision errors [27, 29]. An overview of the process is shown in figure 1, which gives an impression of the operationalization of the concepts of reliability, validity, and feasibility related to statistical efficiency and response efficiency.
METHODS
This study is presented as a pilot study in a sample of the general population.
Clinical decision
[image:6.595.289.584.224.536.2]As starting point, the VCE for localized prostate cancer from previous research of Hulshof (2015) was used, which was the choice between active surveillance (AS) and curative treatment (CT) [31]. The clinical decision chosen for women was the choice between breast conserving surgery (BC) and entire breast removing surgery (BR) in case of breast cancer. Both clinical decisions must be decomposed in five attributes with
each two attribute levels. A description of a situation (case description) was created in which people were asked to put themselves in the position of someone suffering from localized prostate cancer (men) and breast cancer (woman). The introduction then provided information about characteristics of the treatment alternatives.
Selection of attributes and levels
Attributes and levels from previous research of Hulshof (2015) were used for creating the design for the prostate cancer case, listed in appendix 1, table 1. For the case of breast cancer, a list of attributes and levels was developed from an existing decision aid [32, 33]. Guidelines of formulating attributes and levels in conjoint analysis of B. Orme (2002) were used as basis to generate proper attribute and levels [34]. Five attributes with two levels were revealed and are shown in appendix 1, table 2.
Experimental design
A fully balanced and orthogonal fractional factorial design was used as basis for the experimental design. The design was divided in three sections. Individually, the three sections represented a D-efficient design. This structure was used in order to operationalize reliability, validity and feasibility in both an efficient- and D-efficient experimental design.
First, a perfect balanced and orthogonal design was generated, which consisted of a total of 16 choice sets. These 16 choice sets were derived from a full factorial design. D-efficient designs of 12 and 6 choice sets were roughly similar in level combinations to the design of 16 choice sets, so these two choice sets were included. The designs should be similar to ensure that 6 choice tasks were comprised in the design of 12 choice tasks, and 12 choice tasks were comprised in the design of 16 choice tasks. In this way, it could be guaranteed that the design of 16 choice tasks remained balanced and orthogonal. The design selecting process is shown in figure 2.
[image:7.595.294.576.49.122.2]Experimental design software Sawtooth Software SSI Web (version 6.4) was used to select choice sets based on the BWS case 2 technique (MaxDiff option). An example of one choice task for prostate cancer is shown in figure 3.
Figure 3 Example of a choice for localized prostate cancer
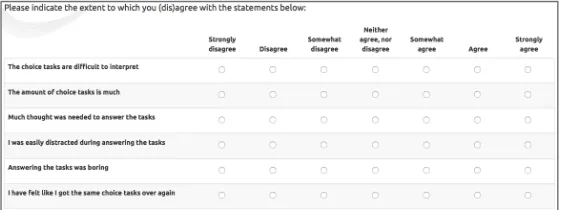
Cognitive burden and exhaustion of number of choice tasks were asked after completion of the first section (6 choice tasks) when respondents got insight in their results. Cognitive burden was asked on a seven-point Likert scale, shown in figure 4. Similar questions were repeated after completion of additional 6 choice tasks (section II) and additional 4 choice tasks (section III). The total flow of the survey (figure 5) is provided as supplementary material in appendix 1.
Study population
[image:7.595.305.579.232.334.2]Respondents were recruited based on the following inclusion criteria: (1) Men and women between the age of 18 and 80 years, (2) Dutch speaking and able to communicate well both verbal- and non-verbal, (3) able to deal with digital forms, (4) living in the Netherlands.
Figure 2 selecting process of the design
[image:7.595.299.581.539.644.2]People were contacted by email, Facebook or face-to-face with the question whether they would like to participate in a survey. Persons who were familiar to the investigator were also asked to take part in the study in order to increase the participation rate.
Survey and data collection
Data collection took place from the 13th of May till the 28th of May 2016. The software Limesurvey was used to program the questionnaire and gather the data.
Recruited respondents could answer the choice tasks by using a computer, laptop or IPad/tablet.
Respondents received a description of the clinical decision and an example of a completed BWS case 2 choice set. Calculations of counts analysis (total best minus total worst) were programmed in Limesurvey in order to show results of each section choice tasks (6 choice tasks, 12 choice tasks and 16 choice tasks) directly to the respondent. Demographic questions were asked in the beginning of the questionnaire (e.g. age, gender, educational level and the awareness of respondents towards the disease).
Statistical analysis
Seven primary outcomes were important for evaluation, which were divided among reliability and validity, and feasibility:
Reliability and validity
(1) Changes in respondents’ predicted preferences were assessed by calculating the preferences in the breast cancer case and prostate cancer case in each section. Due a balanced design, preference scores automatically compensated for each alternative (i.e. the preference score for breast conserving therapy is +3, subsequently the preference score for breast removal therapy is the opposite, that is, -3). In addition, relative percentages based on maximum preferences and difference of preferences for treatments were calculated in each case (breast cancer-, prostate cancer- and both cases) for all sections.
(2) Decision congruence was evaluated by comparing
respondents’ preference after all sections of the
questionnaire. This was assessed by asking the preference of treatment before starting the
questionnaire and by comparing this to the preferences scores after the first (six decision tasks), second (six additional decision tasks; in total 12 decision tasks) and third section (4 additional decision tasks; in total 16 decision tasks) of the questions.
(3) Changes in preference certainty of respondents was
assessed by asking respondents after each section of questions to what extent they were certain about their preference of treatment, which was requested on a 5 Points-Likert scale from strongly disagree to strongly agree.
(4) Consistency between received advice and
preference was assessed by asking respondents after
each section of choice tasks to what extent they though the advice was in line with their preferences. This was also requested on a 5 Points-Likert scale from strongly disagree to strongly agree.
Feasibility
(5) Respondents’ willingness to answer additional
questions for a more reliable outcome/result was
assessed by asking respondents to what extent they would answer an additional set of questions in order to get a more reliable outcome from 0 (definitely not) to 10 (definitely).
(6) Respondents’ appraisal of the decision process was
evaluated by means of perceived cognitive burden. This was assessed by asking statements such as ‘The number of questions is (too) much” and “The questions are boring” on a 7 Points-Likert scale from strongly disagree to strongly agree.
(7) The mean time that respondents deal with choice
tasks per section was automatically measured by
Limesurvey. Limesurvey captured only time statistics per group.
RESULTS
participated in the study, with a mean age of 36 years (range 19 – 74 years). Results are shown in table 3.
* According to Erikson’s theory of stages of development [35]
Reliability and validity
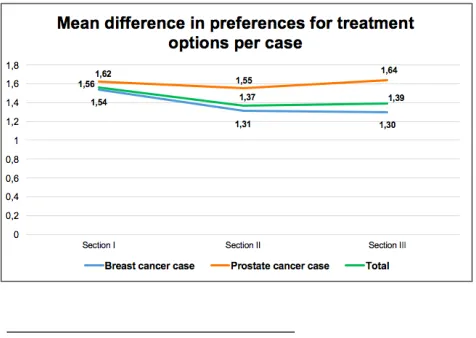
The averaged individual probability that respondents preferred BC (vs. BR) slightly decreased after
answering 6 questions (section I), 12 questions (section II) and 16 questions (section III). This was also the case for the total sample. In contrast, mean preference for AS (vs. CT) increased. Figure 6 shows a decrease in mean difference of preferences for treatments in roughly all casesa in section II, followed by an increase in section III. Overall, there was no indication that answering additional questions resulted in a different predicted preference for treatment. There was no interaction found between socio- demographic characteristics.
a
The breast cancer case showed roughly no difference in mean difference of preference for treatment options between section II and
Dichotomizing preferences, the switching process between treatment options, and decision congruence between stated preferences (throughout a direct
question) and predicted preferences are shown in figure 7 and 8. A total of 23 respondents (almost 25%)
indicated another stated preference than actually was shown in their predicted preference at the end of completing choice tasks. Still 6 respondents of the total sample size were indifferent for a treatment option after completing the choice tasks.
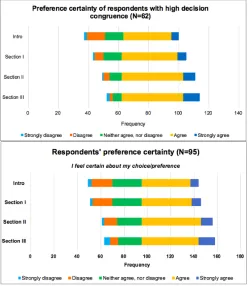
[image:9.595.46.287.90.312.2]Respondents with high decision congruence (N=62) indicated a stronger increase in preference certainty in all sections as compared to the total sample size (N=95), shown in figure 9. Though, respondents’ perceived accordance of received advice with their preferences for treatment showed almost no difference in the three sections.
[image:9.595.298.580.494.624.2]Figure 7 decision congruence of preferences in breast cancer
[image:9.595.39.277.592.761.2]Figure 8 decision congruence of preferences in prostate cancer
Feasibility
A total of 75% of the respondents were willing to answer additional choice tasks after section I in return for receiving a more reliable result (rate > 5, ranged from 0 to 10). After answering section II, there was a drop in willingness (56% gave a rate >5). The averaged willingness to answer additional questions was
declining from 7.42 to 4.77 (mean difference = 2.65). Multiple response frequency analysis showed that there were no major differences in cognitive burden between section I and section II. As shown in figure 10,
respondents perceived more cognitive burden in section III as they stated more agreement in aspects such as the abundance of choice tasks, the
distractedness/concentration, the boringness, the feeling of reiteration of questions and tiredness. The time that respondents dealt with one choice task showed a declining tendency with respectively 46.0 seconds (SD=14.3), 32.4 seconds (SD=11.3) and 25.0 seconds (SD=6.6) in section I, II and III.
Overall, most respondents were in (somewhat) agreement that the VCE was useful and had added value. In addition, they would recommend the tool. Some respondents gave comments on the tool, which were related to feelings of replying the same over again
and difficulties in making choices and comparing characteristics. Two respondents expressed the desire for rating, ranking or weighting attribute levels instead of selecting one most and one least preferred option.
DISCUSSION
A VCE based on BWS Case 2 was used to investigate to what extent efficient- and D-efficient designs were affecting reliability of preference estimates, validity of treatment preference and feasibility of a preference survey questionnaire.
Feasibility
Results suggest that the VCE holds promise for feasibility to a maximum of 12 choice tasks (section II), by constraining the cognitive burden and retaining an optimal level of willingness to answer additional questions. Although there were roughly no differences in cognitive burden after 6- and 12 choice tasks (section I- and II), it appeared that respondents experienced significantly more cognitive burden after 16 choice tasks (section III), which was reflected in the fact that respondents were considerably less able to accomplish a stated answer after 16 choice tasks compared to 12 choice tasks. Although there was a high willingness to answer additional choice tasks in return for a more reliable advice after section I, this score was
[image:10.595.32.284.45.331.2]considerably lower after section II. This supports our conclusion that respondent can answer a maximum of 12 choice tasks.
[image:10.595.296.556.111.258.2]Figure 10 Total cognitive burden of multiple response analysis of all sections
Reliability and validity
Feasibility holds promise to a maximum 12 choice tasks, reliability and validity shows no assurance yet in an optimal balanced and orthogonal design (16 choice tasks). Even though results suggest that respondents’ preference certainty increases, there was a tendency towards smaller preference for one treatment after answering 12 choice tasks in the breast cancer case (N=71). Differences in preference for treatment options in all cases showed this declining tendency as well. Conversely, the prostate cancer case (N=24) showed an increasing tendency in differences in preference for both treatment options, admittedly that data was not statistically significant. There was no interaction found between socio- demographic characteristics (e.g. age, educational level and familiarity with the disease) and predicted preferences. Decision congruence between stated preferences and final preferences was estimable in the whole sample size, due to a significant interaction with 75% respondents’ agreement. Results of decision congruence in between the sections of choice tasks were worthy as well. A significant interaction was found between respondents with high decision congruence and preference certainty, as they indicated a higher degree of preference certainty. Overall, results in reliability and validity were obscure and indicated no strong evidence in providing an optimal number of choice tasks.
Prior studies show likewise no consensus about the ‘appropriate’ number of choice tasks per respondent. Good research guidelines state that including a number of 8 to 16 choice tasks is good practice [11], which is confirmed by Ryan and Gerard (2003). Similarly, the most commonly used choice sets in studies are between one and sixteen, with the average around eight choice tasks [36]. Another study found that respondents were capable of managing multiple choice sets, that was, 17 choice tasks, but indicated somewhat higher response variance compared to 5 choice tasks [37]. The experimental design of the VCE should be based on the trade- off between response efficiency
and statistical efficiency characterized by respectively feasibility and reliability and validity.
Few studies have been performed regarding the feasibility, reliability and validity in BWS tasks, and far less in patient-centered medical decision making facing preference elicitation methods. Prior studies of
Potoglou et al. (2011), Flynn et al. (2013) and Yoo et al. (2013) have not investigated the internal validity and reliability of the tasks, nor have they determined the feasibility (acceptability) of the tasks for respondents [19, 38, 39]. In addition, a think aloud study of Whitty et al. (2013) had no definitive conclusion about the internal validity of the BWS task [40]. Several studies claimed BWS as beneficial over the DCE because of less cognitive burden and randomness in decision making [19, 41]. Paradoxically, the available evidence was not conclusive [42] and research showed still higher response inconsistency in BWS compared to DCE [40]. Our results suggested that there is less cognitive burden limited to 12 choice tasks, indicating that respondents are less arbitrary in their decision making. However, results in predicted preferences were not as expected and may be indicated as high response inconsistency and thus more randomness in decision making. So, there is a conflict between these two findings. Findings of an increased certainty in
preferences in this study are consistent with empirical findings of Flynn et al (2013) and Yoo et al (2013), that showed a greater level of certainty in the decision making process of BWS compared to DCE [38, 39]. This, together with a high degree of decision
congruence may indicate a favorable outcome related to the reliability and validity of preferences in a VCE. The mean time of completing one choice task may be seen as regular as compared to a study which
Strengths and limitations
The study has several strengths and limitations. One major limitation is that respondents in the breast cancer case received predicted preferences in section II that were not accurate due to miscalculations of best minus worst scores in the software program Limesurvey. Although preferences calculations of breast conserving therapy were lower for all the respondents, only twelve respondents received a false treatment advice after section II based on their stated preferences. It was expected that preference certainty and accordance of advice with preferences showed a lower score in section II compared to section I, due to incorrect treatment advices. However, a few respondents indicated lower agreement. This suggest that respondents either did not pick up on the difference between stated preferences and predicted preference, did not link the attributes to the treatments during the task, did not have clear preferences for treatment or were not sure how to deal with the questions. Another possible option may that respondents were using simplification strategies finished quickly, and did not expect the predicted treatment to match their preferences.
It was remarkable that there was still a decrease in predicted preferences in section II in the breast cancer case, while the prostate cancer case showed the expecting increase in preference scores. Both cases followed the same design and the same allocation of attribute levels in the choice tasks. This provides direction to the selecting procedure of attributes and levels in the breast cancer case, which was conducted less accurate and limited as compared to the localized prostate cancer case. Another reason could be the clinical decision, which is based on different
preferences and may be more difficult for the breast cancer case compared to the prostate cancer case. Differences of preferences for treatment showed in both cases a decreasing tendency in section II, which may depend on the generated design. The design of section II could be included with more “dominated” attribute
levels together in one choice task compared to other sections, leading to biased results in section II. Another point of interest was the method of recruiting respondents. Respondents were recruited by email, Facebook or face-to-face, so respondents’ acceptance was high, resulting in a large sample size. However, due to familiarity with the investigator respondents may be prepared and be willing to do more than when randomly a general population was recruited for the study. Respondents were provided with a case description, but potential benefits and harms of
treatment options may be still unfamiliar to respondents which may be hard for them to evaluate this without sufficient information. Consequently, respondents’ decisions may be inconsistent with their true underlying values, indicated as unstable values [44-46]. Another point is that respondents were probably less concerned and anxious than in case of suffering the disease themselves. All this may have affected the way of answering the tasks and the extent of cognitive burden. Although the sample size was large, results must be carefully interpreted when considering the
generalization to the practical field.
Implications and recommendations for clinical practice
Due to the quantitative-based study, additional
considered in their decision making process [49]. This may lead to encouraging insights of validity and statistical efficiency of the VCE.
Evaluation indicated that respondents would use the tool in future if it became necessary for them. Though some respondents still commented that they lacked a sort of importance rating of the characteristics. A way to solve this is to rank and/or rate the attribute level combinations in addition to the selecting the most and least preferred, for example, by using a post-test. This suggestion is in agreement to Flynn et al (2010) who noted that it is preferable to elicit a complete preference ordering from respondents in a choice experiment [41]. Whitty et al. (2013) would encourage a ranking approach for BWS studies as well [40].
According to this, it should be further investigated what method with experimental design is most optimal facing validity, reliability and feasibility to implement in clinical context.
Conclusion
Despite the limitations, this study provides important results with regard to the influence of efficient- and D efficient designs on feasibility of a preference survey questionnaire and reliability and validity of preferences. Findings indicate that a VCE should be considered as limited of 12 choice tasks, taking into account the cognitive burden, willingness to answer additional questions and response time, associated with simplification strategies and data completeness. Results in perspective of reliability and validity of the experimental design in the VCE seems promising, on account of an increase of stated certainty of
preferences, a high degree of decision congruence and a low level of switching between treatment options. Constructing choice tasks is arguably the most
important part in the design phase of a VCE, due to its major influence in the critical trade-off between statistical efficiency (related to reliability and validity) and response efficiency (related to feasibility). In particular selecting attributes and levels and generating the design needs to be carefully considered in further research, together with the consideration of a
REFERENCES
1. Stalmeier PF, van Tol-Geerdink JJ, van Lin EN, Schimmel E, Huizenga H, van Daal WA, et al. Doctors' and patients' preferences for participation and treatment in curative prostate cancer radiotherapy. Journal of clinical oncology : official journal of the American Society of Clinical Oncology. 2007;25(21):3096-100. 2. Pieterse AH, Baas-Thijssen MCM, Marijnen CAM, Stiggelbout AM. Clinician and cancer patient views on patient participation in treatment decision-making: a quantitative and qualitative exploration. British Journal of Cancer. 2008;99(6):875-82.
3. Thompson-Leduc P, Clayman ML, Turcotte S, Légaré F. Shared decision-making behaviours in health professionals: a systematic review of studies based on the Theory of Planned Behaviour. Health Expectations. 2015;18(5):754-74.
4. Elwyn G, Laitner S, Coulter A, Walker E, Watson P, Thomson R. Implementing shared decision making in the NHS. BMJ. 2010;341.
5. Elwyn G, Frosch D, Rollnick S. Dual equipoise shared decision making: definitions for decision and behaviour support interventions. Implementation Science : IS. 2009;4:75-.
6. O’Connor AM L-TH, Dolan J, Kupperman M, Wills C. . Clarifying and expressing values. Original IPDAS Collaboration Background Document.; 2005. 7. Stacey D, Legare F, Col NF, Bennett CL, Barry MJ, Eden KB, et al. Decision aids for people facing health treatment or screening decisions. The Cochrane database of systematic reviews. 2014;1:Cd001431. 8. Fagerlin A, Pignone M, Abhyankar P, Col N, Feldman-Stewart D, Gavaruzzi T, et al. Clarifying values: an updated review. BMC Medical Informatics and Decision Making. 2013;13(2):1-7.
9. de Vries M, Fagerlin A, Witteman H, Scherer LD. Combining deliberation and intuition in patient decision support. Patient Educ Couns. 2013;91.
10. Sheryl L. Szeinbach P, Spencer E. Harpe, PhD, Terry Flynn, PhD, Andrew Lloyd, Eberechukwu
Onukwugha, PhD, John F.P. Bridges, PhD, Axel C. Mühlbacher, PhD, Elizabeth Molsen. Understanding Conjoint Analysis Applications in Health: ISPOR
Conjoint Analysis Working Group; 2011 [cited 2016 17 March ]. Available from:
https://www.ispor.org/News/articles/Jan-Feb2011/Understanding-Conjoint-Analysis_print.asp. 11. Bridges JF, Hauber AB, Marshall D, Lloyd A, Prosser LA, Regier DA, et al. Conjoint analysis applications in health--a checklist: a report of the ISPOR Good Research Practices for Conjoint Analysis Task Force. Value in health : the journal of the
International Society for Pharmacoeconomics and Outcomes Research. 2011;14(4):403-13.
12. Ryan M, Farrar S. Using conjoint analysis to elicit preferences for health care. BMJ.
2000;320(7248):1530-3.
13. Witteman HO, Scherer LD, Gavaruzzi T, Pieterse AH, Fuhrel-Forbis A, Chipenda Dansokho S, et al. Design Features of Explicit Values Clarification Methods: A Systematic Review. Medical Decision Making. 2016.
14. Louviere JJ, Flynn TN. Using best-worst scaling choice experiments to measure public perceptions and preferences for healthcare reform in australia. The patient. 2010;3(4):275-83.
15. R. Johnson JH, L. Bacon. Adaptive Choice Based Conjoint Analysis. Sequim, Washington: Sawtooth Software, 2003.
16. Adamsen J, Rundle-Thiele, S., & Whitty, J. Best-Worst scaling…reflections on presentation, analysis, and lessons learnt from case 3 BWS
experiments. Market & Social Research. 2013;21(1): 9– 27.
17. Lancsar E, Louviere J, Donaldson C, Currie G, Burgess L. Best worst discrete choice experiments in health: Methods and an application. Social Science & Medicine. 2013;76:74-82.
18. Marley AAJ, Flynn TN, Louviere JJ.
20. Marley AAJ, Louviere JJ. Some probabilistic models of best, worst, and best–worst choices. Journal of Mathematical Psychology. 2005;49(6):464-80. 21. Street DJ, Burgess L. The Construction of Optimal Stated Choice Experiments: Theory and Methods: Wiley; 2007.
22. Zwerina K. A General Method for Constructing Efficient Choice Designs. SAS Technical Support Documents. 1996.
23. Lusk JL, Norwood FB. Effect of Experimental Design on Choice-Based Conjoint Valuation Estimates. American Journal of Agricultural Economics.
2005;87(3):771-85.
24. Kuhfeld WF. Experimental Design: Efficiency, Coding, and Choice Designs. Cary, NC, USA: SAS Institute Inc. , 2010.
25. Ryan M, Gerard K, Amaya-Amaya M. Using Discrete Choice Experiments to Value Health and Health Care: Springer Netherlands; 2007.
26. Skjoldborg US, Lauridsen J, Junker P.
Reliability of the discrete choice experiment at the input and output level in patients with rheumatoid arthritis. Value in health : the journal of the International Society for Pharmacoeconomics and Outcomes Research. 2009;12(1):153-8.
27. Chapman GB, Elstein AS. Cognitive processes and biases in medical decision making. In: Chapman GB, Sonnenberg FA, editors. Decision Making in Health Care: Theory, Psychology, and Applications:
Cambridge University Press; 2000. p. 183--210. 28. Ubel PA. Is information always a good thing? Helping patients make "good" decisions. Medical care. 2002;40(9 Suppl):V39-44.
29. Redelmeier DAR, Paul; Kahneman, Daniel. Understanding Patients' Decisions: Cognitive and Emotional Perspectives. JAMA. 1993;270 ((1)):72-6. 30. Stanovich KE, West RF. Individual differences in reasoning: implications for the rationality debate? The Behavioral and brain sciences. 2000;23(5):645-65; discussion 65-726.
31. Hulshof L. Explicit treatment advice in urology: trick or treat? . Enschede: University of Twente; 2015
32. Thuisarts. Borstkanker: een borstbesparende operatie of een borstamputatie: thuisarts.nl; z.d. [cited 2016 24 April]. Available from:
http://keuzehulpen.thuisarts.nl/borstkanker.
33. Institute TOHR. Patient decision aids 2015 [cited 2016 16 May]. Available from:
https://decisionaid.ohri.ca/.
34. Orme B. Formulating attributes and levels in conjoint analysis. Sawtooth Software Inc. , 2002. 35. Erik H. Erikson JME. The Life Cycle Completed: Extended Version: W. W. Norton; 1998.
36. Louviere JJ, Hensher DA, Swait J. Stated choice methods: analysis and application. Cambridge: Cambridge University Press; 2000.
37. Bech M, Kjaer T, Lauridsen J. Does the number of choice sets matter? Results from a web survey applying a discrete choice experiment. Health Economics. 2011;20(3):273-86.
38. Flynn TN, Peters TJ, Coast J. Quantifying response shift or adaptation effects in quality of life by synthesising best-worst scaling and discrete choice data. Journal of choice modelling. 2013;6:34-43. 39. Yoo HI, Doiron D. The use of alternative preference elicitation methods in complex discrete choice experiments. Journal of health economics. 2013;32(6):1166-79.
40. Whitty JA, Walker R, Golenko X, Ratcliffe J. A Think Aloud Study Comparing the Validity and
Acceptability of Discrete Choice and Best Worst Scaling Methods. PLoS ONE. 2014;9(4):e90635.
41. Flynn TN. Valuing citizen and patient preferences in health: recent developments in three types of best-worst scaling. Expert review of pharmacoeconomics & outcomes research. 2010;10(3):259-67.
for deriving EQ-5D-5L health-state values. Medical care. 2014;52(11):935-43.
44. Bansback N, Li LC, Lynd L, Bryan S.
Development and preliminary user testing of the DCIDA (Dynamic computer interactive decision application) for ‘nudging’ patients towards high quality decisions. BMC Medical Informatics and Decision Making. 2014;14:62-. 45. Shiell A, Hawe P, Fletcher M. Reliability of health utility measures and a test of values clarification. Soc Sci Med. 2003;56(7):1531-41.
46. Shiell A, Seymour J, Hawe P, Cameron S. Are preferences over health states complete? Health Econ. 2000;9(1):47-55.
47. Ryan M, Watson V, Entwistle V. Rationalising the 'irrational': a think aloud study of discrete choice experiment responses. Health Econ. 2009;18(3):321-36.
48. Cheraghi-Sohi S, Bower P, Mead N, McDonald R, Whalley D, Roland M. Making sense of patient priorities: applying discrete choice methods in primary care using 'think aloud' technique. Family practice. 2007;24(3):276-82.