Ruben van Bloemendaal | 1801007
[email protected]University of Twente | Enschede Marketing Communication (MSc) Dr. Mirjam Galetzka Dr. Alexander van Deursen
The Internet of Things in
home environments
Abstract
The Internet of Things (IoT) is expected to have an unimaginable impact in the near future on all areas of the consumer daily life. The instrumentation of objects adds a new dimension to the way marketing studies the consumption and experience of products and enables marketers to understand customer behavior more deeply. Such a marketing view argues that through IoT the brand behaves, now more than ever, as an active contributor in the relationship with the customer. The future of IoT depends on how brands and consumers will interact and build these relationships together. Due to the lack of consumer experience with IoT technology in home environments yet, it is still too early for studying how brands should contribute to being able to build customer relationships in this area. Therefore, this study is, one step back, aiming at what the determinants are of customer attitude and intention to use in the context of IoT in home environments and Google Home in specific.
Firstly, a survey has been conducted, which measured the relationships between the independent variables (product performance, use of personal data, personalization, human-like interaction, facilitating conditions, autonomy, and social influence), the mediating variables (customer attitude, perceived usefulness, perceived ease of use, customer trust, and customer commitment), and the dependent variable (intention to use). To be able to test the hypotheses of the first research, a Confirmatory Factor Analysis (CFA) has been executed. Secondly, three IoT professionals have been interviewed to gain a deeper understanding and more qualitative insights on the results of the survey.
The findings showed that customer attitude is directly determined by perceived usefulness, customer trust, customer commitment, and social influence, in which perceived usefulness and customer commitment are the strongest predictors. A noteworthy result is that customer commitment is strongly influenced by most of the independent variables, influences customer trust, and is highly related to customer attitude and intention to use. This study resulted in a model that provides an overview of the determinants for customer attitude towards IoT in home environments, the intention to use this technology, and arguably even more important, customer commitment within this context.
Acknowledgment
I would first like to thank my thesis supervisors Dr. Mirjam Galetzka and Dr. Alexander van Deursen of the Behavioral, Management and Social sciences faculty at the University of Twente. Dr. M. Galetzka consistently allowed this paper to be my own work but steered me in the right direction whenever it was needed. Besides, I am grateful to have had Dr. A. van Deursen as my second supervisor because of his extent of experience and expertise in the field of IoT and other internet related technologies.
I would also like to thank all the survey respondents, and in special, the interview participants: Job Vermeulen, Johan Stokking, and Frido Aalbers. Their professional IoT experience helped me a lot in obtaining a more clear picture of IoT in the context of my study. Moreover, the combination of the results from both the survey as the interviews is what made this thesis as insightful as it is.
Table of contents
1 INTRODUCTION ... 9
2 THEORETICAL BACKGROUND ... 11
2.1 Building customer relationships ... 11
2.2 Intention to use ... 12
2.3 Customer attitude ... 12
2.4 Perceived usefulness ... 13
2.5 Perceived ease of use ... 13
2.6 Customer trust ... 13
2.7 Customer commitment ... 14
2.8 Product performance ... 14
2.9 Use of personal data ... 15
2.10 Personalization ... 16
2.11 Human-like interaction ... 17
2.12 Facilitating conditions ... 18
2.13 Autonomy ... 19
2.14 Social influence ... 19
2.15 Conceptual research model ... 20
3 STUDY 1 ... 21
3.1 Method ... 21
3.1.1 Research design ... 21
3.1.2 Sample ... 21
3.1.3 Measures ... 21
3.1.4 Analysis... 23
3.2 Results... 23
3.2.1 Correlations ... 23
3.2.2 Model testing ... 24
3.2.3 Overview of hypotheses ... 27
3.2.4 Final research model ... 28
4 STUDY 2 ... 28
4.1 Method ... 29
4.1.1 Research design ... 29
4.1.2 Sample ... 29
4.1.3 Measures ... 29
4.1.4 Analysis... 29
4.2 Results... 30
5 DISCUSSION ... 33
5.1 Main findings ... 33
5.2 Limitations and future research ... 35
6 REFERENCES ... 38
7 APPENDICES ... 45
7.1 Appendix A: survey questions... 45
7.2 Appendix B: results pre-test (Dutch) ... 48
7.3 Appendix C: coding scheme ... 50
7.4 Appendix D: factor analysis ... 54
7.5 Appendix E: interview questions ... 55
1
INTRODUCTION
In recent years, there has been an enormous growth in the area of intelligent devices for home automation. Such technologies are designed in order to facilitate people to control their home environments faster and more efficiently (Patru, Carabas, Barbluscu, & Gheorghe, 2016). This trend is fueled by the phenomenon called the Internet of Things (IoT). IoT in smart environments can be described as the interconnection of home devices and sensors that are capable of sharing information across platforms through a unified framework (Gubbi, Buyya, Marusic, & Palaniswami, 2013).
IoT can be perceived as an extension that broadens the current internet environment. For now, mainly computers, telephones, tablets, and cars are connected to the internet, but soon light bulbs, washing machines, chairs, garage doors, etcetera will join the digital environment as well. However, the connection of more physical objects to the internet is not what defines the true renewing aspect of IoT. Both the autonomy and system perspective of IoT is what actually renews IoT. It is the system of interconnected devices that will be able to make decisions, share data, and control environments without external management. The innovativeness and potential implications of an influential technology such as IoT are why the role of this technology in home environments and particularly in the field of marketing deserves a deeper understanding.
IoT is expected to have an unimaginable impact in the near future on all areas of the consumer daily life and to create a more frictionless world (Donnelly, 2016; Woodside & Sood, 2017). In 2013, more than nine billion devices around the world were connected to the internet, including computers and smartphones. That number is expected to increase dramatically before 2020, with estimates ranging from quintupling to 50 billion devices to reaching one trillion (Manyika, Chui, Bughin, Dobbs, Bisson, & Marrs, 2013). With such a rapid expansion of the impact of IoT, it is remarkable that few marketing studies exploring IoT have been conducted, especially in the field of business-to-consumer marketing (Nguyen & Simkin, 2017).
According to Hobsbawn (2015), the future of IoT depends on how brands and consumers will interact and build relationships together. On one hand, by infusing intelligence into systems and processes, brands aim at creating a continuous data flow from consumers to gain insights about behavioral patterns, to learn from it, and to act based on this information. On the other hand, in exchange for providing personal data, consumers desire to be delighted by getting useful and personalized products, services, and experiences that make life in their home environment more comfortable, safe, fun, and sustainable (Brush, Lee, Mahajan, Agarwal, Saroiu, & Dixon, 2011; Taib, De Coster, Sabri, & Tekantape, 2017).
The increase in user adoption of IoT and the expanding role of this technology in the field of marketing reveals the importance of understanding the growing challenges and risks for brands and consumers (De Cremer, Nguyen, & Simkin, 2017). As IoT is becoming more and more integrated into consumer lives, enormous amounts of data will be generated. Manyika et al. (2013) state that concerns about how personal data will be used and secured are likely to grow. As a result, the IoT Privacy Paradox rises. This is about the consumer demand to use IoT technology, but simultaneously having to guard against potential threats to personal security and privacy comes along the possible misuse of available personal data (Williams, Nurse, & Creese, 2016).
Home, as “Google for yóur world” (Google, 2017). Through this vision, Google Home interactively connects people with technology and aims at helping consumers in their daily lives efficiently.
2
THEORETICAL BACKGROUND
2.1
Building customer relationships
Transforming homes into smart environments with IoT impacts marketing by altering the relationship of objects with customers (Woodside & Sood, 2017). Following Ng and Wagenshaw (2017), the instrumentation of objects adds a new dimension to the way marketing studies the consumption and experience of products. Marketing is shifting away from the traditional perspectives of marketing and communication towards design with a focus on shaping customer interactions and experiences (Woodside and Sood, 2017 and Jara, Concepción Parra, & Skarmeta, 2012).
Such a marketing view argues that through IoT the brand behaves, now more than ever, as an active contributor in the relationship with the customer (Woodside & Sood, 2017).Hobsbawn (2015) and Gartner (2014) state that the increasing number of smart products are becoming an entirely new digital channel that provides a continuous and extensive data relationship between brands and customers. IoT changes marketing from campaign-driven activities with a certain endpoint to creating true and ongoing conversations between customers, products, and brands (Hobsbawn, 2015; Woodside & Sood, 2017).
This constant interaction enables marketers to learn more about how products are used and this provides insights and new opportunities for optimizing product design, customer service, messaging, personalization, segmentation, targeting, etcetera (Hobsbawn, 2015; Manyika et al., 2013). Differently stated, in a world of IoT, the final goal for marketers is supporting customers by constantly improving the product based on their personal use and developing a valuable relationship by making the product a vocal point between the customer and the brand (Woodside & Sood, 2017).
Due to the lack of customer experience with IoT technology in home environments yet, it is still too early for studying specifically the determinants for building customer relationships and customer loyalty, which are highly related to each other (Hennig-Thurau, Gwinner, & Gremler, 2002). Therefore, this study has customer attitude and intention to use as the main variables instead, since a positive customer attitude towards IoT in home environments and intention to use is needed for the adoption and integration of IoT technology in customer lives, and hence necessary before customer relationships can be built. In other words, it is expected that, whilst this study is focused on the determinants for customer attitude and their intention to use, the same results will simultaneously demonstrate the influencing factors for building customer relationships.
The Technology Acceptance Model (TAM) is a model proposed by Davis (1989), which theorizes the process of accepting and using technologies. TAM is a very influential extension of the theory of reasoned action (TRA) that has been replicated by several researchers to provide empirical evidence and hence has proven itself in many contexts. TAM suggests that when customers are presented with a new technology, a number of factors influence the customer attitude towards using the technology and eventually the actual use.
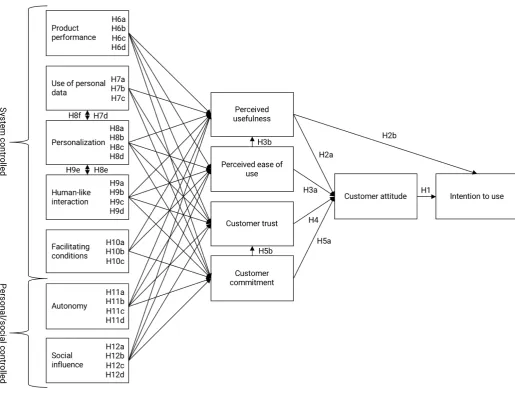
in home environments to determine the influencing factors for customer attitude towards IoT and the intention to use this technology in particular (see Figure 1 on page 20).
2.2
Intention to use
Intention to use can be described as the determination that customers feel to use a particular technology and for this study the determination to use IoT technology in home environments. The construct of intention to use is adopted in this study as the dependent variable and considered as a surrogate for consumer acceptance (Mathieson, 1991; Venkatesh and Davis, 2000). Intention to use is an exceptionally suitable variable since empirical findings have demonstrated that intention to use is an appropriate predictor of later usage, which is essential for building customer relationships (Lee, Park, Chung, & Blakeney, 2012; Sheppard, Hartwick, & Warshaw 1988).
2.3
Customer attitude
Customer attitude is about the beliefs and feelings of a customer towards intention or behavior and reflects the perceived benefits and risks of that behavior (Fishbein & Azjen, 1975). Following Lee and Lee (2015), and in the context of IoT, the availability of more customer data regarding alterations in their behavior and expectations will provide insights for optimizing product performance and personalization. These insights can be used to increase customer satisfaction and by this influence customer attitude towards IoT home technology.
Customer satisfaction is highly related to customer attitude and both strongly influence consumer behavior (Lee, 2007). Satisfaction can be defined as a variable that measures how the performance and use of products or services meet or surpass customer expectations. Most consumers do not have set any expectations regarding IoT in home environments since it is still a technology that is not integrated into many homes yet. For this reason, although attitude and satisfaction are distinct concepts, they are operationalized as one variable for this study.
In this study, customer attitude is defined as the customer expected beliefs and feelings towards IoT home technology, which determine the potential of a customer relationship through IoT in home environments. In other words, customer attitude is the extent to which a customer expects the performance and use of IoT home technology to be satisfying (Anderson, Fornell, & Lehman, 1994). A positive customer attitude towards IoT home technology, such as Google Home, is needed for building strong customer relationships. As long as the attitude towards IoT home technology is rather negative, large-scale acceptance and adoption of this technology will not occur, and thus relationships cannot be built. Following Balaji, Roy, Sarkar, and Chong (2017), who studied user acceptance of IoT applications in the retail industry, customer attitude significantly impacts the adoption of this technology.
TAM and most of its successors have integrated only two consumer beliefs (perceived usefulness and perceived ease of use) to explain attitudes towards technologies (Davis, et al., 1989). However, customer attitude and the adoption of IoT in home environments will also be affected by other factors such as customer trust and commitment. These two variables play a central role in building a customer relationship, influence customer attitude and are, therefore, adopted in this study as mediating variables (Anderson, et al., 1994; Morgan & Hunt, 1994).
2.4
Perceived usefulness
According to the Innovation Diffusion Theory (IDT), consumers are only willing to accept innovations and adopt new technologies, if these provide a unique advantage compared to existing solutions (Rogers, 1995). Moreover, Gao and Bai (2014) argue that the reason for the slow diffusion of IoT in home environments could be a failure in communicating the true added value to potential customers. This emphasizes the importance of perceived usefulness in studying the customer attitude towards IoT in home environments. In this study, perceived usefulness is similar to the relative advantage of IDT and to performance expectancy of the Unified Theory of Acceptance and Use of Technology (UTAUT) (Rogers, 1995; Venkatesh, Morris, Davis, & Davis, 2003).
Perceived usefulness refers to customers’ feelings of improved performance when they use smart home technology (f.e. Google Home). IoT in home environments is expected to improve performance through tasks as, gathering the latest news, weather, and traffic updates, managing the heating system, opening the door when there is someone familiar ringing the doorbell, generating a grocery list based on the content of the refrigerator, etcetera. TAM indicates that perceived usefulness is not only a significant determinant of customer attitude but influences the intention to use the technology directly as well (Davis, 1989; Lee et al., 2012).
H2a: A higher level of perceived usefulness leads to a more positive customer attitude. H2b: A higher level of perceived usefulness leads to a greater intention to use.
2.5
Perceived ease of use
Perceived ease of use is similar to the complexity of IDT and effort expectancy of UTAUT (Rogers, 1995; Venkatesh et al., 2003). This variable can be defined as the customers’ perceived exerted efforts when using IoT technology (f.e. Google Home) in their home environment. Additionally, following Ashton (2016), in the context of IoT, customer expectation for device reliability concerns their perceived ease of use as well.
For customers to have a positive attitude towards IoT in home environments, they need to feel that this technology is easy to use. A large number of previous studies conclude that perceived ease of use affects customer attitudes and thus behavioral intentions towards technology significantly (Davis, 1989; Lee et al., 2012). According to TAM and UTAUT, perceived ease of use also positively affects the previously discussed variable: perceived usefulness (Kuo and Yen, 2009; Lee et al., 2012; Venkatesh et al., 2012).
H3a: A higher level of perceived ease of use leads to a more positive customer attitude. H3b: A higher level of perceived ease of use leads to a higher level of perceived usefulness.
2.6
Customer trust
Williams et al., 2016). Following Lin (2011), trust is one of the most effective tools for reducing these concerns and generating a sense of safety. Besides this, many studies have shown that there is a positive relation between customer trust and customer attitude (Al Nasser et al., 2014; Rogers, 2010). For these reasons, customer trust is believed to play a pivotal role in predicting customer attitude and the eventual intention to use.
Following Singh and Sirdeshmukh (2000), overall customer trust depends on a brand’s competence and benevolence. The notion of competence includes fulfilling the promised performance in a reliable and honest way. Benevolence, on the other hand, taps the probability that brands would hold the customer’s interest on top of their self-interest, which is highly related to the privacy concerns around IoT (Manyika et al., 2013). For this study, customer trust has been defined as the extent to which a customer accepts vulnerability based on expectations regarding both competence and benevolence of IoT home technology (f.e. Google Home). Although Google Home is not a brand itself, it is a product that channels and facilitates i.a. trust between the customer and Google as a brand. According to Hobsbawn (2015), often it is not the brand but the product that carries the “energy” since it is the vocal point in the customer-brand relationship. For this reason, in this study, customer trust is focused on the device (Google Home) instead of the brand (Google), and so is the case for customer commitment.
H4: A higher level of customer trust leads to a more positive customer attitude.
2.7
Customer commitment
Hennig-Thurau et al. (2002) and Morgan and Hunt (1994), state that besides customer trust, customer commitment is fundamental to establish long-term relationships with customers. Following Geyskens et al. (1996), there are two types of customer commitment. Firstly, affective commitment, which expresses the extent to which a customer likes to maintain the relationship. Secondly, calculative commitment, which measures the degree to which a customer needs to maintain the relationship. In the context of IoT, a relationship with smart home devices will not be perceived as needed by consumers yet, but as IoT is becoming more and more integrated into consumer lives, this is expected to play a role eventually (Hobsbawn, 2015).
For this study, customer commitment has been operationalized as the extent to which a customer believes that an ongoing relationship with IoT technology is worth investing in since the customer expects to like and need the relationship. To be more specific, customer commitment is about the extent to which customers are willing to invest their time, energy, and personal data in IoT technology (f.e. Google Home) because this enables them to maintain the relationship and fully benefit from it.
H5a: A higher level of customer commitment leads to a more positive customer attitude. H5b: A higher level of customer commitment leads to a higher level of customer trust.
2.8
Product performance
performance compared to existing solutions. According to the innovation diffusion theory (IDT), this is of main importance for the consumer willingness to accept an innovation (Rogers, 1995).
Until now, consumers are largely unaware of the possibilities of IoT in home environments. They are frequently surprised and delighted by all the facets of the home environment that can be controlled by IoT technology (Puric, 2015). Over-exceeding performance is exactly where IoT-related businesses, such as Google, are aiming at. Google is developing an AI (Artificial Intelligence) that supports their smart home technology (i.a. Google Home) by making it increasingly intelligent and making it perform like a true personal assistant. In this way, IoT is expected to take over tasks from customers, to think for them, and to become an even more integrated part of their lives (Verhoef, 2016).
The future of AI is still very debatable. Townsend (2016) states that AI will not take over the world of IoT since people are the driving force that creates the ever-growing needs that IoT leverages. In other words, IoT is best considered from the perspective of adoption rather than pure invention (Hobsbawn, 2014). However, Balkam (2015) and MEF (2016) state that the ability of machines to take action on their own without human intervention if a key factor that fears consumers. Moreover, according to Dvorsky (2017), hackers have already started using AI as a weapon to make their attacks more scalable.
Following Harris (2014), Kang (2014) and Puric (2015), the development and extensive adoption of the smartphone has led to a new era of connectivity expectations. Harris (2014) stated that the idea of being able to control their home and family from anywhere makes sense because people are already connected to everything else in their lives. Consumers are interested in efficient and intuitive IoT technology that allows people to focus on the matters that they truly care about such as their families, friends, work, sleep, and fitness (Puric, 2015). This is how Nest, for example, offers customers the ultimate convenience and flexibility by making the thermostat settings remotely accessible wherever customers are. Besides this, following Puric (2015), consumers demand intuitive notification in the case something that should happen does not happen or vice versa.
Product performance has been operationalized as the level to which IoT home technology is expected to enhance performance on the basis of its main tasks specifically; namely to automate, control, and secure the home environment and to make it more energy efficient (Brush et al., 2011; Taib et al., 2017). These tasks are related to customer benefits as making life more comfortable, fun, and efficient. Research done by Honeywell found that comfort trumps all. Smart home technology quickly loses its brilliance if it makes a home less comfortable than without using this technology(Puric, 2015).
H6a: A higher level of product performance leads to a higher level of perceived usefulness. H6b: A higher level of product performance leads to a higher level of perceived ease of use. H6c: A higher level of product performance leads to a higher level of customer trust.
H6d: A higher level of product performance leads to a higher level of customer commitment.
2.9
Use of personal data
Depending on the mobile apps that consumers use and the privacy settings on their phones, it can tell their locations, who they frequently speak with, the passwords to their most private accounts, and it also has access to all of their photos. In recent years, a new wave of wearable devices is gathering personal consumer data that is even more personal. Through these devices measures of heart rates, the number of steps, sleeping conditions, sweat, and eating habits can be collected (Eadicicco, 2014). Moreover, chief technology officer at Good Technology, Nicko van Someren, stated that the encryption protocols that are used to secure mobile devices and wearables and the data that these devices are processing are not at an utmost level (Eadicicco, 2014). According to Fearn (2017), this comes with extreme risks, especially in case virtually every object that consumers use is connected through IoT.
Following Holmes (2016), the digital world, which was born in freedom, has evolved into a feature of control. Although technology may improve consumer lives in many ways, as businesses are greedy for personal customer data, it also raises concerns among consumers about the security of this data. The role of personal data within IoT forwards one of the largest challenges, and thus needs greater understanding (Manyika et al., 2013; Ng & Wagenshaw, 2017; Bandyopadhyay & Sen, 2011). Use of personal data has been operationalized for this study as the extent to which IoT home technology, such as Google Home, is expected to use personal data for customer benefits (f.e. product performance and personalization) instead of misusing the data for a brand’s (f.e. Google) own purposes.
H7a: A more customer-benefit focused use of personal data leads to a higher level of perceived usefulness.
H7b: A more customer-benefit focused use of personal data leads to a higher level of customer trust. H7c: A more customer-benefit focused use of personal data leads to a higher level of customer commitment.
H7d: A more customer-benefit focused use of personal data leads to a higher level of personalization.
2.10
Personalization
Personalization, also described as one-to-one marketing by Peppers, Rogers, and Dorf (1999), is considered as an important variable in building customer relationships (Ball, Coelho, & Vilares, 2006; Kwon & Kim, 2001). Following Ball et al. (2006), it can be defined as: “any creation or adjustment of a product or service to fit the individual requirements of a customer”. Puric (2015) states for example that smart home technology interfaces should be accessible and understandable to consumers of all ages. The final goal of personalization is to create customer retention and build customer loyalty through satisfaction and trust (Ball et al., 2006; Dorotic, Fok, Verhoef, & Bijmolt, 2011).
As mentioned earlier, more and more AI related software will be integrated into IoT technology. Presumably, the most interesting and valuable use of AI lies in personalization. In the context of IoT, AI enables marketers to have personalized one-to-one conversations with customers who know their pain points, needs, and goals. This way of personalized communication can end the ineffective spam that often plagues marketing today(Press, 2016).
customer’s particular needs and behavior at that moment, rather than a customer having to adapt to a random fixed temperature or time (Kang, 2014).
In today’s customer and data-driven landscape, more personalized offers and communication lead to more relevant and comfortable time in home environments with fewer distractions (Lindsay, 2017). In this way, marketers are able to optimize and personalize products and services, through customer data (Ng & Wakenshaw, 2017). For this study, personalization has been operationalized as the expected creation or adjustment of IoT technology in terms of functionality and performance, by the personal data it collects, based on the individual use and needs.
H8a: A higher level of personalization leads to a higher level of perceived usefulness. H8b: A higher level of personalization leads to a higher level of perceived ease of use. H8c: A higher level of personalization leads to a higher level of customer trust.
H8d: A higher level of personalization leads to a higher level of customer commitment. H8e: A higher level of personalization leads to a higher level of human-like interaction.
H8f: A higher level of personalization leads to a more customer-benefit focused use of personal data.
2.11
Human-like interaction
A study conducted by Wu, Chen, and Du (2017) suggests that a “friend-like” interaction style in the IoT context improves the concept of brand competence and brand warmth and enhances the consumers’ emotional attachment to the brand or product. Increasingly, devices (f.e. Google Home) are becoming more human-like with voice control acting as extensions of consumers as an assistant responding to speech. Following Ryan Germick, team lead of the Google Doodles team that develops the assistant’s personality, consumers should think about Google Assistant as their friendly companion: “always there but never in the way” (Sterling, 2016). This makes IoT devices more and more capable of developing and maintaining a relationship with customers (Woodside & Sood, 2017; Wu et al., 2017).
If brands are aiming at building trust, which is the foundation for any relationship, brands need to humanize and personalize efforts (DeMers, 2016).Moreover, Yang and Lin (2014) state that the lack of personal communication instead of technology-mediated interaction challenges companies to build trust in a digital environment. These statements emphasize the relevance of human-like interaction in the context of IoT, in which, again, AI will have a major role. Microsoft (2017) argues that the human-touch is unquestionably important for technologies that are related to AI.
Following DeMers (2016), trust is why humanized marketing strategies, such as content marketing and social media marketing, are adopted by many businesses. These are marketing methods that promote a brand’s reputation without directly advertising the product or service. With humanizing a brand by integrating human-like communication into interactions, customers will start to associate a brand or product with a human being, or at least with a more human experience instead. Since people trust corporate brands less than people, this is where relationship building is manifested (DeMers, 2016).In addition, by humanizing a brand, it is able to have a more central position in the customer’s life, potentially enabling the customer to find a desirable relationship or providing the customer a sense of comfort at finding a brand that fits the self-concept(Swaminathan, Stilley, & Ahluwalia, 2009).
whichis the attribution of human traits, emotions or intentions to non-human creatures or objects, is a demanding variable that may resolve this contradiction across the formation, resilience, and reconstruction stages of trust. For this study human-like interaction has been operationalized as the expected capability of IoT home technology (f.e. Google Home) to interact with customers as a human, which means two-way communication by speech, immediate feedback, a high level of understanding, and a social touch.
H9a: A higher level of human-like interaction leads to a higher level of perceived usefulness. H9b: A higher level of human-like interaction leads to a higher level of perceived ease of use. H9c: A higher level of human-like interaction leads to a higher level of customer trust.
H9d: A higher level of human-like interaction leads to a higher level of customer commitment. H9e: A higher level of human-like interaction leads to a higher level of personalization.
2.12
Facilitating conditions
There are different facilitating conditions that play a role in the adoption of IoT in home environments. Two important conditions are financial costs and network infrastructure and security (Ashton, 2016; Groopman, 2016; MEF, 2016; Puric, 2015). Although, in most cases costs are not a part of the facilitating conditions, based on the notion that facilitating conditions are defined as the resources and support available to perform a behavior, financial costs do play a role as a facilitating condition for this study. Facilitating conditions can be perceived as a bundle of aspects that may affect customer attitude and will support or withhold consumers to adopt IoT.
Ashton (2016) states that the cost of adding connectivity to physical objects versus the cost of a physical object that is not made smart is an interesting point for how much IoT can penetrate consumer markets. If the value of making home devices smart by adding connectivity is not perceived as more advantageous than the costs, consumers are not willing to pay to connect their devices. Following Ashton (2016), for the early adopters of a technology such as IoT, costs are of less concern since they are making decisions based on other standards. In this way, early adopters of smart home devices will help to further develop the technology to make IoT more affordable, useful, and secure for the majority.
According to Ashton (2016), infrastructure and security are central topics within IoT that are related to the costs and ease of use of smart devices in home environments. To be more specific, implementing security into IoT devices by building a decent infrastructure often compromises the costs or ease of use and vice versa. The network infrastructure of IoT can be seen as an enormous and complicated roadmap. There are many data flows between different smart home devices, but also to the cloud. If IoT as a network lacks a decent infrastructure (and a “road” breaks down), personal data will get lost and even worse can be misused by others. This view emphasizes the impact of a poor infrastructure or the security of the network. Around the world, 54% of the consumers state that in the context of IoT security is their main concern (MEF, 2016). Therefore, IoT devices and software needs to be updated constantly to secure personal data, which is not the case yet according to Eastwood (2017).
2.13
Autonomy
To begin with, the concept of autonomy is valued very diversely by consumers. Van Deursen and Mossberger (2018) argue that IoT devices are replacing human actions and decisions. More and more devices communicate information automatically, so there will be fewer, if any, decision points for intervening. Following Ashraf and Habaebi (2015), the adoption of autonomy in IoT can play a valuable role in how smart home technology is perceived. Stated in even stronger terms, Lonergan (2016) argues that in order for IoT to become broadly adopted, smart home devices must work and be capable of making decisions autonomously.
However, as the autonomy integration of IoT is mainly based on AI, and thus highly related to this technology, with IoT becoming autonomous consumers fear the ability of devices to take action on their own without human intervention (Balkam, 2015 & MEF, 2016). In other words, as smart home devices become capable of working increasingly autonomous, consumers may experience more lack of control. Especially, since smart devices do not have screens necessarily and most of them make it hard to keep control over all data exchanges and decisions based on this data (Eskens, Timmer, Kool, & van Est, 2016). This is what underscores the importance to integrate autonomy as an independent variable in this study.
Autonomy has been operationalized as the extent to which customers expect that IoT home technology (f.e. Google Home) operates as a system of interconnected devices that will be able to make decisions, share data, and control environments without external management. Moreover, once a customer decides to adopt Google Home, which works with Google services such as Gmail, Google Calendar, Google Drive, etcetera, customers will be imposed to use these products too. Thus, the autonomy function of Google Home does not only consist of decisions and control in the home environment but has other implications for customer lives as well. Although autonomy is expected to affect perceived usefulness and customer commitment positively, it is expected to affect perceived ease of use and customer trust negatively due to the lack of customer control that it is supposed to come with. It is expected that as the autonomous function of IoT is proving itself useful, secure, and reliable, consumers will be less concerned about their personal control.
H11a: A higher level autonomy leads to a higher level of perceived usefulness. H11b: A higher level autonomy leads to a lower level of perceived ease of use. H11c: A higher level autonomy leads to a lower level of customer trust.
H11d: A higher level autonomy leads to a higher level of customer commitment.
2.14
Social influence
When determining the predictors of customer attitude and their intention to use a technological innovation such as IoT, the social environment of the customer should not be neglected. According to Hsu and Lu (2004) and Davis (1989), social influence plays a major role predicting intention to use and thus in determining customer attitude. This is specifically the case for innovations in an early stage of diffusion or development (Gao & Bai, 2014). In these stages, most customers lack decent information about how to use the technology. Hence, there is an increasing relevance of the attitudes from the customer’s social environment for their individual evaluation of the technology.
environment considers influence from peers, family, but also from media such as newspapers, television, and social media. Hence, opinions and evaluations about IoT from both individuals and media might influence the way how customers perceive this technology, their trust and commitment, and thus their feelings towards using it.
H12a: A higher level of social influence leads to a higher level of perceived usefulness. H12b: A higher level of social influence leads to a higher level of perceived ease of use. H12c: A higher level of social influence leads to a higher level of customer trust.
H12d: A higher level of social influence leads to a higher level of customer commitment.
2.15
Conceptual research model
[image:20.595.40.556.368.764.2]As stated in the introduction the main research question for this study is: what are the determinants of customer attitude and intention to use in the context of IoT in home environments and Google Home in specific? To be able to answer this question by testing the stated hypotheses, the following research model has been proposed (see Figure 1). This model presents five system-controlled variables and two personal/social-controlled variables. The former consists of the independent variables that are mainly influenced by IoT technology itself and the latter holds the independent variables that are more related to customers and their social environment.
3
STUDY 1
3.1
Method
3.1.1
Research design
Measuring attitudes towards IoT in home environments can be challenging since this technology has never been experienced by most consumers yet. Therefore, a survey was executed in which Google Home was used as a clear example to make sure that the respondents were primed to the same understandable context (see Appendix A). This was done by presenting an introductory video that clearly explained respondents the usability of Google Home (GolemDE, 2016). The video was composed and edited to give the respondents an impression of Google Home’s full potential, and so a glimpse of the potential of IoT in home environments.
3.1.2
Sample
The present study draws on a sample collected in the Netherlands. Firstly, before executing the survey, a pre-test was designed to determine whether all survey items were understood and measured the right constructs. In total, six participants performed the pre-test and none of them took part in the final survey. Amendments were made based on the feedback provided as shown in Appendix B.
For the final survey, all people above the age of 18 could participate. There were no further age restrictions, as long as respondents lived independently. The survey was spread online via social media and email. The aim was having a minimum of 195 respondents (15 respondents per variable) filling in the survey (Gorsuch, 1983; Hair et al., 1998). To obtain a representative sample of the Dutch population, the target was to equally collect responses from all adopter categorizations, both male and female, and from different ages and educational groups. The time needed to answer the survey questions was 15 minutes on average. To pace the collecting process and to thank the respondents for filling in the survey, 18 bottles of wine were raffled.
In total, a convenience sample of approximately 425 people was selected from the researcher’s personal contacts. The response rate was around 60%, from which 46 responses were still in progress by the end of the collecting process. Over a two-week period in November 2017 there was obtained a total of 203 recorded responses. The sample had the following composition; gender: 54% man and 46% woman; age (M = 32.8, SD = 14.2); education: 5% lower general secondary education, 19.7% intermediate vocational education, 7.4% higher general secondary education, 47.8% higher vocational education, and 22.7% university degrees. According to the level of innovativeness measure, the sample consisted of 13.3% innovators, 25.6% early adopters 34.4%, early majority, 21.2% late majority, and 5.5% laggards. This was calculated by labeling an average score of 1 - 1.8 as the laggards, 1.8 - 2.6 as the late majority, 2.6 - 3.4 as the early majority, 3.4 - 4.2 as the early adopters, and 4.2 - 5 as the innovators.
3.1.3
Measures
scales and items see the coding scheme in Appendix C. The items that were deleted from the original scales, as a result of reliability analyses, are displayed in grey.
The items to measure the dependent variable, intention to use, were based on behavioral intention scale of Venkatesh (2000). It consisted of a set of three items that concerned the willingness, and frequency to use Google Home and the willingness to recommend using it to others (M = 3.1, SD = 0.9, α = .83). An example item of this scale was: if I would be able to use Google Home, I would do it.
Customer attitude was measured based on a set of five items developed by Dabholkar and Bagozzi (2002), Taylor and Baker (1994) and Hennig-Thurau et al. (2002). These were adapted to tap the different aspects of customer attitude and customer satisfaction in the context of IoT technology (M = 3.5, SD = 0.7, α = .90). Customer attitude was measured with items such as: once I have used Google Home, I believe to be satisfied with how the product performs.
Davis’ (1989) scales were adapted to capture perceived usefulness and perceived ease of use. The items of perceived usefulness reflected the efficiency and convenience to use Google Home (M = 3.2, SD = 0.7, α = .84). One item was added to this scale, which made it a total of four items. Perceived ease of use, on the other hand, considered the easiness of interacting, learning and using this technology and consisted of three items (M = 4.0, SD = 0.6, α = .86). Example items for each construct were: I expect that using Google Home would significantly increase the quality of my life. And I perceive my interaction with Google Home to be clear and understandable.
The measure of customer trust was inspired by the perceived trust scale from Chiou & Droge (2006). This scale was adapted to the context of this study and tapping facets of honesty, reliability, and intentions and consisted of four items (M = 3.2, SD = 0.8, α = .87). An example item was: I perceive Google Home as honest.
Morgan and Hunt (1994) and Hennig-Thurau et al. (2002) developed a scale that measures customer commitment. The measurement of this construct was based on their scale and holds four items (M = 3.1, SD = 0.8, α = .84). One of the items that measured customer commitment was: Google Home is something that I expect to be committed to.
Most of the independent constructs are highly depending on the context of IoT in home environments specifically and were therefore measured by self-generated scales. Product performance was measuredwith five items(M = 3.6, SD = 0.6, α = .73), use of personal data with three items(M = 2.7, SD = 0.8, α = .74), personalization with two items(M = 3.9, SD = 0.6, r = 0.64), human-like interaction with four items(M = 3.1, SD = 0.7, α = .70),and autonomy with four items(M = 3.1, SD = 0.9, α = .77). Originally facilitating conditions was one variable, but as a result of a factor analysis (see Appendix D) divided in two separate constructs: facilitating conditions (costs) with two items(M = 3.8, SD = 0.7, r = 0.49) and facilitating conditions (connection) with two items(M = 3.4, SD = 0.9, r = .79). The four items of social influence were adopted from Mathieson (1991) (M = 3.3, SD = 0.7, α = .84). An example item that measured product performance was: I perceive Google Home as a capable technology of automating daily activities in my home environment.
There were no existing scales available to measure the additional constructs: level of innovativeness with three items (M = 3.2, SD = 0.9, α = .87) and attitude towards Google with five items (M = 3.4, SD = 0.6, α = .83). For this reason, these scales were self-generated as well. An example item that measured level of innovativeness was: I perceive myself as an early adopter regarding the use of innovative technology. To measure the general attitude towards Google items such as: my experience with Google is delightful, were used.
3.1.4
Analysis
After conducting the survey, merging the data, and importing the data into SPSS 23.0, the results of the first study were analyzed. This analysis consisted of different frequency and descriptive tables, a reliability analysis (Cronbach’s alpha), a correlation analysis, and model testing by a regression analysis. Several descriptive results and the reliability analysis were addressed in this method section already. In the results section, the results from the correlation analysis and regression analysis were discussed. The different constructs were tested for correlations by a Pearson correlation analysis, which presented the correlations between the independent and dependent variables and the demographics of the sample. Finally, to be able to test the hypotheses of this research, a Confirmatory Factor Analysis (CFA) was conducted using SPSS AMOS 22.0.
3.2
Results
3.2.1
Correlations
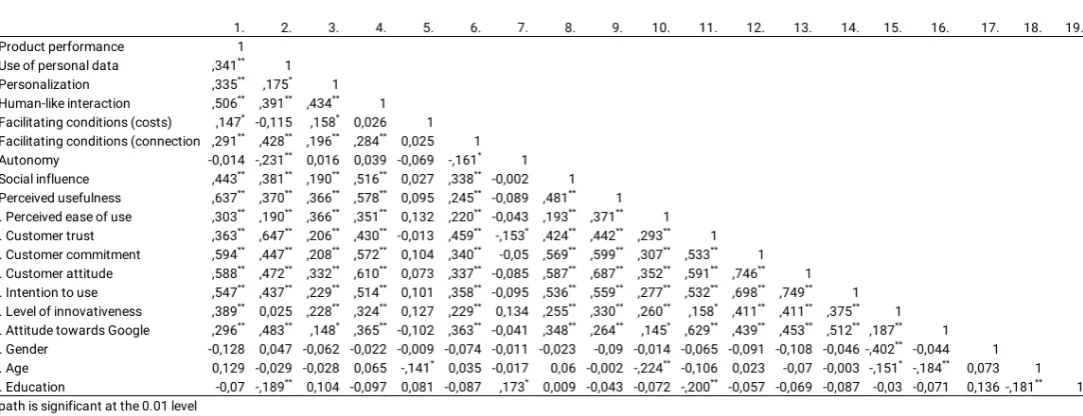
The different constructs were tested for correlations by a Pearson correlation analysis. An overview of the results can be found in Table 1. In the following text, both the significant (above 0.60) and other noticeable results are mentioned. There is a strong correlation (r = .64) between product performance and perceived usefulness. It means that the higher the expectations customers have about the performance of Google Home, the higher the perceived usefulness of this technology. The results show that human-like interaction is an influential variable since there are five correlations above 0.50 including a strong correlation (r = .61) with customer attitude. Besides, use of personal data strongly correlates (r = .65) with customer trust. However, noteworthy is the lack of a strong correlation (r = .18)
between use of personal data and personalization. Moreover, there are no significant correlations (r = -.14 to .16) found between facilitating condition (costs) and the other variables. This applies to the
correlations (r = -.23 to .17) between autonomy and the other variables too.
The results also show a number of strong correlations between the mediating variables and dependent variable. Customer attitude is strongly correlated with perceived usefulness (r = .69), customer commitment (r = .75) and intention to use (r = .75). The latter is one of the main assumptions of TAM and proven by this research as well. Besides, there is a strong correlation (r = .70) between customer commitment and intention to use. A noteworthy result is that there are seven correlations above 0.50 between customer commitment and other variables, which suggests that customer commitment is one of the main variables within this study.
3.2.2
Model testing
To test the conceptual model presented in Figure 1, Structural Equation Modeling (SEM) has been applied using AMOS. SEM is a statistical methodology that takes a confirmatory (hypothesis-testing) approach to the analysis of a structural theory bearing on a certain phenomenon (Bryne, 2001). It has been performed in order to determine whether the hypothesized model fits the actual data set. To achieve model identification, the regression coefficients of the error terms over the endogenous variables were fixed at 1. Model fit is based on a number of ‘goodness-of-fit’ statistics: CMIN/df (parsiuminus fit), CFI (comparative fit), TLI (non-normed fit), and RMSEA and SRMR (absolute fit) (Hoe, 2014). Two models have been tested regarding these statistics as shown in Table 2. First, the conceptual model as shown in Figure 1 has been tested. Thereafter, the conceptual model has been modified by adding a number of paths between several variables. These optimizations are based on convincing modification indices that were provided by AMOS. The modified model can be found in Figure 2 on page 28.
[image:24.595.29.571.85.293.2]Important to mention is that CMIN/df, RMSEA, and SRMR depend on the sample size, where CFI and TLI are fairly independent of it. The modified model has 63 free parameters with a sample size of 203. A rule of thumb is to achieve a ratio between the sample size and the number of free parameters of 5:1 (Bentler & Chou, 1987). Following this rule, the sample size should be at least 315. This may affect the CMIN/df, RMSEA, and SRMR estimates. Kline (1998) states that CMIN/df <1 indicate close fit, those <2 indicate fair fit, and those <3 indicate acceptable fit. For the CFI statistic, Hoe (2014) argues that CFI >0.90 implies an acceptable model fit. A TLI estimate of >0.95 indicate close fit, those >0.90 indicate fair fit, and those >0.85 acceptable fit (Hu & Bentler, 1999). Steiger (1989) and Browne and Cudeck (1993) suggest guidelines for the interpretation of RMSEA: values between 0.00 to 0.05 indicate close fit, those between 0.05 and 0.08 indicate fair fit and those between 0.08 and 0.10 an acceptable fit. Additionally, Hu and Bentler (1999) state that a SRMR value of <0.08 indicate appropriate model fit. Although the relatively small sample size, according to these guidelines, and based on the results of the modified model, there can be concluded that the model has an overall acceptable fit.
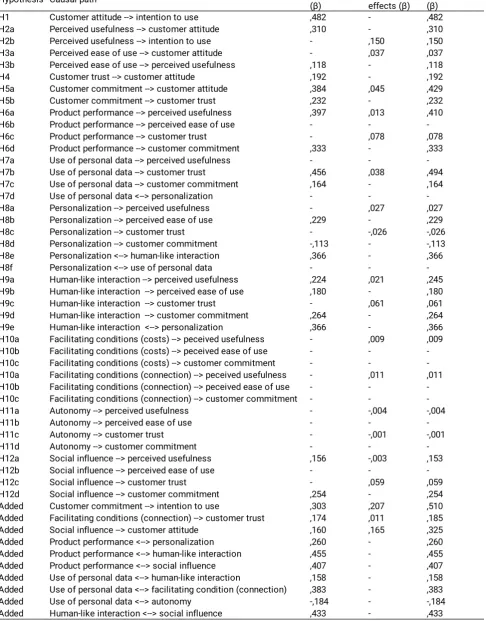
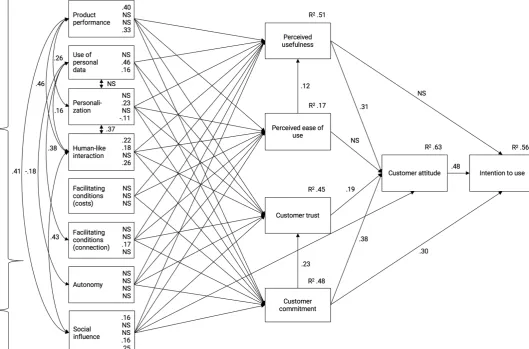
An overview of the modified model with the results for disclosure has been presented in Figure 2 and Table 3. In Figure 2 the standardized direct effects (β) and the explained variance (R2) can be found. Table 3 shows the standardized direct, indirect, and total effects (β) that are significant. To mention significant results, the dependent variable intention to use has a R2 of 0.56. It means that the variance of intention to use is explained for 56% by perceived usefulness, customer attitude, and customer commitment. Additionally, the model results in an explained variance for customer attitude of 63%, for perceived usefulness of 51%, for perceived ease of use of 17%, for customer trust of 45%, and for customer commitment of 48%.
Considering the regression path’s, the analysis supports the influence of product performance on perceived usefulness (β = 0.397, p = <0.001) and customer commitment (β = 0.333, p = <0.001). Moreover, the results show that use of personal data is a strong predictor for customer trust (β = 0.456, p = <0.001) and customer commitment (β = 0.164, p = 0.004). Also, the influence of personalization on perceived ease of use (β = 0.229, p = 0.001) and customer commitment (β = -.113, p = 0.045) is supported. The influence of personalization on customer commitment is significant, however it is not conforming the stated hypothesis.
Except for customer trust, all mediating variables are directly influenced by human-like interaction: perceived usefulness (β = 0.224, p = <0.001), perceived ease of use (β = 0.180, p = 0.025), and customer commitment (β = 0.264, p = <0.001). These results show that human-like interaction is a key variable in this model. The results show that all hypotheses regarding the influence of facilitating conditions are rejected. Although, in the modified model there is a path added between facilitating conditions (connection) and customer trust (β = 0.174, p = 0.002), which is significant. Autonomy is not a significant predictor for any of the mediating variables. Social influence significantly influences both perceived usefulness (β = 0.156, p = 0.008) and customer commitment (β = 0.254, p = <0.001). There is also a direct path added from social influence to customer attitude (β = 0.160, p = 0.002), which has been confirmed by the results as well.
The hypotheses between the mediating variables and depend variable are supported, except for the prediction of perceived usefulness for intention to use and perceived ease of use for customer attitude. However, these hypotheses are partly supported since the results showed an indirect effect from perceived usefulness to intention to use (β = 0.150) and perceived ease of use to customer attitude (β = 0.037). Following the analysis, customer commitment is a key variable in the model, since it is significantly influenced by most of the independent variables and has a strong influence on customer attitude (β = 0.384, p = <0.001), customer trust (β = 0.232, p = <0.001), and intention to use (β = 0.303, p = <0.001).
3.2.3
Overview of hypotheses
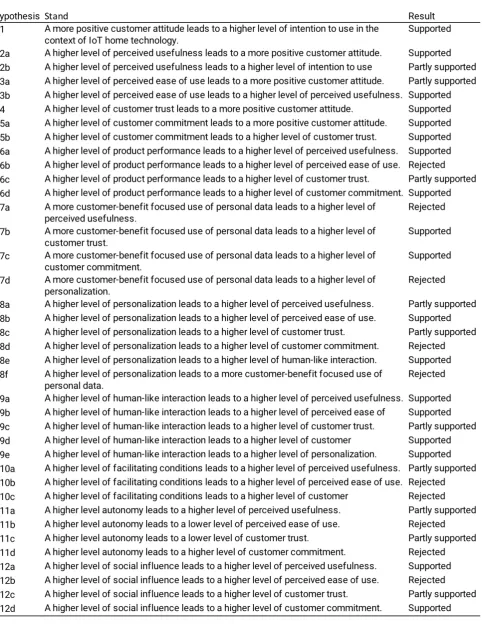
[image:27.595.61.544.161.786.2]In table 4 below here an overview is provided that shows which of the stated hypotheses are supported (significant direct effect), which are partly supported (significant indirect effect), and which are rejected (non-significant effect).
3.2.4
Final research model
[image:28.595.41.571.193.542.2]Now that the results have been analyzed, the final research model including the correlation coefficients, regression coefficients, and explained variances are presented in Figure 2. In this final model, the construct facilitating conditions is divided into two separate variables. In addition, there are a number of paths added to make the model more fitting with the dataset of this study. These paths can be found in Table 3 on page 26 listed as “added”.
4
STUDY 2
4.1
Method
4.1.1
Research design
After the first study, three IoT professionals were interviewed to gain a deeper understanding and more qualitative insights on the results of the survey. On the basis of these insights, together with the survey results, the conclusion of this research will be drawn. From the survey results, multiple questions have been conceived which were the basis for the semi-structured interviews. Firstly, the participants were introduced to the research topic, the research model, and the main results of the first study. Secondly, the questions were one after the other discussed with the participants, in most cases with a short explanation of the hypothesis. During the interview, as a response to the participants’ answers, sub-questions were asked to obtain a clear picture of their views. The whole interview was voice-recorded to make it easier to process the results afterward. Finally, before ending the interviews, the participants were asked if they had any important additions.
4.1.2
Sample
The second study draws on a sample collected among IoT professionals via LinkedIn. There were no restrictions, as long as the participants were involved in IoT professionally. The first participant is professionally active in the digital world, with new technologies and is specialized in technology security. The second participant is CTO and co-founder of The Things Industries. They develop software for businesses (i.e. smart buildings) to connect sensors to the internet based on the LoRaWan protocol. The last participant is creator and inspirator at the Internet of Things Academy. They stimulate innovation through IoT by advising businesses and consumers in their IoT related problems or challenges and to connect different stakeholders in this field.
4.1.3
Measures
During the interviews, participants responded to a set of self-generated questions that were based on the results of the first study. The full set of questions can be found in Appendix E. Since the participants of this second study were not respondents in the first study, they were not conversant with the research variables and how these were measured. Therefore, throughout the interviews, the variables and the relationships between them were explained by means of the survey items, hypotheses, and the final research model. In this way, the participants were able to give their views on the main results of the first study.
4.1.4
Analysis
4.2
Results
1. The predictive value of customer commitment
The results of the interviews show that customer commitment is perceived as an important predictor since IoT is still more an optimization than that it has true added value in the eyes of customers. For instance, participant 1 stated that where a computer enabled people in doing things they were not able to do before, IoT does not entail this yet. Besides, IoT requires great behavioral change, because it is still unnatural and often useless for people. According to participant 2:
“it is the
commitment that is needed to make customers step over the behavioral threshold to use
IoT technology such as Google Home in their homes”.
2. Usefulness versus gadget-factor
Following the participants, the predictive extent of perceived usefulness is related to customer commitment. Certain technologies enable customers in things that they were not able to do before. These add value to the lives of customers. The potential of IoT, however, is not experienced by most of the people yet and therefore hard to imagine. As participant 3 stated, the usefulness of IoT can be a motivator for people to be committed to using IoT, but commitment can arise from only their interest in tech as well. According to participant 3, this is the stage in which IoT is located today:
“it still has a
fairly high fun- and gadget-factor that makes commitment way more important than the
usefulness”.
3. Customer commitment above perceived ease of use
Participant 2 used a metaphor that illustrates the possible absence of the relation between perceived ease of use and customer attitude. He stated that, in the near past, in almost every household there was a separate remote control for any television, DVD-player, receiver, VHS-recorder, digital decoder, etcetera. This is definitely no ease of use, but people still did it because they wanted to benefit from all these devices. In other words, in some cases, commitment reaches further than the ease of use in the adoption of new technology. Participant 3 added that according to him:
“commitment is the
number one factor in predicting customer attitude towards innovations such as IoT”.
4. “Musts” for the future of IoT
5. The classical problem of personal data
Participant 2 called the absence of correlation between use of personal data and personalization a classical problem. He argued that if you ask people about the use of their personal data, they immediately panic, while if you ask the same people about personalization they will say that they want their device to be fully adapted against their personal preferences. In all interviews it was mentioned that:
“probably most of the customers do not recognize the relation between these two
variables; the fact that personal data is required to personalize IoT”.
6. Human-likeness: comforting or scary?
The results indicate that all participants expected a relation between human-like interaction and customer trust. Participant 2 argued that in the case of Google Home, which is a personal assistant, the increasing role of AI will make it more intelligent and human and that this probably will lead to more trust in Google Home. In addition, following participant 3, if IoT becomes so human that it is hard to recognize as a computer, the level of trust will increase in a sense that consumers will share personal data easier. However, participant 1 stated that:
“maybe it is more pleasant to communicate with
a device that is absolutely not human, than communicating with a device that is just not
human enough”
.
All three participants agreed that the absence of the relation could be a result of the lack of experience among consumers with IoT.7. The ambivalence of autonomy
According to all participants, autonomy is a difficult construct to measure since not many customers are able to imagine the impact of it yet. Participant 1 and 2 argued that:
“one respondent
can perceive autonomy as a positive aspect of IoT and the other as a negative”
.
That devices and sensors control the home environment is already an enormous step. The idea that these devices are going to make choices without external control is probably still too vague or can be perceived as out-of-control. Following participant 2 and 3, there can be made a clear distinction within IoT regarding the desired autonomous capabilities of devices. For some products, customers probably want them to be autonomous, such as thermostats, but for other products they do not, such as curtains. He argued that if autonomy is implemented well, it can have large added value, but if it not, it will certainly work against these variables.8. Commitment overrules price
9. Interest versus knowledge
Following participant 1, an explanation for the result that age and education are not significant predictors for customer attitude and intention to use,
“is the notion that younger and higher
educated people will probably be more interested in technologies such as IoT, but also have
more knowledge and thus concerns about the potential risks”
.
Participant 2 however, stated that it is all about commitment and that commitment cuts through age and education. He argued that customer attitude and intention to use are more influenced by if people like technology and innovation and those people are in all age and educational groups.10.Important predictors for the adoption of IoT
5
DISCUSSION
5.1
Main findings
The primary goal of this research was to answer the research question: what are the determinants of customer attitude and intention to use in the context of IoT in home environments and Google Home in specific? This question has first been studied through an online survey among mostly people with no IoT experience in their home environments. Thereafter, three IoT professionals have been interviewed to further deepen the understanding of the results. The findings showed that customer attitude is directly determined by perceived usefulness, customer trust, customer commitment, and social influence, in which perceived usefulness and customer commitment are the strongest predictors. However, against the assumption of TAM, the results indicated that perceived ease of use influences customer attitude only indirectly in the context of IoT in home environments. In the interviews, it was argued that in some cases commitment reaches further than the ease of use in the adoption of new technology, which may cause the result that ease of use is a less relevant variable in predicting customer attitude. Furthermore, it appeared that perceived usefulness, which is influenced by perceived ease of use, and customer commitment are the most decisive for shaping customer attitudes.
Although the results showed that customer attitude and customer commitment are determinants for the eventual intention to use, again opposing the assumption of TAM, perceived usefulness does not influence customer intention directly. This can be explained by the notion that customers expect and desire more from new technology than mainly being useful, which was a result of the second study. Today, useful and well-working technology is becoming the standard. Customers desire more personalized experiences that make them feel good and get them committed to it. According to a report from Gartner, 89% of the company’s state that today, instead of the product, customer experience is their primary basis of competition (Sorofman, Yates, & Ray, 2016). Moreover, the absence of a direct relation between perceived usefulness and customer intention can be explained by the understanding that IoT does not certainly enable customers in things they were not able to do before.
It is a noteworthy finding that customer commitment is strongly influenced by most of the independent variables, influences customer trust, and is highly related to customer attitude and intention to use. Prior to this research, both these variables were identified as the main variables for this study, since a positive customer attitude and intention to use is needed for the adoption and integration of IoT technology in customer lives, and hence necessary before customer relationships can be built. In this study, customer commitment measured the extent to which customers are willing to invest their time, energy, and personal data in IoT technology because this enables them to maintain the relationship and fully benefit from it. Based on this operationalization and the findings of both studies, customer commitment may be the most determinative factor for actually building customer relationships, even more than customer attitude and intention to use. According to participant 2, in the early-adopter stage, it is the commitment that is needed to make customers step over the behavioral threshold to place IoT technology such as Google Home in their home environments. Furthermore, as hypothesized, based on the relationship marketing model of Morgan and Hunt (1994), customer commitment and customer trust are related to each other. Following their model, these two variables are fundamental to be able to build customer relationships. This is consistent with the current study, which showed that customer commitment is a predictor of customer trust and both strongly influence customer attitude.