University of Warwick institutional repository: http://go.warwick.ac.uk/wrap
This paper is made available online in accordance with publisher policies. Please scroll down to view the document itself. Please refer to the repository record for this item and our policy information available from the repository home page for further information.
To see the final version of this paper please visit the publisher’s website. Access to the published version may require a subscription.
Author(s): Kevin Denny, Orla Doyle, Patricia O’Reilly and Vincent O’Sullivan
Article Title: Money, Mentoring and Making Friends : The Impact of a Multidimensional Access Program on Student Performance
Year of publication: 2010 Link to published article:
http://www2.warwick.ac.uk/fac/soc/economics/research/workingpapers/ 2010/twerp_932.pdf
Money, Mentoring and Making Friends : The Impact of a
Multidimensional Access Program on Student Performance
Kevin Denny, Orla Doyle, Patricia O’Reilly and Vincent O’Sullivan
No 932
WARWICK ECONOMIC RESEARCH PAPERS
Money, Mentoring and Making Friends:
The Impact of a Multidimensional Access Program on Student
Performance
Kevin Denny
a, Orla Doyle
b, Patricia O’Reilly
c, Vincent O’Sullivan
da
UCD School of Economics & UCD Geary Institute, University College Dublin, Belfield, Dublin 4, Ireland.
E-mail:[email protected]
bUCD Geary Institute, University College Dublin, Belfield, Dublin 4, Ireland.
E-mail: [email protected]
c
UCD Geary Institute, University College Dublin, Belfield, Dublin 4, Ireland.
E-mail: [email protected]
d
Department of Economics, University of Warwick,Coventry, CV4 7AL – UK.
E-mail:[email protected]
Version 4.8, 7thApril 2010
Abstract
There is a well established socioeconomic gradient in educational attainment, despite much effort in recent decades to address this inequality. This study evaluates a university access program that provides financial, academic and social support to low socioeconomic status (SES) students using a natural experiment which exploits the time variation in the expansion of the program across schools. The program has parallels with US affirmative actions programs, although preferential treatment is based on SES rather than ethnicity. Evaluating the effectiveness of programs targeting disadvantaged students in Ireland is particularly salient given the high rate of return to education and the lack of intergenerational mobility in educational attainment. Overall, we identify positive treatment effects on first year exam performance, progression to second year and final year graduation rates, with the impact often stronger for higher ability students. We find similar patterns of results for students that entered through the regular system and the ‘affirmative action’ group i.e. the students that entered with lower high school grades. The program affects the performance of both male and female students, albeit in different ways. This study suggests that access programs can be an effective means of improving academic outcomes for socio-economically disadvantaged students.
JEL Classifications: I21
Keywords:Education inequality, Access programs, Natural experiment, Economics of education
There is a pronounced socioeconomic gradient in educational attainment, particularly at
university level (see Digest of Education Statistics, 2007 for USA; Eurostudent, 2005 for
Europe). Poor attainment by low socioeconomic status (SES) groups limits inter-generational
mobility and reinforces socioeconomic inequalities. As there are many possible causes for such
inequalities, including institutional barriers, low quality schooling, credit constraints or lack of
parental investment, policies designed to address them vary considerably in their emphasis.
Recent work has suggested the relative unimportance of credit constraints for university
education in the US and the UK (Carneiro and Heckman, 2003; Dearden, McGranahan, and
Sianesi, 2004) and emphasized the higher returns to early intervention in improving educational
outcomes (Cunha and Heckman, 2007; Heckman, Moon, Pinto, Savelyev, and Yavitz, 2009b).
Nonetheless, the most prevalent educational policy in most countries is targeted intervention
programs by universities and colleges to boost enrolment and retention by disadvantaged social
groups.
While access programs are becoming increasingly diverse in their approach to tackling
the barriers to progression and promoting success at university, the majority of programs focus
exclusively on providing financial supports to students. Thus much of the literature, as
demonstrated in a review by Deming and Dynarski (2009), concentrates on the effectiveness of
financial aid programs such as the Pell Grant and the HOPE scholarships. There are also some
programs that couple financial aid with other forms of outreach initiatives such as academic and
social supports. Yet evidence of the effectiveness of these more multifaceted programs is
lacking, with only a few rigorous studies adopting experimental designs or convincing natural
experiments (see, for example, Angrist, Lang, Oreopoulos, 2009; Brock and Richburg-Hayes,
This study contributes to this literature by using a quasi-experimental design to evaluate
a comprehensive university access program (AP) which operates at a large Irish university with
over 20,000 undergraduates and postgraduates. The AP identifies students in disadvantaged high
schools that are linked to the program based on a set of eligibility criteria. The program operates
a range of pre- and post- university entry support mechanisms which provide financial aid, as
well as academic and social support. Evaluating the effectiveness of access initiatives targeting
disadvantaged students in Ireland is particularly salient given that the rate of return to education
is higher than in other European countries and comparable to the US (Trostel, Walker and
Woolley, 2002). Furthermore, educational inequality is high in Ireland where, out of twenty
OECD countries, the correlation between father’s education attainment and their children’s
education is greatest (Chevalier, Denny and McMahon, 2009), indicating that there is a need for
policies to improve intergenerational mobility.
There is a well developed literature that shows the positive effects of financial aid on
enrolment to university (for example, Cornwell, Mustard, and Sridhar, 2006; Kane, 2003;
Dynarski, 2003). The magnitude of this effect is typically around a 5% or less increase in
enrolment for a $1,000 reduction in student costs (Deming and Dynarski, 2009). Financial aid
can also have a positive effect on university completion rates and graduating on time (e.g.
Scott-Clayton, 2009; Dynarski, 2000). There is also some evidence that academic support programs,
without financial aid, can be effective. Lesik (2007) finds a positive relationship between a
remedial mathematics program and student retention using a regression discontinuity design. In
addition, Scrivener et al. (2008) identify a positive treatment effect on first semester academic
performance in an experimental evaluation of the Open Doors program in a US community
However there have been relatively few studies that examine programs such as the AP
discussed here, that combine financial aid with academic and social supports. Exceptions include
Angrist, Lang and Oreopoulos (2009) which conducted an experimental evaluation of the
Student Achievement and Retention (STAR) project in a Canadian university. Students were
randomly assigned to three groups which received academic support, financial incentives or a
combination of the two. The program was found to reduce the probability of first year
withdrawal by 10% and had positive effects on GPA. These effects were greater for students who
received the combined financial and academic supports, yet the effects were for women only.
Another study by Brock and Richburg-Hayes (2006) evaluates the impact of a Louisiana
needs-based scholarship program on course completion and exam performance of low-income
parents attending community college. Students were randomised into a treatment and control
group. In addition to the regular financial aid received by the control group, the treatment group
students were given scholarships of $2,000 per annum if they attended at least half-time and
attained, on average, a C grade. While both groups could avail of counselling services, the
treatment group were obliged to attend student counselling in order to receive the financial aid.
The program had multiple positive effects, in particular the treatment group were more likely to
be full-time college students, passed more college courses and earned more credits, and were
more likely to register for their second and third years of college.
In addition to the financial, academic and social elements of the Irish access program,
another key aspect is that preferential entry to university is given to some students i.e. some AP
students enter university with grades that are lower than the regular minimum grades necessary
to be offered a place at university. Although this preferential treatment is not based on ethnicity,
programs (Deshpande, 2006). Affirmative action programs based on ethnicity have proved
controversial in recent years (see Fryer and Loury (2005) for an interesting discussion). One
criticism is that race-based affirmative action is seen to favour economically well-off minority
students. This has led to calls for the ethnicity criteria to be replaced with socio-economic
criteria. The Irish AP, which is based on socio-economic criteria alone, may therefore be
informative for policymakers considering a switch away from such race-based criteria.
In the absence of a randomized control trial, our analysis relies on a natural experiment
which exploits the gradual and non-systematic expansion of the program over time. The
identification strategy compares students from high schools which were chosen to be part of the
program in the early years to those that were chosen to join the program in later years. As there
was no systematic difference in the characteristics of the high schools which joined the program
at different times, a comparison of students from these schools allow us to identify the treatment
effect. Our analysis examines multiple outcomes including first year exam performance,
progression rates to the second year of study, and the probability of graduating. In addition, we
model the impact of the program on final degree classification which is often overlooked in the
literature, despite some studies finding a high rate of return to university grades (see Jones and
Jackson, 1990; Schweri, 2004; Bratti, Naylor and Smith, 2007).
Overall, we find positive program effects on first year exam results, progression to
second year, and graduation rate, with the impact often stronger for higher ability students.
Unlike the Angrist et al. study, we identify effects for both male and female students. We find
similar patterns of results for treated students that entered through the normal entry system and
analysis is based on university administrative data, therefore all results are conditional on the
student having applied and been accepted into the university.
The paper is organised as follows: Section II describes the access program in detail.
Section III discusses the methodology employed and data used in the analysis. Section IV
presents the main results of the analysis and a description of the sensitivity analysis conducted.
Section V discusses the results and concludes.
II.
Description of the Access Program
The program has been operating since 1997 and aims to increase university participation
and improve the academic performance of students from socio-economically disadvantaged
backgrounds through a range of pre- and post- entry support mechanisms. Much of its pre-entry
activities involve outreach activities with disadvantaged schools at both primary (4-12 years) and
second level (12-18 years) which focus on raising student aspirations and creating an awareness
of further education. These activities include field trips to the university where students attend
sample lectures, participate in science labs, as well as a variety of sports and social activities.
The AP also organizes pre-entry orientation programs and shadowing days where high school
students follow a university student through a day at university. The program also provides direct
academic support to high school students for the university entrance exam in the form of
one-to-one tuition and revision workshops. On a community level the AP gives presentations to parents
and contributes to community-based events. The number of pre-entry activities provided to
2002, and six in 2003 and 2004.1 The aim of these pre-entry activities is to increase the number
of applications to university by disadvantaged students.
The AP also provides information to the students about its alternative entry mechanisms
into university. The regular Irish university admissions system is a nationally administered
clearing mechanism based on supply and demand for university places across all of the third
level institutions. Prior to taking the final state exams at about age 18, high school students rank
their top ten preferred degree courses. Their chosen courses may be at different universities
and/or be different courses at the same university. Several months later they take their final state
exams. These exam grades are converted to a points-scale from 0-600 in increments of 5 points
and are used to rank the students. Offers for a place on a particular course at a particular
university are made to the highest scoring students who applied for that course at that university.2
Further offers are made on the basis of grades until all places have been filled. Students who are
not offered their first ranked course are then considered for their second ranked course and the
process continues until all places are allocated. The supply of places on degree courses seldom
changes from year to year. The minimum points necessary for a place on a course, which is set
by the grades of the last person admitted, can fluctuate from year to year.
Under the AP, two types of students are treated. “Merit Treatment” students are admitted
to university through the nationally administered admissions system described above. About
45% (from a total of 100-140 students per annum) of AP students attain sufficient grades to meet
1 The activities include: shadowing days, voluntary tutoring, Take 5, Uni 4 U summer school, 5th Year summer
school, achievement awards, educational funding, Uni in Community, Leaving Certificate Exam workshop, Discovering University, Discovering Maths, and the HEAR Scheme.
2
the minimum points level for regular university entry and are allocated a place on their preferred
course in the usual manner.
“Discount Treatment” students (the remaining 55% of the total) receive preferential
treatment in attaining their university place such that they receive a concession of up to 20% on
the competitive entry points for the course set by the national admissions system. Thus a certain
number of places on each course is reserved for students who do not meet the minimum points
level required for that course. To be offered one of these places they must meet certain basic
requirements (e.g. a medical student must have studied science at high school) and provide
further information regarding their socio-economic circumstances (discussed below) as well as
references from their high school teachers3. The number of minimum reserved places on each
course is based on the size of each faculty in the university and is relatively fixed. If there is a
surplus of suitable and eligible applicants for these places, the limited places are awarded on the
basis of points attained in the final school exams.
Note that AP students are not guaranteed a place in the university. Essentially, the
number of points they receive in the school exam and their preferred course choice determines
whether they are classified as Merit or Discount students. Discount students are not necessarily
of a lower ability than Merit students, rather, they may have applied for a course that required
higher minimum points.
Post-entry, both Merit and Discount AP students receive the same supports. Students
receive an extra top-up grant which supplements the regular means tested government grant4and
3These references are only considered in tie-break situations i.e. where two or more students with the same points
are competing for a place on the same course. Therefore, this subjective information is not used by the AP office in the majority of cases.
4The majority of AP students are in receipt of the means tested government grant which is valued at€2900 ($4265
in most cases, doubles the amount of financial aid they would otherwise receive. This grant
totalled between €2200 ($3236 in 2008 prices) and €3400 ($5000 in 2008 prices) per annum
during the period under analysis. In addition, they receive book vouchers and course materials
such as laptops, lab coats, etc. The AP students are also provided with a number of post-entry
supports geared towards liaising with students once they have commenced their studies. They
participate in a pre-term orientation week where they live on campus with other AP students to
encourage early social and academic integration. To help maintain their academic standards
while at university, they also receive free additional tuition, if required, in the form of one-to-one
and group tutorials. Finally, the AP students can avail of social supports, if required, from
student advisors in the AP office.
In order to be eligible for the program, for both Merit and Discount students, must meet four
criteria. First, eligibility is means tested such that parental income has to be below a certain
threshold which shadows the eligibility for the regular means tested government grant which is
available to all students whose family income falls under these thresholds (and unlike the AP, it
is available to all low SES students regardless of the high school attended). As family income is
not available in the data, one of the selection criteria for choosing the Control group is based on
receipt of the regular grant. Second, in order to be eligible for the AP, neither parent must have
graduated from university. Third, the student’s parents must be a member of the following
agricultural workers.5Students whose parents are professionals, employers or managers are not
eligible for the AP. As measures of parental education are not available in the data,
socio-economic status is used as a proxy for parental education.6Finally, the student must be attending
a high school which is designated as ‘disadvantaged’. This criterion is key to the identification
strategy and is discussed in detail below.
III.
Data and Methods
A. Identification Strategy
The identification strategy is similar to that in Lavy and Schlosser (2005) which relies on the
expansion in the number of schools participating in a remedial educational program in Israel.
Hence the identification strategy exploits the gradual, and non-systematic, expansion of the
program into high schools over time.
The key eligibility criterion of the AP is whether a student attended a disadvantaged high
school linked to the AP prior to entering university. When the program began in the late 1990’s,
certain high schools were identified from the Government’s list of officially designated
disadvantaged high schools and became linked to the AP. Schools are included on the
Government’s list based on a range of socio-economic and educational indicators such as local
unemployment rates, measures of poverty and information on basic literacy and numeracy levels
5 There is some evidence that farmers and self employed people circumvent the rules on grant eligibility
(Department of Education, 1993) so by including these groups we could have control student who are better-off financially than the treatment group. Furthermore, as rural schools tended to join the program at a later stage, we do not wish to conflate the effect of coming from a rural background with that of the program. Therefore farmers are excluded from the Control group. It is not possible to identify self employed people using the socioeconomic categories observed in the data.
6
in the area. Over time more schools from this list were linked to the program when funding
allowed.7 The data available for the analysis covers 1999 to 2004, therefore schools linked to the
AP in 1999 or before represent an “always” covered group i.e. students from these schools, who
have satisfied the other eligible criteria, are always in the treatment group in the analysis. Those
schools who were included in the program for the first time in 2005, or after, represent a “never”
linked group.8
Essentially, the analysis compares the treated students who participated in the AP, to
students who met all of the other eligibility criteria discussed above, except their schools had not
yet become linked to the AP at the time they came to university. However, these students’
schools eventually became linked to the program. The Treatment group is therefore all Merit and
Discount students who attended a disadvantaged school linked to the program and entered the
university between 1999 and 2004. We conduct the analysis using both groups pooled together
and for the Discount and Merit students separately. The Control group consists of students who
were in receipt of a state grant, members of one of the six identified lower social-economic
groups, and attended a disadvantaged school which was not linked to the program at university
entry, but later became linked to the program.
B. Assumptions of the Identification Strategy
The identification strategy is based on the assumption that there was a random selection of
schools into the program. One concern with the expansion of the program is whether the date at
which schools became linked to the program depended on the characteristics of the school. If
7No school which joined the access program has been dropped or exited from the program. 8
there was a non-random selection of schools, this may bias the results as the Treatment group
(those who joined earlier) and the Control group (those who joined later) may systematically
differ. However for several reasons we believe this is not the case. First, there was no
self-selection of the schools into the program as the schools were chosen by the AP to join the
scheme. Second, there is little overt heterogeneity in the quality of high schools linked to the AP.
The Government list from which the schools are drawn is not a ranking and thus each school is
regarded as being equally disadvantaged in that they all receive the same level of additional
government funding compared to regular schools. When the program first began, the AP worked
with schools that were geographically close of the university, and when funding allowed, the
program expanded to include schools in different regions. Thus the expansion of the program
was geographically, rather than socioeconomically, based. In addition, the expansion of the
program to new schools was dependent on funding from the Irish government, the EU and from
other philanthropic bodies, and as such can be viewed as an exogenous source of variation in the
treatment group. These factors reduce the likelihood that the schools which joined the AP at
different times were systemically different.
A further source of exogenous variation in the expansion of the AP was the introduction
of a national access scheme in 2001 to co-ordinate the allocation of places for access students
amongst nearly all Irish universities. Prior to the introduction of this scheme, the university in
this study was generally linked with schools in its own defined catchment area. Students who
met the eligibility criteria, but attended schools linked with other universities, could not take part
in this particular access program, yet they could attend the university without being treated. After
2001, students from schools in the catchment area of other universities could apply for the AP at
schools did not receive the pre-entry supports9. This major administrative change occurred
during the period covered by the data and represents an exogenous policy change that greatly
expanded the number of linked high schools.
To provide evidence that the date on which a school joined the AP is not a function of its
individual characteristics e.g. school quality, Table 1 presents two local labour market
characteristics of the electoral district of the link schools prior to them becoming linked.10The
table indicates that there is no clear relationship between the characteristics of the school’s
neighbourhood and the year in which the school joined the program. Apart from 1999 when the
local unemployment rate and proportion leaving school before age 18 is higher than subsequent
years, there is no systematic variation in the rates over time. This suggests that Control group
students did not attend schools in neighbourhoods that are significantly better or worse than the
treated schools which became linked earlier.
Under normal circumstances, a student must have attended the same linked school for a
total of five years before applying to the university to avail of the program, however exceptions
are made for recent immigrants or returned emigrants. Despite this, there may be a concern that
parents chose to send their children to high schools that were linked to the program in order to
avail of the AP supports, and the alternative entry mechanism in particular. In Ireland, there are
no geographical restrictions on school choice (i.e. no catchment areas), so in principle, there
could be self-selection into an AP linked school if, for example, families who send their children
to an AP linked schools have some unobservable characteristics which also affect student
outcomes. A priori this is unlikely for two reasons, firstly, AP schools are typically clustered into
9Although they may have been treated by the university which was originally linked to their school. The majority of
Irish access programs offer similar pre-entry supports to those provided by this AP.
10Aggregate exam results for each school are not available to the researchers, therefore local labour market and
disadvantaged neighbourhoods, so the switch to an AP school would require the student to travel
a significant distance to another school, secondly, many low SES parents are unaware of the AP
status of the school prior to school entry, as much of the AP supports do not begin until the later
grades.
C. Self Selection & the Control Group
As we only observe students who attend this university, our analysis is conditional on enrolment.
A consequence of this is that our Control group, who are socio-demographically similar to the
Treatment group, may be a self-selected group as they choose to attend university without the
safety net of the access program. Such students may perhaps be unobservably more able or more
motivated. Table 2 reports the average university entry grades for the Treatment and Control
students. While the grades of the Control students are slightly higher than the Treatment
students, by between 2% and 10% (9 and 48 points), there are no systematic changes in the
ability of either the Treatment and Control group over time, suggesting that the composition of
the groups are not changing.
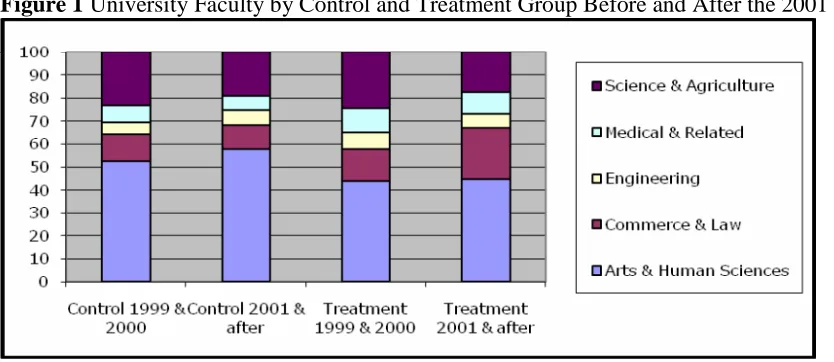
In addition, Figure 1 shows the university faculty of the Treatment and Control group
before and after the 2001 introduction of the national access scheme. It shows that firstly, there
is little difference between the faculty of choice for the Control group before and after 2001
suggesting that the introduction of the reform did not change the faculty choice of the Control
group, and secondly, there is little difference in the faculty of the Treatment and Control groups,
with slightly more AP students studying Commerce and Law after 2001.
While these data suggest that the Control group do not differ in quality, over time, in any
the treatment effect may be an underestimate of the true treatment effect. To account for this, we
control for both ability (school grades) and faculty in our models.
D. Pre- and Post-entry Effects on Treatment Group
A potentially important issue is that our results are conditional on treatment students having
entered the university. Hence, the initial pool of applicants to university is not observed and so
we do not model selection into the university. It is possible that both school grades and faculty of
choice are influenced by the pre-entry supports provided by the AP (such as the outreach
activities and academic support), and hence there may be a correlation between unobservables
that affect the outcome and the probability of treatment. As we only evaluate university based
outcomes, such as drop-out and exam performance, it is conceivable that the results may be
driven by such selection effects in either a positive or negative direction. On the one hand, the
pre-entry supports may increase the student’s university entry exam grades either directly
(through additional tuition) or indirectly (by improving motivation). On the other hand, there
could be a complacency effect in that the student reduces their effort in their entry exam in the
belief that they may be able to enter university with lower required grades. This impact of this
selection effect on the results will depend on which effect dominates. It is also possible that the
pre-entry supports were not effective at improving entry exam grades and thus progression to
university. In this case, any observed treatment effects on university outcomes could be
attributed to the post entry supports and selection into university would not be an issue.
As the distribution of the pre-entry supports is not uniform across all linked schools we
can investigate these potential effects. Some schools receive more pre-entry activities than
schools that are located in the cities, receive more supports than the rural schools. In addition, the
number of services provided to schools typically increased over time. To investigate the impact
of the variations in pre-entry supports, we will estimate our results separately for students that
attended schools which received full pre-entry support and those that attended schools which
only received limited pre-entry support.
E. Identifying Suitable Controls for Discount Students
As we are comparing Discount students to students who have higher university entrance exam
grades, a potential concern is that our Treatment and Control groups are not comparable.
However this is not necessarily the case as there is an overlap in the support of the entrance exam
grades for these groups. Table 3 shows that the distribution of university entrance exam grades
intersects for Control students and all but the lowest achieving Discount students. In some cases
we have Control students with the same university entrance exam grades as Discount students in
the same course but who entered the university in a year where the minimum points level had
been lower. For example, there are Discount students who entered the Agricultural Science
degree in 2001 with 320 points when the minimum required for the general student body was
330, and the following year a Control student entered with 320 points as the minimum required
had fallen to 310.
Note that all of our estimates control for the faculty of the student, rather than the
individual degree course within that faculty (which will have similar modes of teaching and
assessment) which also allows us to identify Discount and Control students with the same
Physiotherapy (minimum 500 points) with 505 points and Discount students doing Radiography
(minimum 520 points) with 505 points.
However for the Arts degree course, which is the lowest entry course and the largest
course, there are Discount students who have lower points than anyone else in the university and
few Control students with similar level of points. Table 3 shows that, in particular, there are large
differences in the number of Discount and Control students in the lowest points category. While
this will not affect the results for higher achieving student (>400 points), it may downwardly bias
the results for the low point students if we are comparing the low point Discount students to
Control students who mostly have higher points.
F. Method
Rather than using a standard ‘differences in differences’ method which would require controlling
for school fixed effects by including dummy variables for each school, we estimate a simple
‘differences’ model. This issue arises as there are over 300 linked schools involved in the AP and
only 322 students in the Treatment group. While we report differences-in-differences results in
the appendix, which includes individual school dummies to identify school fixed effects, we do
not report them in the main results as our relatively small sample size places restrictions on our
ability to control for initial conditions.11
For the binary outcomes, such as progressing to second year, graduating and graduating
on time, we estimate linear probability models and for the categorical outcomes, such as first
year exam results and final degree classification, we estimate ordered probit models. These
11Due to the very nature of the program some schools only send a very small number of students, if any, in a given
models control for faculty, year of university entry, and number of points attained in university
entry exams12, however only the results for the main outcomes of interest are presented.13
G. Description of Data
We use pooled cross sections of student level administrative data containing information on all
students entering the university from 1999 to 2004 inclusive. The data contain information such
as student outcomes at university, pre-university academic performance, high-school attended,
grant status, the student’s age, gender, treatment status, and markers of eligibility such as the
socio-economic group of the student’s family. Some school-level information was matched to
the individual student-level data using a school identifier. For example, census information on
labour market conditions, such as average years of schooling and unemployment rates in the
electoral district of a particular school were included. School level information regarding exam
results and other school “quality” variables could not be included as this information is not
available to researchers in Ireland.14,15
Broadly speaking, our outcomes of interest measure different facets of academic
performance in the first year of university as well as the overall performance of the student in
12
Throughout these models we have controlled for university entrance exam points linearly, however, broadly speaking the pattern of results holds when controlling for university entrance exam points using different non-linear functions.
13The full set of results are available upon request.
14Fewer than 15% of observations could not be matched. This includes students with missing school information,
overseas students, those from Northern Ireland, and those from schools which have since closed. We only examine students when making their first attempt at a course in the university. Those who switched courses or repeated a year have had their later observation dropped. Unfortunately, it is not possible to detect students who have transferred from other universities.
15 The working sample excludes those who have no school-level data and students who entered the university
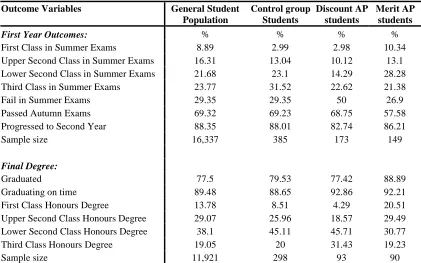
their degree course.16 Table 4 shows the grade classification in first year exams and proportion
of students progressing to the second year for Discount and Merit AP students, Control group
students and the general student population. The first year exam results are categorised using the
first, second upper, second lower and third categories traditionally used in Ireland and Britain
rather than using the exact grades or a North American-style GPA system. A comparison of the
British/Irish and North American grading system is provided in Appendix Table A1. Table 4
identifies a striking difference in the performance of Discount and Merit groups, with Merit
students typically outperforming the Discount students. 10% of Merit students attain a first class
honour, compared to only 3% of Discount students and 9% in the general student body. While
about 20% of both Merit and Discount students attain a third class honours. The first year
summer exam failure rate of ~50% is very high for the Discount students whereas Merit students
perform quite favourably compared to the Control group and the general student population.
Progression to second year is defined as passing either the summer exams or the repeat exams.
Table 4 shows that both Treatment groups have lower progression rates to second year than the
Control group and general student population. It is worth noting that the progression rate of
Discount students, while lower than the other groups, is just over 80% despite that only half of
these students pass the exams at their first sitting.
The analysis also examines the probability of graduating, graduating on time and final
degree classification. The sample size at this point is smaller as many of the students who had
entered university in the later years had not been in the university long enough, at the time of
data collection, to complete their degree in the normal time-frame. Table 4 shows that graduation
16
rates for Merit students are higher than the Control and the general population groups and that
Discount students have graduation rates similar to both of these groups. Graduating late will
have explicit costs of studying for at least an extra year. In Ireland, there is an extra disincentive
to not delay graduation as tuition fees, which are normally waived for Irish students, are payable
for repeated years of a degree course. There are also implicit costs of forgone graduate earnings.
Table 4 shows that, of those who do graduate, the proportion of those graduating on time is
slightly higher amongst both Treatment groups.17 For those who do graduate, final degree
classification for Discount students compares slightly less favourably than for Control students.
However it is striking that around one-fifth of Merit students receive a first class honours.
Tables 5, 6 & 7 show the socio-demographic and academic characteristics of the students
broken down by the four categories. Table 5 shows, of the total number students in the sample,
the percentage admitted to the university each year. The Control group and the general student
population are more evenly spread across the years than either Treatment groups due to the
expansion of the AP. The number of treated students, both Discount and Merit, represent less
than 2% of the total admissions to the university each year.
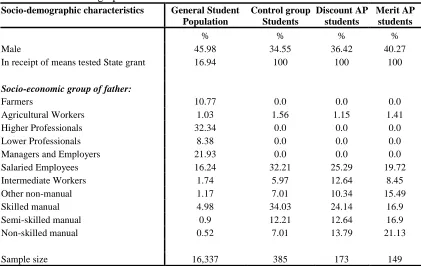
Table 6 shows that females are over-represented in the AP relative to the general student
population. All students in the Control and both Treatment groups receive the regular
means-tested government grant as the income eligibility rules for the AP are the same. For similar
reasons, the distribution of students across parental socio-economic groups is restricted to lower
socio-economic groups for the Control and both Treatment groups and is quite unlike the
distribution of the general student population. Table 6 shows that the parents of the Control
group are mostly salaried and skilled-manual workers and students in the Treatment groups are
17Unfortunately it is not possible in this data to distinguish between students who repeat years because of failing
more likely to have parents in less skilled groups whereas the managerial and professional
category is the largest group among the general student body.
Table 7 shows the distribution of students across the university’s faculties. The Control
group and the Discount group are more heavily concentrated in the Arts and Science faculties
compared to the general student body as these faculties have lower minimum entry standards
than the other faculties. The distribution of the Merit group more closely resembles the
distribution of the general study population, with the exception being a greater number in the
Commerce faculty. The next section estimates the causal impact of the AP on these outcomes.
IV.
Results
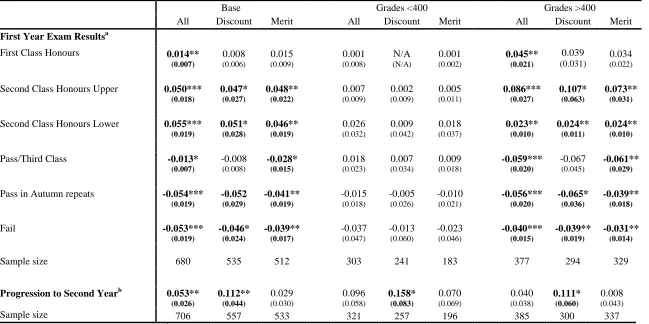
The impact of the program on the first and final year outcomes for both the Discount and Merit
groups is presented in Table 8. The same Control group is used in each analysis. Separate results
are also presented for students who attained 400 points or less in their university entrance exam,
and for students who achieved more than 400 points, to determine if the AP has differential
effects across high and low ability students. 400 points is roughly the 75th percentile of
attainment in the final state exam taken by school leavers and is sufficient to enter the two largest
faculties in the university, Arts and Science, with more prestigious courses like Law and
Medicine requiring well in excess of 500 points.
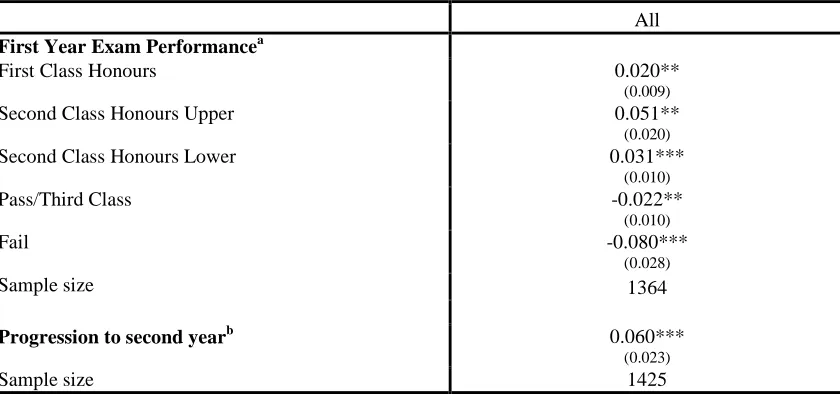
A. First Year Exams
Table 8 shows that the AP has a positive effect on first year grades, such that the entire
distribution for first year exams is shifted upwards for both types of Treatment students. While
more likely to attain either an upper second class grade or a lower second class grade than
students from the Control group. Merit students are less likely to achieve a third class honour
grade. The marginal effect of the program on passing the Autumn repeat exams is negative for
Merit students. However it should be noted that in this ordered model we have ranked ‘passing in
the repeat exams’ as a worse outcome than passing in the summer exams, but better than failing
overall. Therefore, the negative marginal effect of the program on passing in the repeat exams
can be explained by the program reducing the need to sit repeat exams, and hence does not
necessarily contradict the positive effect on passing the repeat exams. Both Discount and Merit
students are also less likely to fail their first year exams. Merit students are 3.9% and Discount
students 4.6% less likely to fail their summer exams relative to the Control group. Table 8 also
shows the impact of the AP on first year exam results for high (>400 points) and low point (<400
point) students. It shows that the exam result effects are been driven by the high point students
alone, with none of the results for the lower point group being significant. Therefore the program
is primarily generating exam benefits for the higher ability students.
Table 8 also shows that the program increases the probability of progressing to second
year for Discount students by 11.2%, while having on effect on Merit students. When the results
were estimated separately for high (>400 points) and low point (≤ 400 points) students, the effect
of program participation remains positive and significant for both high and low ability Discount
students. Low point Discount students are 15.8% more likely, and high point Discount students
are 11.1% more likely, to progress to second year.
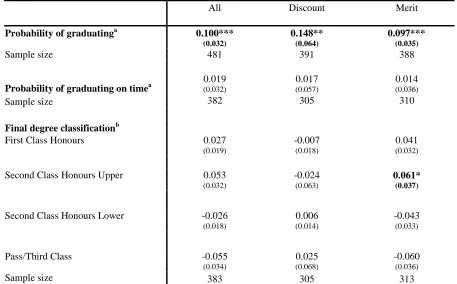
Table 9 presents the impact of the AP on the probability of graduating from a degree course. It
shows that, overall, program participation has a large positive impact on graduation rates for both
Merit and Discount students. Merit students are 9.7% more likely to graduate from their degree
program, while Discount students are 14.8% more likely to graduate. However, Table 9 also
shows that the AP has no statistically significant impact on the probability that students will
graduate on time. A similar result is found in regards final degree classification. The Ap has no
statistical impact on the final exam performance of Discount students and for Merit students
there is only one significant result: they are 6.1% more like to attain an upper second class
honours grade. Therefore, while the program has some long term effects, they are mainly related
to helping the student to reach the final year, rather than their overall degree performance. Due to
sample size limitation it is not feasible to divide the final year outcomes into high and low point
students.
C. Selection Effects
As discussed above, one may argue that the AP’s entry treatment may be changing the
pre-entry academic achievements of the students. The pre-pre-entry activities, such as summer schools
and extra tutorials, may directly improve performance in the university entrance exam, thus
upwardly biasing the treatment effects observed above. As the pre-entry activities were primarily
conducted at urban schools, we re-estimate the results for students who attended limited
pre-entry support schools and full pre-pre-entry support schools18.
18
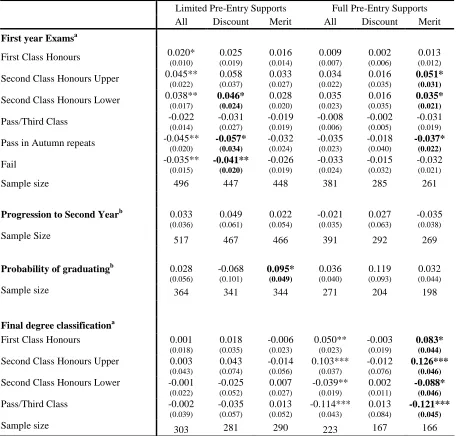
The results presented in Table 10 show that there are few differences in the treatment
effects for the students that attended either the limited or full pre-entry support schools. The
program has some impact on the first year exam grades of Discount students from limited
support schools and Merit students from full support schools. However, the program has no
impact on the progression rates to second year for students from either school type. For final year
outcomes, the program only has a positive impact on graduation rates for the students who
attended the limited pre-entry support schools, yet only affects students in the high support
schools in terms of final degree classification. Therefore there is little evidence that students
from the high support schools are systematically better than the students from the limited support
schools suggesting that the pre-entry activities are having a minimal effect on the pre-entry
academic performance of the students and that the main results are not driven by selection bias.
D. Robustness, Sensitivity and Extensions
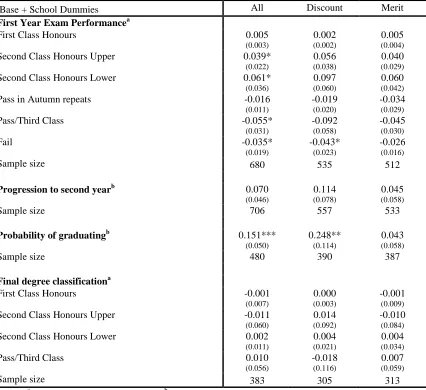
While the main analysis does not control for school fixed effects due to the large number of
dummy variables that would need to be included in the analysis, Table 11 reports the results of
the estimation including approximately 160 high school dummies. In general, these models show
that we largely replicate the original analysis, albeit with less precision.19
As an alternative to using school dummy variables to pick up school fixed effects we
could alternatively use some measure of school quality. However school quality variables are not
19
publicly available in Ireland so it is difficult to ascertain the heterogeneity in the quality of
schools linked to the program. In one of the few sources available to us, The Sunday Times
Guide to Secondary Schools in Ireland, nearly all of the ~300 schools20linked to the AP are in
the bottom 300 places when ranked by the proportion of students that enrol in university. In
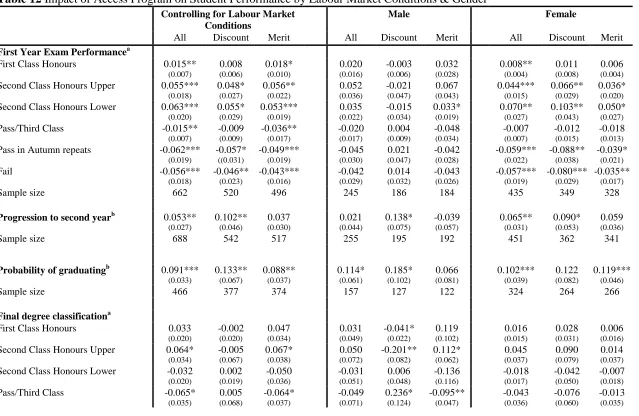
order to control for different levels of socio-economic disadvantage in the neighbourhood of the
student, Table 12 shows the impact of the program when controlling for labour market
conditions in the locality of the high school. The results are largely in line with the original
analysis in terms of size and significance suggesting that there was no systematic selection of the
high schools over time into the AP which would bias the results.
Table 12 also shows the analysis by splitting the sample into males and females to
determine whether the AP has differential impacts by gender as found by Angrist et al. (2009).
Overall, we find that the AP has differing effects on males and females depending on the
outcome under consideration. In regards first year exam outcomes, the program primarily has an
impact on female students in regards exam performance and both male and female Discount
students in regards progression to second year. While the program has a positive effects on the
probability of graduation both for females and males, it has a negative effect for males in regards
final degree classification. However, the sample sizes at this point are perhaps too small to draw
solid conclusions of a weaker/stronger result for one particular gender. These results are contrary
to Angrist et al. (2009) which conclude that the STAR program, which is similar to the AP
considered in this study, only has effects for females.
A number of additional alternative specifications were considered. We did not find the
treatment effect to vary by the faculty of the student. Furthermore, we investigated the existence
of peer effects in relation to the program; however we could not identify an effect based on
having a high proportion of fellow AP students in a particular course or students from a similar
social background. For all of these alternative specifications, sample size may inhibit the
detection of an effect.
E. Impact of Variations in Financial Aid Package
Unlike Angrist et al. (2009), our natural experiment does not allow us to identify the relative
effects of the individual financial, academic and social supports. However variation in the levels
of financial aid over time allows us to identify the effects of changes in aid on student outcomes.
The amount of financial aid made available to each student changed during the period covered
by the data due to funding availability. Furthermore the value of the regular state means tested
grant, which the majority of AP students additionally receive, also changed over time. The sum
of the total value of the AP’s aid package was particularly high in 2000, 2001 and 2003 with an
average of €6313 (expressed in 2008 prices) per annum. While the average in 1999, 2002 and
2004 was relatively lower at€5407 per annum. Therefore there were substantial variations in aid
across time.
To determine the impact of changes in financial aid on first year exam results, an ordered
probit was estimated using the access program students only. The marginal effects on exam
performance of having entered university in a “higher value” year relative to entering in a “lower
value” year are shown in Table 13. Although the estimated results follow a pattern suggesting
that the extra funding was beneficial, the first year outcomes for students who received the high
value package were not statistically different from the students who received the lower value
models were estimated.21Clearly this does not suggest that AP’s financial package has no effect
on student performance, however it does imply that increasing the value of the package from an
average of€5407 to €6313 per annum (a difference of€906) did not lead to changes in student
achievements. The analysis rests on the assumption that there were no other differences in the
AP’s activities in these high value years that may influence outcomes. It also assumes that the
unobserved characteristics of students in the high value years did not differ from students in low
value years.
F. Expansion of the AP
The AP is currently operating on a relatively small scale, representing less than 5% of all
university entrants. The effectiveness of the program, as demonstrated in this study, calls into
question the possibility of expanding the program to include more students. Currently the
program does not accommodate low income students who attend high schools which are not
classified as disadvantaged, and hence are not linked to the program. Table 14 shows the
treatment effects of the program when comparing both Treatment groups to an alternative
Control group of low income students attending non disadvantaged schools. The results show
that the Treatment students typically outperform this new Control group in regards improved
first year exam performance and progression rates to second year. Thus as these results are
largely positive it suggests that expanding the program to non disadvantaged schools may be
beneficial.
V.
Conclusion
The study examines the effectiveness of a multidimensional access program (AP) operating at a
large Irish university. While there is some evidence that such programs can be effective (e.g.
Angrist et al. 2009; Brock and Richburg Hayes 2006), there is a dearth of research in this area,
particular in a non-North American setting. Overall the results indicate that participation in the
Irish AP has well determined and significant positive benefits for low SES students.
The results illustrate that program has a positive effect on progressing to second year for
both low and high ability Discount students. Withdrawal from a degree may have long lasting
self-esteem and stigmatizing effects particularly if the student has miscalculated their relative
ability to finish the program. The program also improves the exam performance of both Discount
and Merit treated students, in that it increases the probability of achieving an honours and
reducing the probability of either passing or failing. Yet these results are primarily driven by
female students and higher ability students. AP students who attained more than 400 points in
their university entrance exam are more likely to achieve a second class honours grade and less
likely to receive a third class honours or fail their first year exams. The AP appears to shift the
entire distribution of grades upwards for the high point program participants.
The positive effects of the AP on the students’ final year outcomes suggest that the
program has a persistent effect throughout university. The program increases the graduation rate
for both Discount and Merit students by between 10 and 15%. These effects are very large and
represent the cumulative effect of the program in reducing drop-out at each stage of university
life. However, while the program helps the students to make it to graduation, it has no impact on
In general, the results show differential effects for high and low ability, with students
achieving over 400 points in their university entrance exam having improved performance in the
first year exams. This result was not expectedex anteas it was hypothesized that the supports of
the AP would act as a substitute for the low ability students, in that the additional classes and
financial aid would compensate for their low ability. Yet the contrary results suggest that the
high ability students may be better able to take full advantage of the services offered by the AP,
such as the free additional tutorials, and as such the AP acts as a complement for these students,
rather than a substitute.
Given that we find the program has a positive impact overall on the students that
received preferential entry treatment (i.e. those that were allowed enter with a lower score in the
university entry exam), affirmative action or positive discrimination does not appear to
compromise academic standards. Although the program utilizes a quota for lower
socio-economic students, it maintains academic standards through its screening process which uses
more information on prior academic performance than the standard screening procedure for the
general population. This suggests that relying on university entrance exam grades lone may not
be an accurate marker for university success. However there are administrative and cost burdens
to both the university and the applicants with such a process that may prohibit its extension to the
general population. Note that the positive discrimination made by the AP occurs on a relatively
small scale both in terms of the absolute number of students admitted and the level of grade
remission that an individual student receives. While eligibility for US affirmative action
programs typically depend on ethnicity, this study shows the effectiveness of a program based
The study also finds that a high level of financial aid may not be the main contributor of
university success as variation in aid over time does not adversely impact on student
performance. However there are limits as to how much one can extrapolate from this result.
Firstly it should be noted that the sample size used for this analysis is quite low as only AP
students can be included; therefore the estimated results may not be precise. Secondly, based on
the data available, it is not possible to speculate with any degree of confidence if an increase by
more than around€900 would have had any effect. Nor is it possible to estimate if a reduction in
the value of the financial package below an amount of around €5400 would have any effect on
average student performances. However in reducing the amount of financial aid to students,
consideration should be given to the possible effects of such a reduction on student employment
as students may enter part-time employment to offset a reduction in financial aid (although there
is currently no consensus in the literature on the effects of student employment on academic
outcomes).
The program is currently operating on quite a small scale, therefore given its positive
effects, one may speculate on whether it should be expanded to different populations. One of the
criteria for participation in the program is parental education: students must be the first
generation of their family to attend university education. Given the overall positive effects of the
program, this initiative has the potential to reduce the comparatively high inter-generational
correlation in education found in Ireland. Our additional analysis suggests that the current AP
students perform better than other disadvantaged students who meet in the income, education and
social class eligibility criteria but do not participate in the access program as their school is not
compensate for not entering the AP. It therefore follows that allowing such students to
References
Angrist, Joshua, Daniel Lang, and Philip Oreopoulos. 2009. “Incentives and Services for College
Achievement: Evidence from a Randomized Trial.” American Economic Journal: Applied
Economics,1(1): 136-163.
Bratti, Massimiliano, Robin Naylor, and Jeremy Smith. 2007. “Heterogeneities in the Returns to
Degrees: Evidence from the British Cohort Study 1970.” Warwick Economics Research Paper
no. 783.
Brock, Thomas, and Lashawn Richburg-Hayes. 2006. “Paying for Persistence: Early Results of a
Louisiana Scholarship Program for Low-Income Parents Attending Community College.”
Manpower Development Research Corporation, New York, NY.
Carneiro, Pedro, and James J. Heckman. 2003. “Human capital policy”. In Inequality in
America: What Role for Human Capital Policies? Eds. J. J. Heckman, A. B. Krueger, and B. M.
Friedman. Cambridge, MA: MIT Press.
Chevalier, Arnaud, Kevin Denny, and Dorren McMahon. 2009. “Intergenerational Mobility and
Education Equality”. In Education and Inequality across Europe. Eds P. Dolton, R. Asplund,
Cornwell Christopher, David B Mustard, and Deepa J Sridhar. 2006. “The Enrollment Effects of
Merit-Based Financial Aid: Evidence from Georgia’s HOPE Program.” Journal of Labor
Economics, 24(4): 761-786.
Cunha, Flavio, and James J. Heckman. 2007. “The Technology of Skill Formation.” American
Economic Review, 97(2): 31-47.
Dearden, Lorraine, Leslie McGranahan, and Barbara Sianesi. 2004. “The Role of Credit
Constraints in Educational Choices: Evidence from NCDS and BCS70.” CEEDP, 48. Centre for
the Economics of Education, London School of Economics and Political Science, London, UK.
Deming, David, and Susan Dynarski. 2009. “Into College, Out of Poverty? Policies to Increase
the Postsecondary Attainment of the Poor”. NBER Working Paper 15387.
Department of Education and Science. 1993. Report of the Advisory Committee on Third-Level
Student Support(Committee chaired by Dr. Donal de Buitléir), Dublin: Stationery Office.
Deshpande, Ashwini. 2006. “Affirmative action in Indian and the United States”. World
Development Report 2006 Background Paper.
Digest of Education Statistics. 2007. US Department of Education, National Center for
Dynarski, Susan. 2000. “Hope for Whom? Financial Aid for the Middle Class and its Impact on
College Attendance”National Tax Journal, 53(3): 629-661.
Dynarski, Susan. 2003. “Does Aid Matter? Measuring the Effect of Student Aid on College
Attendance and Completion.”American Economic Review, 93(1): 279-288.
Eurostudent Report. 2005.Social and Economic Conditions of Student Lie in Europe, 2005.
Fryer, Roland G., and Glenn C. Loury. 2005. “Affirmative Action and its Mythology”. Journal
of Economic Perspectives, 19(3): 147-162.
Gormely, Isobel Claire, and Thomas Brendan Murphy. 2006. “Analysis of Irish Third Level
College Application Data”,Journal of the Royal Statistical Society Series A, 169(2): 361-379.
Heckman, James J., Seong Hyeok Moon, Rodrigo Pinto, Peter A. Savelyev, and Adam Yavitz.
2009b. “The Rate of Return to the High/Scope Perry Preschool Programme”. NBER working
paper no. 15471.
Jones, Ethel B. and John D. Jackson. 1990. “College Grades and Labor Market
Rewards”,Journal of Human Resources,25(2): 253-266.
Kane, Thomas J. 2003. “A Quasi-Experimental Estimate of the Impact of Financial Aid on
Lavy, Victor, and Analia Schlosser. 2005. “Targeted Remedial Education for Underperforming
Teenagers: Costs and Benefits.”Journal of Labor Economics, 23(4): 839-874.
Lesik, Sally A. 2007. “Do Developmental Mathematics Programs have a Causal Impact on
Student retention? An Application of Discrete-Time Survival and Regression Discontinuity
Analysis.”Research in Higher Education,48 (5): 583-608.
Schweri, Juerg. 2004. “Does it Pay to be a Good Student? Results from the Swiss Graduate
Labour Market”, University of Bern Discussion Paper 0405.
Scott-Clayton, Judith. 2009. “On Money and Motivation: A Quasi-Experimental Analysis of
Financial Incentives for College Achievement.” Working Paper Harvard University.
Smith, Jeremy, and Robin Naylor. 2001. “Dropping Out of University: A Statistical Analysis of
the Probability of Withdrawal for UK University Students”, Journal of the Royal Statistical
Society(series A), 164: 389-405.
Scrivener, Susan, Dan Bloom, Allen LeBlanc, Christina Paxson, Cecilia Elena Rouse, and
Colleen Sommo. 2008. “A Good Start: Two-year Effects of a Freshman Learning Community
Program at Kingsborough Community College.” Manpower Development Research Corporation,
Trostel Philip, Ian Walker, and Paul Woolley. 2002. “Estimates of the Economic Return to
Descriptive Statistics
Table 1Labour Market Characteristics in AP School Localities by Year of Linkage Year of linkage to AP Number of schools
entering program
Proportion in locality unemployed in 1996
Proportion in locality leaving education before age 18 in
1996
1999 or before 21
0.11 (0.03) 0.90 (0.06) 2000 6 0.06 (0.02) 0.87 (0.08)
2001 125 (0.04)0.09
0.86 (0.09) 2002 30 0.09 (0.03) 0.88 (0.06)
2003 68 (0.03)0.08
0.87
(0.05)
2004 or later 60 (0.03)0.09
0.89
(0.06)
[image:39.595.71.350.438.626.2]Note:Mean, standard deviation (in parentheses) and sample size reported. The figures represent the average labour market conditions, as reported in the 1996 Census, in the locality of the schools which joined the AP between 1999 and 2005. The number of observations (at school level) are weighted by number of students from school in final sample. No school has left the access program having been chosen to join it.
Table 2Average University Entrance Exam Grades for Control and Treatment Group by Year of Linkage
Year of linkage Control Treatment
1999 438 429
(54) (69)
2000 446 398
(64) (70)
2001 433 388
(50) (44)
2002 425 416
(55) (74)
2003 436 400
(64) (65)
2004 424 399
(61) (65)
Average 434 404
(58) (66)
Figure 1University Faculty by Control and Treatment Group Before and After the 2001 Reform
Table 3University Entrance Exam Grades
Points categories General Student Population
Control group Students
Discount AP students
Merit AP students
% % % %
300-350 3.12 3.12 37.28 9.4
355-400 21.38 31.43 34.32 33.56
405-450 27.75 34.81 8.28 23.49
455-500 23.06 16.62 15.98 20.13
505-550 15.65 8.57 4.14 9.4
555-600 9.05 5.45 0 4.03
Sample size 16,337 385 173 149
Table 4Outcome Variables
Outcome Variables General Student Population
Control group Students
Discount AP students
Merit AP students
First Year Outcomes: % % % %
First Class in Summer Exams 8.89 2.99 2.98 10.34
Upper Second Class in Summer Exams 16.31 13.04 10.12 13.1
Lower Second Class in Summer Exams 21.68 23.1 14.29 28.28
Third Class in Summer Exams 23.77 31.52 22.62 21.38
Fail in Summer Exams 29.35 29.35 50 26.9
Passed Autumn Exams 69.32 69.23 68.75 57.58
Progressed to Second Year 88.35 88.01 82.74 86.21
Sample size 16,337 385 173 149
Final Degree:
Graduated 77.5 79.53 77.42 88.89
Graduating on time 89.48 88.65 92.86 92.21
First Class Honours Degree 13.78 8.51 4.29 20.51
Upper Second Class Honours Degree 29.07 25.96 18.57 29.49
Lower Second Class Honours Degree 38.1 45.11 45.71 30.77
Third Class Honours Degree 19.05 20 31.43 19.23
Sample size 11,921 298 93 90
[image:41.595.71.491.484.616.2]Note:The Control group includes grant holders, went to link schools before they became linked, year of link available, parents not managers, professionals or farmers.
Table 5Year Student Entered University
Year General Student Population
Control group Students
Discount AP students
Merit AP students
% % % %
1999 16.56 18.96 6.36 10.07
2000 16.81 15.84 10.98 8.05
2001 16.55 21.3 9.83 9.4
2002 17.02 16.62 15.03 24.16
2003 16.01 12.47 22.54 20.13
2004 17.05 14.81 35.26 28.19
Sample size 16,337 385 173 149
Table 6Socio-demographic Characteristics
Socio-demographic characteristics General Student Population
Control group Students
Discount AP students
Merit AP students
% % % %
Male 45.98 34.55 36.42 40.27
In receipt of means tested State grant 16.94 100 100 100
Socio-economic group of father:
Farmers 10.77 0.0 0.0 0.0
Agricultural Workers 1.03 1.56 1.15 1.41
Higher Professionals 32.34 0.0 0.0 0.0
Lower Professionals 8.38 0.0 0.0 0.0
Managers and Employers 21.93 0.0 0.0 0.0
Salaried Employees 16.24 32.21 25.29 19.72
Intermediate Workers 1.74 5.97 12.64 8.45
Other non-manual 1.17 7.01 10.34 15.49
Skilled manual 4.98 34.03 24.14 16.9
Semi-skilled manual 0.9 12.21 12.64 16.9
Non-skilled manual 0.52 7.01 13.79 21.13
Sample size 16,337 385 173 149
[image:42.595.69.492.472.670.2]Note:The Control group includes grant holders, went to link schools before they became linked, year of link available, parents not managers, professionals or farmers.
Table 7University Faculty
University Faculty General Student Population
Control group Students
Discount AP students
Merit AP students
% % % %
Agriculture 5.29 3.38 0.58 4.7
Arts 40.72 50.65 34.1 43.62
Commerce 12.74 6.75 20.81 8.05
Engineering and Architecture 9.46 6.23 6.36 6.04
Interfaculty 4.41 2.86 5.2 1.34
Law 2.99 1.3 2.89 2.01
Medicine 5.85 4.42 13.87 2.01
Science 12.95 17.14 6.36 27.52
Veterinary Medicine 1.81 2.08 1.16 1.34
Human Sciences 3.78 5.19 8.67 3.36
Sample size 16,337 385 173 149