Searching for Interpretable Demographic
Patterns
Muratova, Anna and Islam, Robiul and Mitrofanova,
Ekaterina S. and Ignatov, Dmitry I.
National Research University Higher School of Economics, Moscow,
Russia
23 September 2019
Online at
https://mpra.ub.uni-muenchen.de/97305/
Anna Muratova, Robiul Islam, Ekaterina Mitrofanova, Dmitry I. Ignatov
1 National Research University Higher School of Economics, Moscow, Russia
[email protected], [email protected],
[email protected], [email protected]
Abstract. Nowadays there is a large amount of demographic data which should be analyzed and interpreted. From accumulated demographic data, more useful information can be extracted by applying modern methods of data mining. Two kinds of experiments are considered in this work: 1) generation of additional secondary features from events and evaluation of its influence on accuracy; 2) exploration of features influence on classification result using SHAP (SHapley Additive exPlanations). An algorithm for creating secondary features is proposed and applied to the dataset. The classifications were made by two methods, SVM and neural networks, and the results were evaluated. The impact of events and features on the classification results was evaluated using SHAP; it was demonstrated how to tune model for improving accuracy based on the obtained values. Applying convolutional neural network for sequences of events allowed improve classification accuracy and surpass the previous best result on the studied demographic dataset.
Keywords: data mining, demographics, neural networks, classification, SHAP, interpretation.
1. Introduction
The study of demographic sequences using data mining methods allows extract more information, identify and interpret interesting dependencies in the data for their classification, predict likely events and so on.
In the previous paper [1], data analysis methods were already applied
and interesting results were obtained. The main task of the paper was
Copyright © 2019 for this paper by its authors. Use permitted under
*
to find the most accurate classification method for analysing demographic data of sequential nature. The comparison of the so-called black-box methods such as customised SVM kernels using various similarity measures and neural networks was made. Since demographers are interested in sequences without discontinuity, formulas for such sequences similarity measures were derived and then they were used as kernels in the SVM method. Recurrent neural network algorithms, such as SimpleRNN, GRU and LSTM, were also compared. The best classification results were obtained using the custom kernel function in SVM by transforming sequences into features with accuracy 0.716 and even better result with recurrent neural network SimpleRNN (Keras/Tensorflow) with accuracy 0.754. In this paper, we developed programs, which extract additional dependencies in the data and allow us to interpret what was not visible before in the black-box methods. The same dataset as in the previous paper was used, but with additional data preprocessing.
For the interpretation and determination of the influence of features on the classification result, the method SHAP (SHapley Additive exPlanations) [2, 3], implemented in the library [4] was used. It allows to explain the output of any machine learning model. SHAP connects game theory with local explanations.
As a result, it was possible to identify the contribution of each feature to the classification (Program 1 based on SVM and SHAP) and the contribution of each individual sequence event (Program 2, recurrent neural network (RNN) based on Keras/Tensorflow and SHAP).
layers for features was created and applied for classification. Section 4 concludes the paper.
2. Binary coded events and event pairs as additional features for classification by SVM: Impact on Accuracy
The studied dataset has been created on the basis of the Russian part of Generations and Gender Survey and contains of 6,626 respondents, including 3,314 men and 3,312 women. In the dataset, the dates of significant events in the respondents’ live-courses are indicated, such as first partnership, first marriage, break up of the first partnership, first divorce, completing of education, first paid work, separation from parents (leaving parental home) and birth of the first child. Also, there are features of respondents: type of education (general, higher, professional), location (city, town, country), religion, the degree of activity in religious events (if any), generation (Soviet, 1930-1969; modern, 1970-1986) and gender.
In [1] it was shown that the addition of sequences as features improves classification accuracy. As an attempt to extract additional dependencies, binary coded events and ordered event pairs were added to the data set as extra features (secondary features).
Two groups of secondary features were made. The first group consists of binary coded events with the code “1” if a considered event happened in person’s life and “0” if the event has not happened yet. The second group consists of event pairs coding to mark type of mutual dependency. For each pair of events, a chronological sequence was determined; if the first event occurred before the second or the second did not happen yet, then the pair of events was encoded with the symbol “<”, if vice versa, then “>”, if the events are simultaneous, then “=” and if none of the events has happened yet, then “n”.
pairs.
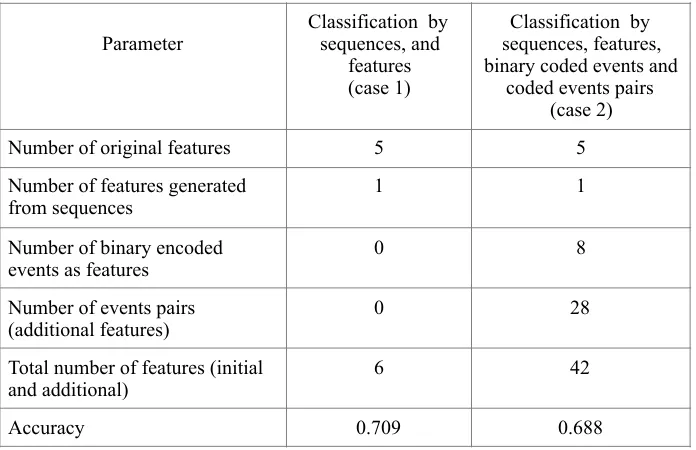
Two variants of classification by the feature “gender” were made with the use of SVM method. The variants differ in the set of secondary features. The first variant of classification is formed by sequences and features [1] and the second one is formed by sequences, features, binary coded events, and coded event pairs. The comparison of classification accuracy for these two variants is shown in Table 1.
Table 1. Classification by the feature “gender” using SVM method for two variants of secondary features
From Table 1 we can see that increased number of secondary features does not improve accuracy.
3. Exploration of contribution of features to the result of classification using method SHAP
3.1. Most influencing features with method SHAP
The SHAP (SHapley Additive exPlanations) allows exploration of the influence of features on the classification result. The SHAP method
Parameter
Classification by sequences, and
features (case 1)
Classification by sequences, features, binary coded events and
coded events pairs (case 2)
Number of original features 5 5
Number of features generated from sequences
1 1
Number of binary encoded events as features
0 8
Number of events pairs (additional features)
0 28
Total number of features (initial and additional)
6 42
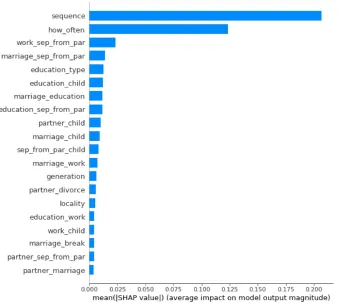
[image:5.595.125.473.298.523.2]allowed us to find out which features have bigger influence on the result and which influence can be neglected. SHAP library [2] includes several methods. KernelExplainer module was used, it allows explain any function visualizing by JavaScript code in Jupyter Notebook. The result of SHAP application for the whole table with the secondary features and the use of SVM method is shown in Fig. 1.
Fig. 1. Average impact of the features on the model output magnitude (the most influencing features shown)
3.2. Tuning the number of features based on its impact on the model output calculated by SHAP
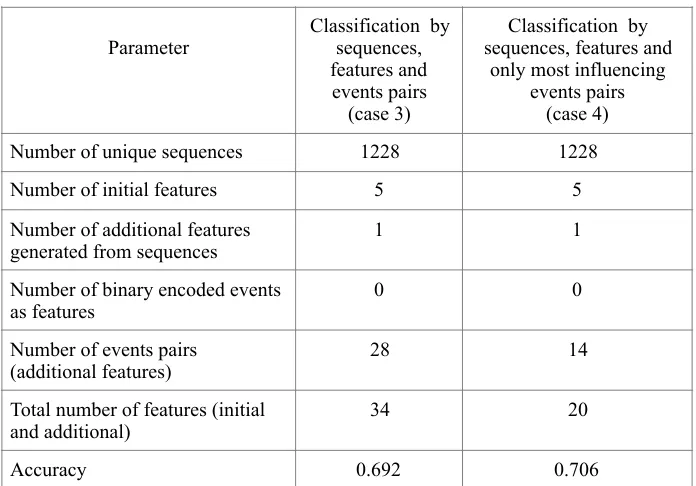
We split it into two cases: 1) the binary coded events are removed: partner, marriage, break, divorce, education, work, separation from parents; 2) all other features not included in the list of most influencing features are removed. The results for these two cases are shown in Table 2.
Table 2. Comparison of two classification cases: by sequences, features, and event pairs and classification by sequences, features, and only most influencing event pairs
Table shows increasing Accuracy from case 2 to case 3 and case 4. Accuracy in case 4 is near the same as Accuracy in case 1 (in Table 1). So, we obtained that secondary features do not provide better accuracy. SHAP diagram (Fig. 1) confirms that sequence of events is the most influencing feature.
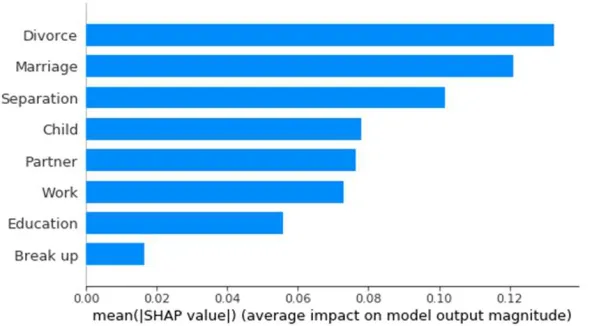
3.3. Exploration of events impact inside sequences: SHAP application to neural networks
SHAP allows exploration of the impact of events on the neural network model output. The results are shown in Fig. 2. SimpleRNN neural
Parameter
Classification by sequences, features and events pairs
(case 3)
Classification by sequences, features and
only most influencing events pairs
(case 4)
Number of unique sequences 1228 1228
Number of initial features 5 5
Number of additional features generated from sequences
1 1
Number of binary encoded events as features
0 0
Number of events pairs (additional features)
28 14
Total number of features (initial and additional)
34 20
network was applied for sequences of events.
Fig. 2.Events impact on the model output. The chosen classification method is recurrent neural network (SimpleRNN) applied for sequences of events
From Fig. 2 we can see that the highest impact on the model output is shown by divorce and marriage events.
3.4. Additional SHAP results
Lundberg et al. [19] have developed a high-speed feature-attribution algorithm for computation of Shapley values of individual features in tree ensemble methods, while Shapley values can potentially explain the output of any machine learning model. In this demographic case, we rely on binary classification problem by gender attribute, thus the value “0” represents female and male is represented by “1”. Since our dataset is balanced, the base predicted value is about 0.5, and if the value is less than 0.5, this example represents female, and male otherwise. For making prediction for a particular person in our dataset, we apply XGBoost [20] and find the output probability to be equal to 0 . 5 5 , r e s u l t i n g m a l e c l a s s .
Fig. 4. Contributions of Shapley values for gender classification problem to the model output for XGBoost
points show the cardinality of cases for a given feature with similar Shapley values.
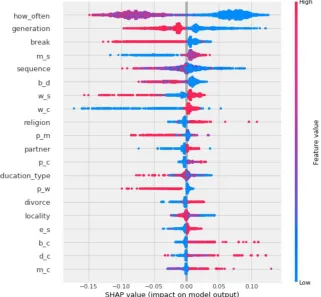
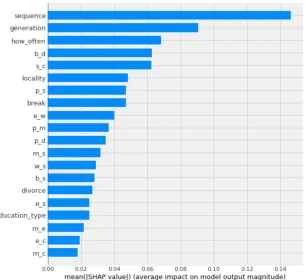
[image:10.595.139.445.282.562.2]In next step we have applied XGBClassifier [21] for gender with binary logistic loss and obtained 74.04% accuracy and 74.01% F1 score. We have also applied 5-fold cross validation for the same classifier type and obtained 80.45% accuracy and 74.9% F1 score. For this classifier we have found «sequence» to be the most influencing feature for prediction shown on the top of plot in Fig. 5.
Fig. 5. Contributions of Shapley values for gender classification problem to the model output for XGBClassifier
Table 3. Classification statistics
How to interpret Shapley values of contributing features for a particular example was discussed earlier (see Fig. 3). However, one can pick a false positive case and try to figure it out why the considered respondent (actually female) is predicted as male by the model.
Fig. 6. Contributions of Shapley values for gender classification problem to the model output for XGBClassifier
Let us consider a false positive case in Fig. 6 with high probability
p(class=male|x)=0.93. Here, two the most influencing features with positive Shapley values are the completion of the highest degree of education (at the moment) before the first child birth (e_c=1) and marriage before the first child birth (m_c=1), while the most negative contributing feature is marriage not before the highest degree of education (m_e=0). Thus a demographer is able to analyse reasons of a particular misclassification case by revealing of non-typical feature combinations (pairs of events).
Interpretation Total Number
True Positives men correctly predicted 761
True Negatives women correctly
predicted 717
False Positives men incorrectly predicted
as women 304
False Negatives women incorrecly
[image:11.595.132.448.407.454.2]3.5. Neural network with embedding and convolutional layers for sequences of events and dense layers for features
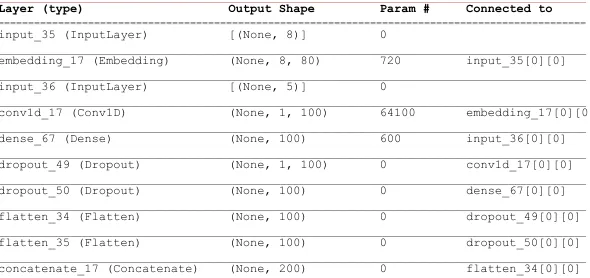
[image:12.595.124.472.362.494.2]A complex two-channel neural network, consisting of embedding and convolutional layers for sequences of events and dense layers for features, has been created. The layers for sequences (the first channel) and for features (the second channel) are merged and then dense and dropout layers are added. This network have shown the best classification accuracy 0.78 and surpassed the previous best result in [1]. We provide an interested reader with the general network structure in Table 4 and its Tensor Flow realisation with concrete values of parameters in Table 5.
Table 4.The general structure of two-channel neural network for events and features
Table 5. The structure of neural network model printed by Tensorflow
__________________________________________________________________________________________________
Layer (type) Output Shape Param # Connected to
==================================================================================================
input_35 (InputLayer) [(None, 8)] 0 __________________________________________________________________________________________________
embedding_17 (Embedding) (None, 8, 80) 720 input_35[0][0] __________________________________________________________________________________________________
input_36 (InputLayer) [(None, 5)] 0 __________________________________________________________________________________________________
conv1d_17 (Conv1D) (None, 1, 100) 64100 embedding_17[0][0] __________________________________________________________________________________________________
dense_67 (Dense) (None, 100) 600 input_36[0][0] __________________________________________________________________________________________________
dropout_49 (Dropout) (None, 1, 100) 0 conv1d_17[0][0] __________________________________________________________________________________________________
dropout_50 (Dropout) (None, 100) 0 dense_67[0][0] __________________________________________________________________________________________________
flatten_34 (Flatten) (None, 100) 0 dropout_49[0][0] __________________________________________________________________________________________________
flatten_35 (Flatten) (None, 100) 0 dropout_50[0][0] __________________________________________________________________________________________________
concatenate_17 (Concatenate) (None, 200) 0 flatten_34[0][0]
Parameter Sequences channel Features channel
Input size 8 5
Output size 100 100
Merged layer size 200
Intermediate layers sizes 200, 32
Model output size (binary)
[image:12.595.126.421.555.694.2]flatten_35[0][0] __________________________________________________________________________________________________
dense_68 (Dense) (None, 200) 40200 concatenate_17[0][0] __________________________________________________________________________________________________
dropout_51 (Dropout) (None, 200) 0 dense_68[0][0] __________________________________________________________________________________________________
dense_69 (Dense) (None, 32) 6432 dropout_51[0][0] __________________________________________________________________________________________________
dense_70 (Dense) (None, 1) 33 dense_69[0][0] ==================================================================================================
Total params: 112,085 Trainable params: 112,085 Non-trainable params: 0
__________________________________________________________________________________________________
4. Conclusion
Two kinds of experiments are considered in this work: 1) generation of additional secondary features from events and evaluation of its influence on accuracy; 2) exploration of features influence on classification result using SHAP (SHapley Additive exPlanations). The first experiment shows that for existing demographic dataset generation and addition of the secondary features does not improve accuracy compared with algorithms described in [1]. Those algorithms thoroughly extract data dependencies, so the additional secondary features cannot find any new uncovered dependencies. The extra features add some overhead and noise that lead to reduced accuracy. The second experiment allows us to explore features impact on the classification results. SHAP library provides useful visual tools to evaluate features influence for different models: scikit-learn SVM and Keras/Tensorflow recurrent neural networks (SimpleRNN). Also we demonstrated how features impact evaluation allows models tuning to improve classification accuracy. The best classification accuracy was achieved by XGBClassifier classifier within 5-fold cross validation scheme. The new result for accuracy surpasses the previous best result in [1]. Shapley values may be a tool of choice for demographers to analyse misclassified cases in terms of interpretable attribute-value combinations.
Acknowledgments. The study was implemented in the framework of the Basic Research Program at the National Research University
author was also supported by Russian Science Foundation (Section 1, 3.4, and 4) under grant 17-11-01294.
References
1. Muratova, A., Sushko, P., Espy, T.: Black-Box Classification Techniques for Demographic Sequences: from Customised SVM to RNN. In: Proceedings of the Fourth Workshop on Experimental Economics and Machine Learning, EEML 2017, vol. 1968, pp. 31-40. Aachen : CEUR Workshop Proceedings, Dresden (2017).
2. Scott M. Lundberg, Su-In Lee. A Unified Approach to Interpreting Model Predictions. NIPS 2017 http://papers.nips.cc/paper/7062-a-unified-approach-to-interpreting-model-predictions.pdf
3. Scott M. Lundberg. A unified approach to explain the output of any machine learning model. https://github.com/slundberg/shap
4. Christoph Molnar, Interpretable Machine Learning. A Guide for Making Black Box Models Explainable. 2019 https://christophm.github.io/interpretable-ml-book/shapley.html 5. E l z i n g a , C . H . , R a h m a n n , S . , Wa n g , H . : A l g o r i t h m s f o r s u b s e q u e n c e
combinatorics. Theoretical Computer Science 409(3), 394-404 (2008).
6. Egho, E., Raïssi, C., Calders, T., Jay, N., Napoli, A.: On measuring similarity for sequences of itemsets. Data Mining Knowledge Discovery 29(3), 732-764 (2015).
7. Lodhi, H., Saunders, C., Shawe-Taylor, J., Cristianini, N., Watkins, C.:Text Classification using String Kernels. Journal of Machine Learning Research 2, 419-444 (2002).
8. Understanding LSTM Networks, http://colah.github.io/posts/2015-08-Understanding-LSTMs/, last accessed 2017/02/15.
9. Scikit-learn: Scientific library for Machine Learning in Python, http://scikit-learn.org/, last accessed 2017/01/28.
10.Keras: Deep Learning library for Theano and TensorFlow, https://keras.io/, last accessed 2017/02/17.
11.The Unreasonable Effectiveness of Recurrent Neural Networks, http://karpathy.github.io/ 2015/05/21/rnn-effectiveness/, last accessed 2016/12/20.
12.Ignatov, D.I., Mitrofanova, E.S., Muratova A.A., Gizdatullin D.K.: Pattern Mining and Machine Learning for Demographic Sequences. In: Knowledge Engineering and Semantic Web: 6th International Conference, KESW 2015, vol. 518, pp. 225-243. Springer, Switzerland (2015).
13.Buzmakov, A., Egho, E., Nicolas, J., Kuznetsov, S.O., Napoli, A., Raïssi, Ch.: On mining complex sequential data by means of FCA and pattern structures. Int. J. General Systems 45(2), 135-159 (2016)
14.Ganter, B., Kuznetsov, S.O.: Pattern structures and their projections. In: Delugach, H.S., Stumme, G. (eds.) ICCS 2001. LNCS (LNAI), vol. 2120, pp. 129–142. Springer, Heidelberg (2001)
15.Ganter, B., Wille, R.: Formal Concept Analysis. Springer, Berlin (1999)
16.Gizdatullin, D., Baixeries, J., Ignatov, D., Mitrofanova, E., Muratova, A., Thomas H. Espy: Learning Patterns from Demographic Sequences. In.: Intelligent Data Processing, IDP 2016, Springer (to appear)
18.Aggarwal, Ch. C., Han, J.: Frequent Pattern Mining. Springer (2014)
19.Scott M Lundberg, Gabriel G Erion, and Su In Lee. Consistent individualized feature attribution for tree ensembles. arXiv preprint arXiv:1802.03888, 2018
20.Chen, Tianqi, and Carlos Guestrin. "Xgboost: A scalable tree boosting system." Proceedings of the 22nd acm SIGKDD international conference on knowledge discovery and data mining. ACM, 2016.
21.Srivastava, A., Kundu, A., Sural, S., & Majumdar, A. (2008). Credit card fraud detection using hidden Markov model. IEEE Transactions on dependable and secure computing, 5(1), 37-48.