Quantifying the Effect of Pill-taking on Quality of Life
By
Robert Hutchins
A Master’s Paper submitted to the faculty of the University of North Carolina at Chapel Hill in partial fulfillment of the requirements
for the degree of Master of Public Health in the Public Health Leadership Program
Chapel Hill
2013
_______________________________
_______________________________
Date
_______________________________
_______________________________
Date
Table of Contents
Master’s Paper Abstract………...……….2-3
Systematic Review
Abstract………4
Introduction………..5-6
Methods…….………...6
Results………...7-8
Discussion..………...8-10
References..………...11-13
Figures…….………...14
Tables…….………...15-16
Manuscript
Abstract…...……….………17-18
Introduction...………...19-20
Methods…….………...20-23
Results………...24-25
Discussion..………...26-29
References..………...30-32
Figures…….………...33
Tables…….………...34-40
ABSTRACT
Utility measures are used in cost-effectiveness studies to represent the effect a given
outcome or intervention has on quality of life. Pills are common interventions used to try
to reduce the risk of an adverse health outcome. The utility value for taking pills is often
estimated or assumed to be 1.0, suggesting no effect on quality of life, but I wondered
whether any studies had been published that quantified this utility value. This master’s
paper has two goals. In the systematic review portion, I searched for published articles
that quantified the utility of taking pills for preventive purposes. In the original research
portion, I report the results of a study that quantified the utility value of taking pills to
prevent an adverse health outcome.
For the review, I systematically searched PUBMED using strategically selected
keywords. This strategy was supplemented with a search of the Cochrane database, a
hand search of bibliographies, and questioning of experts. Studies that calculated a utility
value were included. I expanded the inclusion criteria to any article that cited a utility
value for pill-taking for preventive purposes in adults. In the original research, we invited
healthcare system employees to participate in an online survey about taking pills. We
calculated mean utility values for taking pills and compared utility values across several
demographic characteristics and by numeracy level.
I found two published articles that quantified the utility value of taking aspirin
and warfarin. I found a total of nineteen additional published articles that cite a utility
value for taking pills for preventive purposes. All these values ranged from 0.95 – 1.0,
depending on the type of pills. Through our original research project involving 708
value did not vary significantly by age, sex, race, education level, income level, or
number of pills taken per day. Those with low numeracy level tended to have slightly
What is the Effect of Pill-taking on Quality of Life: A Systematic Review of the Utility Value for Taking Pills
ABSTRACT
BACKGROUND: Utility measures are used in cost-effectiveness studies to represent the
effect a given outcome or intervention has on quality of life. Pills are common
interventions used to try to reduce the risk of an adverse health outcome. The utility
value for taking pills is often estimated or assumed to be 1.0, indicating no effect on
quality of life, but I was not aware of any studies that specifically aimed to quantify this
utility value.
OBJECTIVE: To systematically search for and identify published articles that attempt to
quantify the utility of taking pills for preventive purposes.
METHODS: I systematically searched PUBMED using strategically selected keywords.
This strategy was supplemented with a search of the Cochrane database, a hand search of
bibliographies, and questioning of experts. Studies that cited a utility value were also
included.
RESULTS: I found two studies in which investigators interviewed 74 patients and 83
patients and determined the utility values for taking daily aspirin to be 0.998 in both
studies and daily warfarin (plus its monitoring) to be 0.987 in one study and 0.988 in the
other. I found nineteen additional studies that cited a specific utility value that varied
from 0.95 to 1.0, depending on the type of pill and whether or not side effects and/or drug
monitoring were included in the utility value.
CONCLUSIONS: I found two studies that quantified a utility value for pill-taking,
INTRODUCTION:
Most adults will end up taking daily pills at some point in their lives. Many
adults take multiple pills, often more than once per day. When people take pills they
must go through a process that involves, but is not limited to, obtaining the pills, paying
for them, ingesting the pills, dealing with any side effects which the pills may cause, and
remembering to take the pills. If the pills require a prescription, the process also includes
visits to clinicians and pharmacists. These processes, part of the routine of “taking pills,”
can theoretically affect quality of life.
When people take pills on a daily basis, they do so either to try to prevent an
undesired health outcome or to treat a specific condition and/or its symptoms. In both
cases, there may be some diminution in quality of life. Side effects of pills aside, the
effects of pill-taking on quality of life are likely to vary not only based on the reason
people take pills but also on other factors such as number of pills taken per day, number
taken at one time, and even the size of the pills. In health studies, effects on quality of
life are often measured by assigning a numerical value that represents the relative quality
of life effect that a certain health state carries versus a standard state. This numerical
value is termed a “utility.” Utilities range from 0 to 1, with 0 representing death and 1
representing perfect health.
There are many studies that address patient adherence and compliance based on
quantity and complexity of prescribed medication regimens, as well as studies that
attempt to quantify patient utilities for outcomes of certain diseases.1-3 However I was
unaware of any study that quantified the utility value of taking pills. The overarching
sought to quantify how the act of taking pills affects quality of life or that used a specific
utility value of taking pills as part of the study.
METHODS
Eligibility Criteria
I sought any study that met the following criteria: (1) human subjects older than
18 years, and (2) determined a utility value of taking pills. Because of an initial low yield
of such studies, I expanded the review to include any study that used a utility value for
taking pills. Non-English language studies were excluded.
Search Strategy
To identify relevant studies, a search of the MEDLINE database was conducted
using the following search: ((((cost-utility[Title]) OR cost-effectiveness[Title]))) AND
(((prophylaxis[Title]) OR prevention[Title])). This strategy was supplemented with a
search of the Cochrane database, a hand search of bibliographies, and questioning of
experts. I reviewed the titles and abstracts of the articles identified by the searches, as
well as any relevant Methods sections, and excluded the studies that did not meet
eligibility criteria.
Data Abstraction
Data abstracted from relevant studies included study design, year, country,
medication regimen, utility value, utility range (if given), and the method of utility
RESULTS
A PubMed search yielded 779 results. After exclusion of English and
non-Human results, 643 results remained. After reviewing the titles, abstracts, and methods
sections, 12 results remained. A hand search of those 12 studies’ references yielded
another 8 results that had not already been reviewed. (Figure 1)
Two studies were found that included a systematic method to quantify the utility
of taking pills.4-5 In the first study, the investigators interviewed 74 subjects about
preferences for various health states as well as taking daily aspirin and warfarin.4 Some
subjects were unable to understand the time trade-off concept so they were excluded from
the analysis, leaving a sample size of 57 subjects. Utilities for taking pills were assessed
using a computerized utility assessment tool utilizing the time trade-off method. The
mean utility value for taking aspirin was 0.998, and the mean utility for taking warfarin
was 0.988. It is important to note that the utility value for taking warfarin included the
utility of the routine therapeutic monitoring (i.e., INR checks) every 4 weeks, avoiding
contact sports and avoiding excessive alcohol consumption. Similarly, in the second
study, the investigators interviewed 83 subjects using a time trade-off method to assess
the utility value of taking aspiring and warfarin, as well as other health states.5 Thirteen
subjects were excluded due to either difficulty understanding the time trade-off concept,
inability to understand 1 or more questions, or time constraints for the interview.
Responses of the 70 remaining patients were analyzed and the mean utility value for
taking aspirin was 0.998, and the mean utility value for taking warfarin was 0.987.
A total of eighteen (18) additional studies were found that cite an estimated
searching bibliographies and questioning experts. All studies included in this review
cited a utility value between 0.95 – 1.0, varying depending on the type of medication,
whether or not side effects of the medication are considered, and in the case of
anti-coagulants, whether INR monitoring is considered (Table). Additionally, all of the
studies except two were either decision analyses, or analyses of effectiveness,
cost-benefit, or comparative-effectiveness of taking a medication for a specific purpose on a
daily basis. The medications included in the studies were: aspirin,4-8,10,12-19,21 warfarin,
4-5,8-10,12-15,21 statins,11,17,20 anti-hypertensives,3,22 aspirin + clopidogrel,7,21 apixaban,12,19
rivaroxaban,13,19 ximelagatran,15 and dabigatran.10,19,21 The studies varied on their source
for the utility value. Most of these studies derived their utility value from another study
included in this review; 6-16,19,21 one did not specifically cite a reference for its utility
values;17 another three used the author’s judgment; 3,18,20 and one used physician
surveys.11
DISCUSSION
In this systematic review, I found two studies whose primary goals included
attempting to quantify a specific utility value or range of utility values for taking pills,4-5
though both of these studies was limited by small sample sizes of 57 and 70. The studies
determined two utility values that differed based on the type of medication, aspirin or
warfarin. Additionally, I found eighteen other studies that cited a specific utility value.
3,6-22 The utility values varied from 0.95 to 1.0, the latter of which would indicate no quality
of life effect of taking pills, which is unlikely. Although the utility value for taking pills
suggest. Deriving a precise value for the utility of taking pills would be important not
only for issues of clinical decision making, but also pharmaceutical research, health
policy, and cost-effectiveness research. One study included in this review discussed
whether cost-effectiveness of taking aspirin for cardiovascular disease prevention was
sensitive to the assigned utility of the pill.16 For their base case, the authors used a utility
value of 1.0. Then they examined and reported the cost per quality-adjusted life-year
(QALY) gained across a variety of potential utility values. In their analysis, using a
utility value of about 0.9996 caused an increase in the cost per QALY above the accepted
cost-effective threshold of $50,000/QALY. Their study demonstrates the importance of
having an accurate utility value when calculating cost-effectiveness.
Limitations
The key limitation to this review is that a variety of different terms are used to
refer to the actual utility value for which I was looking. For example, “utility” is
sometimes described as disutility, quality of life, health effect, and health-related quality
of life. This variation made it difficult to find applicable studies that include a utility
value. Therefore, there are likely additional studies that refer to a utility value of taking
pills that were not found upon the literature search for this systematic review.
Future Research
Given the lack of direct assessment of the utility value of taking pills, a beneficial
topic of future research would be a specific patient-centered assessment of this utility
value. Determination of the utility value applied by patients will likely vary depending
(including costs), quantity of pills taken, reason for taking the pills, as well as the specific
REFERENCES
1. Nease RF, Jr, Kneeland T, O'Connor GT,et al. Variation in patient utilities for
outcomes of the management of chronic stable angina: Implications for clinical practice guidelines. JAMA. 1995;273(15):1185-1190. doi: 10.1001/jama.1995.03520390045031.
2. Sackett DL, Torrance GW. The utility of different health states as perceived by the general public. J Chronic Dis. 1978;31(11):697-704. doi: 10.1016/0021-9681(78)90072-3.
3. Torrance GW. Utility approach to measuring health-related quality of life. J Chronic Dis. 1987;40(6):593-600. doi: 10.1016/0021-9681(87)90019-1.
4. Gage BF, Cardinalli AB, Owens DK. The effect of stroke and stroke prophylaxis with aspirin or warfarin on quality of life. Archives of Internal Medicine. 1996;156(16):1829-1836. doi: 10.1001/archinte.1996.00440150083009.
5. Gage BF, Cardinalli AB, Albers GW, Owens DK. Cost-effectiveness of warfarin and aspirin for prophylaxis of stroke in patients with nonvalvular atrial fibrillation. JAMA. 1995;274(23):1839-1845. doi: 10.1001/jama.1995.03530230025025.
6. Augustovski FA, Cantor SB, Thach CT, Spann SJ. Aspirin for primary prevention of cardiovascular events. J Gen Intern Med. 1998;13(12):824-835.
7. Coleman CI, Straznitskas AD, Sobieraj DM, Kluger J, Anglade MW. Cost-Effectiveness of clopidogrel plus aspirin for stroke prevention in patients with atrial fibrillation in whom warfarin is unsuitable. Am J Cardiol.
2012;109(7):1020-1025. http://linkinghub.elsevier.com.libproxy.lib.unc.edu/retrieve/pii/S000291491103450 3?showall=true.
8. Davidson T, Husberg M, Janzon M, Oldgren J, Levin L. Cost-effectiveness of dabigatran compared with warfarin for patients with atrial fibrillation in
sweden. European Heart Journal. 2013;34(3):177-183. doi: 10.1093/eurheartj/ehs157.
9. Eckman MH, Rosand J, Greenberg SM, Gage BF. Cost-effectiveness of using pharmacogenetic information in warfarin dosing for patients with nonvalvular atrial fibrillation. Annals of Internal Medicine. 2009;150(2):73-83. doi: 10.7326/0003-4819-150-2-200901200-00005.
11. JP Greving, FLJ Visseren, GA de Wit, A Algra. Statin treatment for primary prevention of vascular disease: Whom to treat? cost-effectiveness analysis. BMJ. 2011;342. doi: 10.1136/bmj.d1672.
12. Lee S, Mullin R, Blazawski J, Coleman CI. Cost-effectiveness of apixaban compared with warfarin for stroke prevention in atrial fibrillation. PLoS ONE.
2012;7(10):e47473.http://dx.doi.org.libproxy.lib.unc.edu/10.1371%2Fjournal.pone.00474 73.
13. Lee S, Anglade MW, Pham D, Pisacane R, Kluger J, Coleman CI. Cost–Effectiveness of rivaroxaban compared to warfarin for stroke prevention in atrial fibrillation. Am J Cardiol. 2012;110(6):845-851. doi: 10.1016/j.amjcard.2012.05.011.
14. Naglie IG, Detsky AS. Treatment of chronic nonvalvular atrial fibrillation in the elderly: A decision analysis. Medical Decision Making. 1992;12(4):239-249. doi: 10.1177/0272989X9201200401.
15. O’Brien CL, Gage BF. Costs and effectiveness of ximelagatran for stroke prophylaxis in chronic atrial fibrillation. JAMA. 2005;293(6):699-706. doi: 10.1001/jama.293.6.699.
16. Pignone M, Earnshaw S, Pletcher MJ,Tice JA. Aspirin for the primary prevention of cardiovascular disease in women: A cost-utility analysis. Archives of Internal Medicine. 2007;167(3):290-295. doi: 10.1001/archinte.167.3.290.
17. Pignone M, Earnshaw S, Tice JA, Pletcher MJ. Aspirin, statins, or both drugs for the primary prevention of coronary heart disease events in men: A Cost–Utility
analysis. Annals of Internal Medicine. 2006;144(5):326-336.
18. Pignone M, Earnshaw S, McDade C, Pletcher M. Effect of including cancer mortality on the cost-effectiveness of aspirin for primary prevention in men. Journal of General Internal Medicine. 2013:1-9.http://dx.doi.org.libproxy.lib.unc.edu/10.1007/s11606-013-2465-6. doi: 10.1007/s11606-013-2013:1-9.http://dx.doi.org.libproxy.lib.unc.edu/10.1007/s11606-013-2465-6.
19. Pink J, Pirmohamed M, Hughes DA. Comparative effectiveness of dabigatran, rivaroxaban, apixaban, and warfarin in the management of patients with nonvalvular atrial fibrillation. Clin Pharmacol Ther.
2013.http://dx.doi.org.libproxy.lib.unc.edu/10.1038/clpt.2013.83.
21. Shah SV, Gage BF. Cost-effectiveness of dabigatran for stroke prophylaxis in atrial fibrillation. Circulation. 2011;123(22):2562-2570. doi:
10.1161/CIRCULATIONAHA.110.985655.
22. Weinstein MC, Stason WB. Economic considerations in the management of mild hypertension. Ann N Y Acad Sci. 1978;304(1):424-436. doi:
Figure. Study selection
779 studies from initial
search
12 studies’ references hand-‐searched
631 studies did not meet criteria
20 studies 643 articles
reviewed
136 excluded as non-‐ English and/or non-‐Human
Table. Studies Included in Review Study Utility Value Medication
Type
Utility Range Study Type Comments
Augustovski, et. al
0.999 Aspirin 0.985 – 1.0 Decision
analysis Cites: Naglie Coleman, et. al 0.996 0.987 Aspirin Clopidogrel+ Aspirin
0.95 – 1.0 0.95 – 1.0
Cost-effectiveness analysis Cites: Gage (1996), O’Brien, Freeman; Estimate for Clopidogrel+ Aspirin Davidson, et. al 0.998 0.987 Aspirin Warfarin
None given
Cost-effectiveness analysis
Cites: Gage (1996)
Eckman, et.
al 0.99 Warfarin None given Cost-effectiveness
analysis Cites: Gage (1996) Freeman, et. al 0.998 0.994 0.987 Aspirin Dabigatran Warfarin
0.994 – 1.0 0.975 – 1.0 0.953 – 1.0
Cost-effectiveness analysis
Cites: Gage (1996), O’Brien
Gage, et. al (1995)
0.998 0.988
Aspirin Warfarin
0.96 – 1.0 0.92 – 1.0
Cost-effectiveness analysis 57 patient interviews using time trade-off method Gage, et. al
(1996)
0.998 0.987
Aspirin Warfarin
0.994 – 1.0 0.953 – 1.0
Cross-sectional study with patient interviews 70 patient interviews using time trade-off method Greving, et. al
0.999 Statin None given
Cost-effectiveness analysis Cites: Pignone (2006), Augustovski, Naglie Lee, et. al 0.998
0.994 0.987
Aspirin Apixaban Warfarin
0.994 – 1.0 0.975 – 1.0 0.940 – 1.0
Cost-effectiveness analysis
Cites: Freeman
Lee, et. al 0.998 0.994 0.987
Aspirin Rivaroxaban Warfarin
0.994 – 1.0 0.975 – 1.0 0.940 – 1.0
Cost-effectiveness analysis
Cites: O’Brien, Gage (1996)
Naglie, et. al 0.999 0.990
Aspirin Warfarin
0.985 – 1.0 0.95-1.0 Decision analysis Cites: Torrance, Weinstein O’Brien, et. al 0.998 0.987 0.989 Aspirin Warfarin Ximelagatran
0.994 – 1.0 0.953 – 1.0 0.986 – 0.991
Cost-effectiveness analysis
0.994
(< 6 months) Ximelagatran (> 6 months)
0.993 – 0.996
Ximelagatran utilities from physician survey Pignone, et. al (2006) 1.0 1.0 Aspirin Statins Used for sensitivity analysis, but range not given
Cost-utility analysis
No reference given; Utility value varied in sensitivity analysis Pignone, et.
al (2007)
1.0 Aspirin Used for
sensitivity analysis, but range not given
Cost-utility analysis Cites: Naglie; Utility value varied in sensitivity analysis Pignone, et.
al (2013) 0.999 Aspirin Cost-utility analysis Assumption
Pink, et al. 0.998 0.998 0.998 0.998 0.987 Aspirin Apixaban Dabigatran Rivaroxaban Warfarin Probabilistic sensitivity analysis, but range not given
Comparative effectiveness analysis Cites: Gage (1996) Pletcher, et. al
1.0 Statins None given
Cost-effectiveness analysis
Clinical judgment
Shah, et. al 0.998 0.998 0.987 0.994 Aspirin Aspirin + Clopidogrel Warfarin Dabigatran
0.994 – 1.0 0.994 – 1.0
0.953 – 1.0 0.990 – 0.998
Cost-effectiveness analysis Cites: Gage (1996) Torrance, et. al (1987)
0.95 – 0.99
Anti-hypertensives
0.95 – 0.99 Original Article Author’s judgment Weinstein
and Stason
0.99
Anti-hypertensives
None given Cost-utility analysis
Quantifying the Utility of Taking Pills for Preventing Adverse Health Outcomes ABSTRACT
BACKGROUND: Utility measures are used in cost-effectiveness studies to represent the
effect a given outcome or intervention has on quality of life. Pills are common
interventions used to try to reduce the risk of an adverse health outcome. The utility
value for taking pills is often estimated or assumed to be 1.0, indicating no effect on
quality of life, but to our knowledge there are few published studies that have
systematically quantified this utility value.
OBJECTIVE: To quantify the utility value of taking pills to prevent an adverse health
outcome.
METHODS: We invited healthcare system employees to participate in an online survey
about taking pills. The main outcome variables were utility values for taking one pill per
day, two pills per day, and one pill twice daily, all assessed using time trade off. We also
assessed utility value for taking one pill per day using standard gamble and
willingness-to-pay methods. We compared utility values across several demographic characteristics
and by numeracy level.
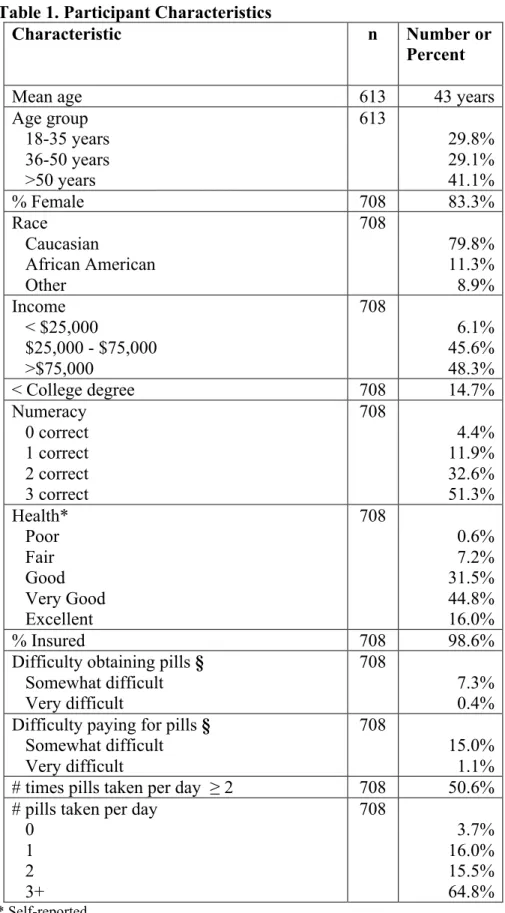
RESULTS: A total of 708 adults completed the survey. Mean age of respondents was 43
years. The majority of the respondents were female (83%) and Caucasian (80%). Almost
all participants had health insurance (99%), and about 84% had at least an adequate
numeracy level. Most (80%) took at least two pills per day. Mean utility values using the
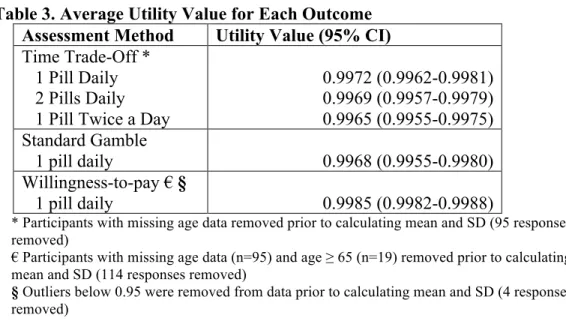
time trade-off method were: 0.9972 (95% CI 0.9962-0.9981) for one pill daily, 0.9969
(95% CI 0.9957-0.9979) for two pills daily, and 0.9965 (95% CI 0.9955-0.9975) for
gamble and willingness-to-pay methods were 0.9968 (0.9955-0.9980) and 0.9985 (95%
CI 0.9982-0.9988), respectively. Mean utility values did not vary significantly by age,
sex, race, education level, income level, or number of pills taken per day. Those with low
numeracy level tended to have slightly lower utility values.
CONCLUSIONS: The utility value of taking pills daily in order to prevent an adverse
health outcome is approximately 0.997, varying slightly depending on the pill regimen
INTRODUCTION
The desire to take medicine is perhaps the greatest feature which distinguishes man from animals. – Sir William Osler
Most adults will end up taking daily pills at some point in their lives. Many
adults take multiple pills, often more than once per day. When people take pills they
must go through a process that involves, but is not limited to, obtaining the pills, paying
for them, ingesting the pills, and remembering to take the pills. These processes, part of
the routine of “taking pills,” can theoretically affect quality of life. If the pills require a
prescription or therapeutic monitoring, the process also includes visits to clinicians and
pharmacists, which may further affect quality of life.
When people take pills on a daily basis, they do so either to try to prevent an
undesired health outcome or to treat a specific condition and/or its symptoms. In both
cases, there may be some diminution in quality of life attributable to pill-taking. Side
effects of pills aside, the effects of pill-taking on quality of life are likely to vary not only
based on the reason people take pills but also on other factors such as number of pills
taken per day, number taken at one time, and even the size of the pills. In health studies,
effects on quality of life are often measured by assigning a numerical value that
represents the relative quality of life effect that a certain health state carries versus a
standard state. This numerical value is termed a “utility.” Utilities usually range from 0
to 1, with 0 representing death and 1 representing perfect health.
There are many studies that address patient adherence and compliance based on
quantity and complexity of prescribed medication regimens, as well as studies that
aware of only two studies that included a systematic effort to quantify the utility value of
taking pills.4-5 In those studies, 57 and 70 patients were interviewed, and using the time
trade-off utility assessment method, the investigators found a utility value of 0.998 for
taking daily aspirin in both studies and 0.987 for taking warfarin (including monitoring)
in one study and 0.988 for taking warfarin in the second study. There are additional
studies that cite a utility value or discount value to taking pills,3,6-22 though some of these
studies seem to have chosen values arbitrarily, based on expert opinion, or based on other
published articles.
We conducted a cross-sectional study using an electronic survey to quantify the
utility of taking pills for the purpose of trying to prevent an adverse health outcome.
Secondarily, we sought to understand whether the average utility value varies by
demographics and other characteristics. Knowing this information will be useful for
researchers conducting cost-effectiveness analyses or studying the utility of combination
medications. Additionally, this information may inform interventions designed to
improve adherence to medication regimens.
METHODS
Survey Development
We used a focus group composed of eight people to guide the framing of the
utility questions for our survey. Specifically, we tested each of the utility value
measurement methods: rating scale, time trade-off (TTO), willingness-to-pay (WTP), and
standard gamble (SG). When asked test questions using the rating scale method (e.g., a
utility of taking pills, often assigning utility values of 0.7 or lower to taking one pill per
day – a value which would be comparable to non-disabling stroke (0.75).4 The WTP
method also proved difficult as a measure for pill-taking utility due to most participants
not being willing to pay anything for an alternative health state. The standard gamble
was a difficult concept for focus group participants to grasp, but feedback was used to
refine an SG question. The time trade-off method seemed to be the best understood
method by the focus group participants, providing a range of responses we considered
most consistent with the likely value for the utility of taking pills.
Our survey (Appendix) was created using Qualtrics and consisted of initial
questions about the respondent’s personal pill regimen, as well as questions about how
specific qualities of pills (e.g., size, shape) affect the difficulty of taking a pill. Following
this initial section, we transitioned into the utility measurement section using a series of
time trade-off method questions. We also included two additional questions to assess
utility via a willingness to pay method and a standard gamble method. We included
questions in order to ascertain numeracy level of each respondent, followed by a final
section asking for basic demographic information.
We pilot tested the survey using a convenience sample to gather feedback on ease
of completion and clarity of questions. Based on feedback, we refined a few items to
maximize clarity. The study was granted exempt status by the Office of Human Research
Participant Selection
An informational email advertising the study and asking for volunteers was sent
to all UNC Healthcare employees. Additionally, an informational newsletter ad was
placed in the UNC Healthcare employee newsletter and the UNC School of Medicine
employee newsletter. An estimated total of 18,500 people were sent the advertisement
either by email announcement (8,592) or by newsletter ad (10,000). The only criterion
for eligibility was age 18 years or older.
Variables
The main outcome variables for this study were utility values for taking one pill
per day, two pills daily, and one pill twice daily. These values were all obtained using a
time trade-off utility assessment method. We also obtained a utility value for taking one
pill per day using both the standard gamble and willingness-to-pay methods. Participants
rated difficulty obtaining medications and difficulty paying for medications on a scale
from 1 to 5. For analysis, these were then combined into three categories: not difficult,
neutral, and difficult. Additionally, numeracy was assessed using a 3-question numeracy
questionnaire, with overall numeracy level then categorized as either “low” if the
respondent got 0-1 correct answers or “adequate” if the respondent got 2-3 answers
correct.23
Data Analysis
Participant responses to time trade-off, standard gamble and willingness-to-pay
was performed using STATA 12 (College Station, TX). The TTO utility value was
derived by calculating the proportion of time that each respondent was willing to give up
by the amount of time each respondent had left in his or her life (using an average life
expectancy of 78 years) and subtracting from 1. Some survey respondents did not enter
age in the survey, which prevented us from being able to calculate a time trade-off utility
value. Those participants with missing age data (n=95) were excluded from the time
trade-off utility analysis.
The utility value for SG was calculated as 1 minus the risk of death the participant
was willing to accept for the alternate treatment. The utility value using WTP was
derived by dividing the amount a participant was willing to pay (to not have to take a pill)
by their total estimated earnings through an average retirement age of 65 years and
subtracting from 1. We excluded all participants who did not provide an age (n=95) and
those who were older than 65 (n=19). We used the middle value from whichever income
category the participant selected. The responses received for WTP varied significantly in
range, which led to some utility values being considerable outliers. Therefore, we also
excluded WTP utility values below 0.95 (n=4). A total of 118 responses were excluded
from the WTP analysis.
We describe basic participant demographics ratings of pill characteristics and
average utility values using proportions with 95% confidence intervals or means with
standard deviations. One-way ANOVA was used to compare utility values by participant
characteristics. All utility values were rounded to four decimal places. A p-value ≤ 0.05
RESULTS
Characteristics of Respondents
A total of 758 people opened the survey link, with 9 who denied consent. Of the
749 who gave consent and began the survey, 708 finished the survey before it was closed
(Figure 1). The rate of completion among all who were sent an advertisement about the
study was 708/18,500 (~3.8%). Mean age of respondents was 43 years, with more
participants in the >50 year old category (41%) than either the 18-35 (30%) or the 36-50
(29%) year old categories (Table 1). Most participants were female (83%) and Caucasian
(80%), while almost all participants had health insurance (99%). Additionally, almost
half of the participants had annual household incomes greater than $75,000 (48%) while
about 85% had at least a college degree. Based on a set of three numeracy questions,
84% had adequate numeracy and 61% rated their health as very good or excellent. Less
than 8% of participants reported any degree of difficulty obtaining their pills, while about
16% of participants reported some degree of difficulty paying for their pills.
Approximately 65% took at least 3 pills per day, while only 3.7% took no pills per day
(Table 1).
Pill Characteristics
Pill size was the most important characteristic affecting difficulty of pill-taking,
with a mean score of 3.06 on a scale of 1 to 5 where 5 represents the greatest influence on
difficulty (Table 2). Shape was the least important characteristic with a mean score of
Time Trade-Off Utility Value
The overall average utility value using time trade-off revealed a utility of 0.9972
for taking 1 pill daily, 0.9969 for taking 2 pills daily and 0.9965 for taking 1 pill twice
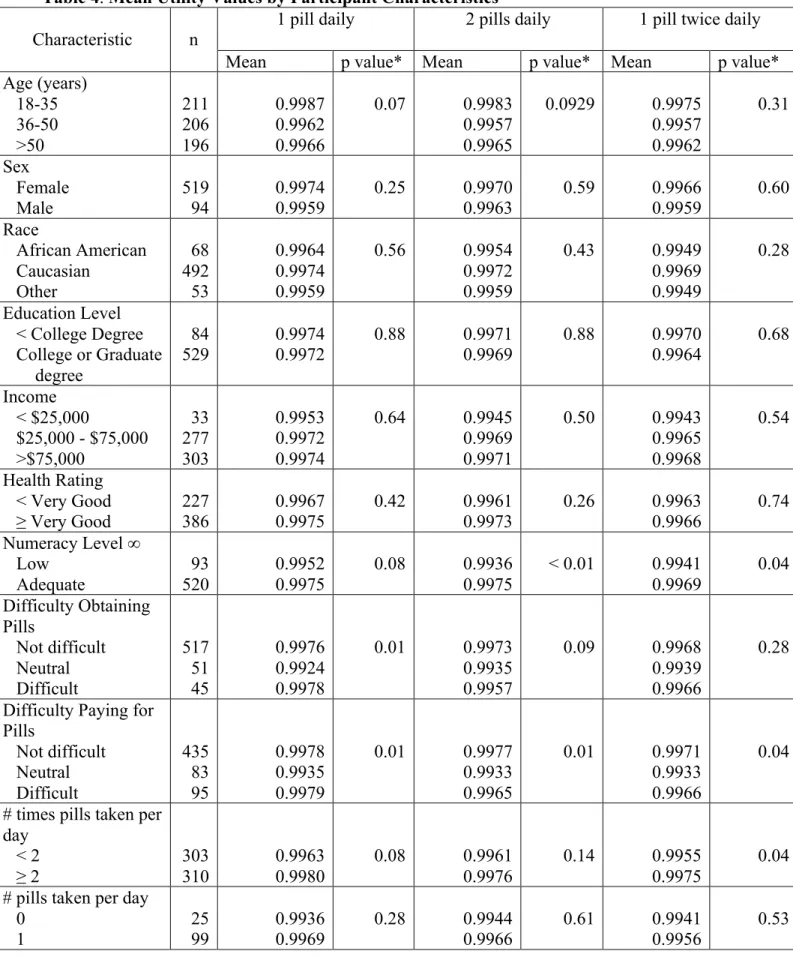
daily (Table 3). Mean utility value was not significantly different by age, sex, race,
education level, or income level (Table 4). When considering 2 pills daily and one pill
twice daily, respondents with low numeracy level had slightly lower mean utility values
compared to those with adequate numeracy level. There also appeared to be slight
differences based on difficulty obtaining pills. Although not statistically significant, the
small number of respondents who indicated currently taking no daily pills did have a
lower mean value for utility of taking pills than those who took at least 1 pill per day.
Standard Gamble Utility Value
Using a standard gamble method, the overall average utility value for taking 1 pill
daily was 0.9968 (Table 3). Mean utility value by SG also did not vary by age, sex, race,
education level, or self-reported health status (Table 5). As with the TTO, those who
took no daily pills assigned a lower utility value to taking pills than those who took at
least 1 pill per day, although the difference was not statistically significant. Again, those
with lower numeracy level assigned a lower mean utility value (0.9919 vs. 0.9976,
Willingness-to Pay Utility Value
Using a willingness-to-pay utility assessment method, the overall average utility
for taking one pill daily was 0.9985 (Table 3). With WTP, those in the higher age group
and those with lower income both had lower mean utility values (Table 5).
DISCUSSION
The primary goal of this study was to quantify a specific utility value of taking
pills. We hypothesized that there is some diminution in quality of life attributable to
pill-taking, but that it would be small. Based on our results, we are confident that a reasonable
utility value for taking a pill daily to try to prevent an adverse health outcome is 0.997.
The 95% confidence interval for this value is 0.996 to 0.998, and this value appears to
hold across multiple comparison groups. People who do not take pills on a daily basis
may rate the act of taking a pill on quality of life as having a greater impact (i.e. lower
utility) than those who actually do take pills on a daily basis. Although our sample size
for this subgroup was small, this finding suggests that moving from a state of taking no
pills to a state of having to take daily pills may be viewed as having a larger effect
(though still small overall effect) on quality of life than transitioning from other states
(e.g., 1 pill to 2 pills).
Our results are comparable to two prior studies that measured a utility value for
pill-taking.4-5 Our utility value of 0.997 is similar to the value of 0.998 found in both
prior studies for taking aspirin. However, our value is higher than the values for taking
warfarin noted in prior studies: 0.987 and 0.988. This difference is likely due to the fact
INR monitoring and lifestyle limitations such as avoidance of excessive alcohol and
contact sports. We sought to examine the utility of pill-taking itself, viewing aspects such
as bothersome side effects, limitations, and any required therapeutic monitoring as
separate issues.
We are aware of at least nineteen additional studies that use a utility value of
taking pills in their analyses. All of the studies cited values between 0.95 and 1.0,
depending on the type of pill and whether or not side effects and monitoring were
considered.3-22 Most of the analytic studies used a value close to 1.0 as their base case
and then performed a sensitivity analysis to analyze a range. The lower end of their
range was generally lower than the values that we obtained in this study.
A very small change in the utility value assigned to pill-taking can have an
important effect on cost-effectiveness results. For example, one study examined whether
cost-effectiveness of aspirin was sensitive to the assigned utility value of taking the pill.16
The base case used a utility value of 1.0; the authors then examined the cost per
quality-adjusted life-year (QALY) gained across a variety of utility values for taking aspirin. In
that analysis, using any utility value below about 0.9996 caused an increase in the cost
per QALY above the accepted cost-effective threshold of $50,000/QALY. Such an
analysis highlights the importance of having an accurate utility value for pill-taking.
As expected, as the pill regimen becomes more complex and time-consuming, the
utility decreases. From one pill daily to two pills daily to one pill twice daily, the utility
value incrementally decreased from 0.9972 to 0.9969 to 0.9965, respectively, using the
TTO method (Table 3). The SG method and WTP method both revealed similar values
suggest that two things that can be done to minimize the impact of pill-taking on quality
of life are keeping pill regimens simple (i.e., once daily) and making pills small in size.
Limitations
There are several limitations we acknowledge. First, individuals who are eligible
to receive informational emails and the newsletter can easily opt out using their email
filter. Additionally, many people simply delete informational emails upon receipt into
their email inbox. Therefore, we don’t know precisely how many people actually
received the email and opened it. If the people who did not participate had answered the
utility questions differently than people who did respond, we would have a nonresponse
bias. Our respondents were predominantly women, although we saw no differences in
utility values by sex. Our respondents were geographically isolated to the Chapel Hill,
North Carolina area. Although unlikely, it is possible that utility values could vary by
geographic region. Our WTP analysis did not account for any participants over the age
of 65 years and also does not account for any income over age 65, which is not likely. It
also assumes that a person’s annual income remains stable over a lifetime, which is also
unlikely. We therefore have the least confidence in the estimates generated by WTP.
Conclusion
The utility value of taking a pill daily to prevent an adverse health outcome is
approximately 0.997. Knowing this value is useful for researchers who conduct
people might be willing to pay for combination pills. Finally, this study reminds
clinicians that patients appreciate once-daily pill regimens and small pills.
REFERENCES
1. Nease RF, Jr, Kneeland T, O'Connor GT, et al. Variation in patient utilities for outcomes of the management of chronic stable angina: Implications for clinical practice guidelines. JAMA. 1995;273(15):1185-1190. doi: 10.1001/jama.1995.03520390045031.
2. Sackett DL, Torrance GW. The utility of different health states as perceived by the general public. J Chronic Dis. 1978;31(11):697-704. doi: 10.1016/0021-9681(78)90072-3.
3. Torrance GW. Utility approach to measuring health-related quality of life. J Chronic Dis. 1987;40(6):593-600. doi: 10.1016/0021-9681(87)90019-1.
4. Gage BF, Cardinalli AB, Owens DK. The effect of stroke and stroke prophylaxis with aspirin or warfarin on quality of life. Archives of Internal Medicine. 1996;156(16):1829-1836. doi: 10.1001/archinte.1996.00440150083009.
5. Gage BF, Cardinalli AB, Albers GW, Owens DK. Cost-effectiveness of warfarin and aspirin for prophylaxis of stroke in patients with nonvalvular atrial fibrillation. JAMA. 1995;274(23):1839-1845. doi: 10.1001/jama.1995.03530230025025.
6. Augustovski FA, Cantor SB, Thach CT, Spann SJ. Aspirin for primary prevention of cardiovascular events. J Gen Intern Med. 1998;13(12):824-835.
7. Coleman CI, Straznitskas AD, Sobieraj DM, Kluger J, Anglade MW. Cost-Effectiveness of clopidogrel plus aspirin for stroke prevention in patients with atrial fibrillation in whom warfarin is unsuitable. Am J Cardiol.
2012;109(7):1020-1025. http://linkinghub.elsevier.com.libproxy.lib.unc.edu/retrieve/pii/S000291491103450 3?showall=true.
8. Davidson T, Husberg M, Janzon M, Oldgren J, Levin L. Cost-effectiveness of dabigatran compared with warfarin for patients with atrial fibrillation in
sweden. European Heart Journal. 2013;34(3):177-183. doi: 10.1093/eurheartj/ehs157.
9. Eckman MH, Rosand J, Greenberg SM, Gage BF. Cost-effectiveness of using pharmacogenetic information in warfarin dosing for patients with nonvalvular atrial fibrillation. Annals of Internal Medicine. 2009;150(2):73-83. doi: 10.7326/0003-4819-150-2-200901200-00005.
11. JP Greving, FLJ Visseren, GA de Wit, A Algra. Statin treatment for primary prevention of vascular disease: Whom to treat? cost-effectiveness analysis. BMJ. 2011;342. doi: 10.1136/bmj.d1672.
12. Lee S, Mullin R, Blazawski J, Coleman CI. Cost-effectiveness of apixaban compared with warfarin for stroke prevention in atrial fibrillation. PLoS ONE.
2012;7(10):e47473.http://dx.doi.org.libproxy.lib.unc.edu/10.1371%2Fjournal.pone.00474 73.
13. Lee S, Anglade MW, Pham D, Pisacane R, Kluger J, Coleman CI. Cost–Effectiveness of rivaroxaban compared to warfarin for stroke prevention in atrial fibrillation. Am J Cardiol. 2012;110(6):845-851. doi: 10.1016/j.amjcard.2012.05.011.
14. Naglie IG, Detsky AS. Treatment of chronic nonvalvular atrial fibrillation in the elderly: A decision analysis. Medical Decision Making. 1992;12(4):239-249. doi: 10.1177/0272989X9201200401.
15. O’Brien CL, Gage BF. Costs and effectiveness of ximelagatran for stroke prophylaxis in chronic atrial fibrillation. JAMA. 2005;293(6):699-706. doi: 10.1001/jama.293.6.699.
16. Pignone M, Earnshaw S, Pletcher MJ, Tice JA. Aspirin for the primary prevention of cardiovascular disease in women: A cost-utility analysis. Archives of Internal Medicine. 2007;167(3):290-295. doi: 10.1001/archinte.167.3.290.
17. Pignone M, Earnshaw S, Tice JA, Pletcher MJ. Aspirin, statins, or both drugs for the primary prevention of coronary heart disease events in men: A Cost–Utility
analysis. Annals of Internal Medicine. 2006;144(5):326-336.
18. Pignone M, Earnshaw S, McDade C, Pletcher M. Effect of including cancer mortality on the cost-effectiveness of aspirin for primary prevention in men. Journal of General Internal Medicine. 2013:1-9.http://dx.doi.org.libproxy.lib.unc.edu/10.1007/s11606-013-2465-6. doi: 10.1007/s11606-013-2013:1-9.http://dx.doi.org.libproxy.lib.unc.edu/10.1007/s11606-013-2465-6.
19. Pink J, Pirmohamed M, Hughes DA. Comparative effectiveness of dabigatran, rivaroxaban, apixaban, and warfarin in the management of patients with nonvalvular atrial fibrillation. Clin Pharmacol Ther.
2013.http://dx.doi.org.libproxy.lib.unc.edu/10.1038/clpt.2013.83.
21. Shah SV, Gage BF. Cost-effectiveness of dabigatran for stroke prophylaxis in atrial fibrillation. Circulation. 2011;123(22):2562-2570. doi:
10.1161/CIRCULATIONAHA.110.985655.
22. Weinstein MC, Stason WB. Economic considerations in the management of mild hypertension. Ann N Y Acad Sci. 1978;304(1):424-436. doi:
10.1111/j.1749-6632.1978.tb25625.x.
Figure 1. Study Participation Total of 18,500 sent advertisemen
t (8,592 by email + 10,000 by newsletter)
749 people began survey
9 did not give consent
41 did not complete
survey
708 finished survey 758 people
opened survey
Unknown number have opted out of emails or have junk mail filter
Table 1.Participant Characteristics
Characteristic n Number or
Percent
Mean age 613 43 years
Age group 18-35 years 36-50 years >50 years 613 29.8% 29.1% 41.1%
% Female 708 83.3%
Race Caucasian African American Other 708 79.8% 11.3% 8.9% Income < $25,000
$25,000 - $75,000 >$75,000
708
6.1% 45.6% 48.3%
< College degree 708 14.7%
Numeracy 0 correct 1 correct 2 correct 3 correct 708 4.4% 11.9% 32.6% 51.3% Health* Poor Fair Good Very Good Excellent 708 0.6% 7.2% 31.5% 44.8% 16.0%
% Insured 708 98.6%
Difficulty obtaining pills §
Somewhat difficult Very difficult
708
7.3% 0.4% Difficulty paying for pills §
Somewhat difficult Very difficult
708
15.0% 1.1%
# times pills taken per day ≥ 2 708 50.6%
# pills taken per day 0 1 2 3+ 708 3.7% 16.0% 15.5% 64.8% * Self-reported
Table 2.Participant Rating of Importance of Characteristics of Pills Characteristic of Pill Mean Rating* (SD)
Size 3.06 (1.55)
Cost 2.74 (1.46)
Taste 2.66 (1.44)
Smell 2.33 (1.39)
Coating 2.31 (1.34)
Shape 2.23 (1.33)
Table 3.Average Utility Value for Each Outcome Assessment Method Utility Value (95% CI)
Time Trade-Off * 1 Pill Daily 2 Pills Daily 1 Pill Twice a Day
0.9972 (0.9962-0.9981) 0.9969 (0.9957-0.9979) 0.9965 (0.9955-0.9975) Standard Gamble
1 pill daily 0.9968 (0.9955-0.9980)
Willingness-to-pay ۤ
1 pill daily 0.9985 (0.9982-0.9988)
* Participants with missing age data removed prior to calculating mean and SD (95 responses removed)
€ Participants with missing age data (n=95) and age ≥ 65 (n=19) removed prior to calculating mean and SD (114 responses removed)
Table 4. Mean Utility Values by Participant Characteristics ^
Characteristic n
1 pill daily 2 pills daily 1 pill twice daily
Mean p value* Mean p value* Mean p value*
Age (years) 18-35 36-50 >50 211 206 196 0.9987 0.9962 0.9966
0.07 0.9983
0.9957 0.9965
0.0929 0.9975
0.9957 0.9962
0.31
Sex Female
Male 519 94 0.9974 0.9959 0.25 0.9970 0.9963 0.59 0.9966 0.9959 0.60 Race African American Caucasian Other 68 492 53 0.9964 0.9974 0.9959
0.56 0.9954
0.9972 0.9959
0.43 0.9949
0.9969 0.9949
0.28
Education Level < College Degree College or Graduate
degree
84 529
0.9974 0.9972
0.88 0.9971
0.9969
0.88 0.9970
0.9964
0.68
Income < $25,000
$25,000 - $75,000 >$75,000 33 277 303 0.9953 0.9972 0.9974
0.64 0.9945
0.9969 0.9971
0.50 0.9943
0.9965 0.9968
0.54
Health Rating < Very Good ≥ Very Good
227 386
0.9967 0.9975
0.42 0.9961
0.9973
0.26 0.9963
0.9966
0.74
Numeracy Level ∞
Low Adequate 93 520 0.9952 0.9975
0.08 0.9936
0.9975
< 0.01 0.9941 0.9969 0.04 Difficulty Obtaining Pills Not difficult Neutral Difficult 517 51 45 0.9976 0.9924 0.9978
0.01 0.9973
0.9935 0.9957
0.09 0.9968
0.9939 0.9966
0.28
Difficulty Paying for Pills Not difficult Neutral Difficult 435 83 95 0.9978 0.9935 0.9979
0.01 0.9977
0.9933 0.9965
0.01 0.9971
0.9933 0.9966
0.04
# times pills taken per day
< 2 ≥ 2
303 310 0.9963 0.9980 0.08 0.9961 0.9976 0.14 0.9955 0.9975 0.04
# pills taken per day 0
2 3+
96 393
0.9987 0.9971
0.9980 0.9968
0.9976 0.9966
^ Utilities derived using time trade-off technique * p values based on one-way analysis of variance
Table 5. Mean Utility Value of Taking 1 Pill Daily by Participant Characteristics^
Characteristic
Standard Gamble Willingness-to-Pay € §
n Mean p value* n Mean p value*
Age (years) 18-35 36-50 >50 211 206 291 0.9966 0.9973 0.9963
0.81 210 205 175 0.9995 0.9987 0.9971 < 0.01 Sex Female
Male 590 118 0.9966 0.9974 0.62 493 97 0.9984 0.9993 0.04
Race African American Caucasian Other 80 565 63 0.9934 0.9973 0.9957
0.14 68 469 53 0.9981 0.9986 0.9981 0.41 Education Level < College Degree
College or Graduate degree 104 604
0.9950 0.9970
0.25 80 512 0.9988 0.9985 0.47 Income Level <$25,000 $25,000-$75,000 >$75,000 43 323 342 0.9971 0.9966 0.9968
0.97 36 273 281 0.9967 0.9982 0.9990 < 0.01 Health Rating < Very Good ≥ Very Good
278 430
0.9964 0.9969
0.74 233 357
0.9984 0.9986
0.71
Numeracy Level ∞
Low Adequate 115 593 0.9919 0.9976
< 0.01 67 523
0.9986 0.9985
0.79
Difficulty Obtaining Pills Not difficult Neutral Difficult 594 59 55 0.9971 0.9962 0.9925
0.13 500 48 42 0.9985 0.9975 0.9993 0.09
Difficulty Paying for Pills Not difficult Neutral Difficult 493 101 114 0.9976 0.9969 0.9925
0.01 418 80 92 0.9986 0.9977 0.9986 0.15
# times pills taken per day < 2
≥ 2
350 358
0.9961 0.9973
0.34 295 295
0.9988 0.9982
0.10
# pills taken per day 0 1 2 3+ 26 113 110 459 0.9953 0.9965 0.9989 0.9963 0.49 25 97 94 374 0.9994 0.9985 0.9991 0.9983 0.27
€ Participants with missing age data (n=95) and age ≥ 65 (n=19) removed prior to calculating mean and SD (114 responses removed)
§ Outliers below 0.95 were removed from data prior to calculating mean and SD (4 responses removed)
APPENDIX. Survey Items.
What is the effect on quality of life of taking pills?
What is your age? ______
We’d like to start by asking you a few questions about taking pills, which includes capsules, tablets, or gelcaps.
How many pills do you take each day? (Include vitamins and prescription medications you take daily but not pills you take only once in a while)
o 0 (skip next three items)
o 1
o 2
o 3
o 4
o 5
o 6 or more
How many different times a day do you regularly take pills?
o Once per day
o 2 times per day
o 3 times per day
o More than 3 times per day
How difficult is it for you to pay for your pills?
o Very difficult
o Somewhat difficult
o Neutral
o Not very difficult
o Not difficult at all
How difficult is it for you to obtain for your pills?
o Very difficult
o Somewhat difficult
o Neutral
o Not very difficult
Rate the extent to which each of the following characteristics of a pill affect the difficulty of taking a pill, where 1 indicates no effect at all and 5 indicates a large effect.
1 Does not affect at all
2 3 4 5
Greatly affects difficulty
Size ∘ ∘ ∘ ∘ ∘
Taste ∘ ∘ ∘ ∘ ∘
Smell ∘ ∘ ∘ ∘ ∘
Shape ∘ ∘ ∘ ∘ ∘
Coating ∘ ∘ ∘ ∘ ∘
Cost ∘ ∘ ∘ ∘ ∘
Please read the following carefully:
The next set of questions pertains to taking pills to PREVENT a heart attack and stroke. Assume that by taking these pills you will live your life free of heart attack and stroke. Assume that the pills do not cause any side effects and are free of charge. However, you do have to obtain a prescription from your doctor in order to get them, fill the
prescription at the pharmacy, remember to take the pill every day, and physically swallow the pill.
Now assume that you have a choice. Instead of taking the pill every day, you could give up time at the end of your life and also be guaranteed to live a life free of heart attacks and stroke.
Approximately how much of your remaining life would you give up in order to NOT
have to take this 1 pill every day for the rest of your life?
o None
o 2 weeks
o 1 month
o 3 months
o 6 months
o 9 months
o 12 months
o 18 months
How about if you were taking two such pills, at the same time of day (for example: 2 pills in the morning)?
o None
o 2 weeks
o 1 month
o 3 months
o 6 months
o 9 months
o 12 months
o 18 months
o 24 months
How about if you were taking two such pills, at two DIFFERENT times of day (for example: 1 pill in the morning, 1 pill at night)?
o None
o 2 weeks
o 1 month
o 3 months
o 6 months
o 9 months
o 12 months
o 18 months
o 24 months
Imagine that you have been diagnosed with a health condition that, if not treated, will limit the quality and length of your life. The physician who diagnoses you tells you that there are two known treatments, both of which will cure you completely.
Treatment 1 is a one-time treatment that cures you but happens to also have the potential to cause immediate death.
Treatment 2 is a pill you have to take once a day every day for the rest of your life. There is 0% risk of death from this pill.
Approximately what chance of immediate death are you willing to risk to take Treatment 1 one time instead of taking Treatment 2 every day for the rest of your life?
o 100,000 in 1,000,000
o 10,000 in 1,000,000
o 1,000 in 1,000,000
o 100 in 1,000,000
o 10 in 1,000,000
o 1 in 1,000,000
o 0.1 in 1,000,000
Assume you will work until you are 65 years of age. You can get treatment 1 for a one-time payment. Approximately how much would you be willing to pay to receive Treatment 1 one time instead of taking Treatment 2 every day for the rest of your life? $__________
Next, we would like to ask you a few questions about chance and working with numbers. For each question, please give us your best estimate, even if you think your estimate is only a guess.
A person taking Drug A has a 1% chance of having an allergic reaction. If 1,000 people take Drug A, how many people would you expect to have an allergic reaction?
# of people = ________
The next question asks how many times something would happen in 1,000 tries.
Example: Imagine picking a jelly bean from a jar filled with an equal number of 4 different colored jelly beans (red, black, blue and green). Out of 1,000 tries, how many times would you expect to pick a red jelly bean?
Answer: 250 times out of 1,000
Now you try: Imagine that we flip a coin 1,000 times. What is your best guess about how many times the coin would come up heads in 1,000 flips?
# heads in 1,000 flips = _____________
Just a few final questions…
What is your gender?
o Male
o Female
What best describes your race/ethnicity?
o African American
o Asian
o Caucasian
o Native American
o Pacific Islander
What is your highest level of education completed?
o Less than high school
o High school or GED
o Some college
o College degree
o Graduate or professional degree
How would you rate your overall health?
o Poor
o Fair
o Good
o Very Good
o Excellent
Do you have health insurance?
o No
o Yes
What is your total household income?
o <$10,000
o $10,000-$24,999
o $25,000-$49,999
o $50,000-$74,999
o $75,000-$99,999
o $100,000-$150,000