20
Feature Optimization for Predicting Readability of Arabic L1 and L2
Hind Saddiki,†‡Nizar Habash,†Violetta Cavalli-Sforza,? and Muhamed Al Khalil†
†New York University Abu Dhabi
‡Mohammed V University in Rabat ?Al Akhawayn University in Ifrane
{hind.saddiki,nizar.habash,muhamed.alkhalil}@nyu.edu,[email protected]
Abstract
Advances in automatic readability assess-ment can impact the way people consume information in a number of domains. Ara-bic, being a low-resource and morphologi-cally complex language, presents numer-ous challenges to the task of automatic readability assessment. In this paper, we present the largest and most in-depth com-putational readability study for Arabic to date. We study a large set of features with varying depths, from shallow words to syntactic trees, for both L1 and L2 read-ability tasks. Our best L1 readread-ability ac-curacy result is 94.8% (75% error reduc-tion from a commonly used baseline). The comparable results for L2 are 72.4% (45% error reduction). We also demonstrate the added value of leveraging L1 features for L2 readability prediction.
1 Introduction
The purpose of studies in readability is to develop and evaluate measures of how well a reader can understand a given text. Computational readabil-ity measures, historically shallow and formulaic, are now leveraging machine learning (ML) mod-els and natural language processing (NLP) fea-tures for automated, in-depth readability assess-ment systems. Advances in readability assessassess-ment can impact the way people consume information in a number of domains. Prime among them is education, where matching reading material to a learner’s level can serve instructors, book publish-ers, and learners themselves looking for suitable reading material. Content for the general public, such as media and news articles, administrative, legal or healthcare documents, governmental web-sites and so on, needs to be written at a level
ac-cessible to different educational backgrounds. Ef-forts in building computational readability mod-els and integrating them in various applications continue to grow, especially for more resource-rich languages (Dell’Orletta et al.,2014a; Collins-Thompson,2014).
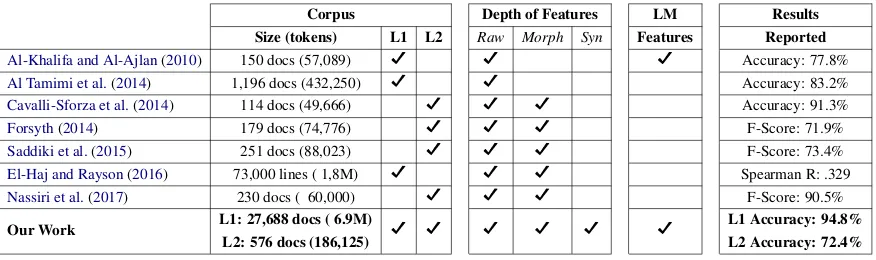
Corpus Depth of Features LM Results
Size (tokens) L1 L2 Raw Morph Syn Features Reported
Al-Khalifa and Al-Ajlan(2010) 150 docs (57,089) D D D Accuracy: 77.8%
Al Tamimi et al.(2014) 1,196 docs (432,250) D D Accuracy: 83.2%
Cavalli-Sforza et al.(2014) 114 docs (49,666) D D D Accuracy: 91.3%
Forsyth(2014) 179 docs (74,776) D D D F-Score: 71.9%
Saddiki et al.(2015) 251 docs (88,023) D D D F-Score: 73.4%
El-Haj and Rayson(2016) 73,000 lines ( 1,8M) D D D Spearman R: .329
Nassiri et al.(2017) 230 docs ( 60,000) D D D F-Score: 90.5%
Our Work L1: 27,688 docs ( 6.9M)
L2: 576 docs (186,125) D D D D D D
[image:2.595.81.519.61.191.2]L1 Accuracy: 94.8% L2 Accuracy: 72.4%
Table 1: Comparative summary of recent work and our current study on computational readability for Arabic in terms of corpus size, focus on L1 or L2, use of shallow vs. deep features requiring heavier processing for extraction from the text, use of language models in generating features. Results reported are presented for reference rather than direct comparison.
2 Background and Related Work
Computational readability assessment presents a growing body of work leveraging NLP to extract complex textual features, and ML to build read-ability models from corpora, rather than relying on human expertise or intuition (Collins-Thompson, 2014). Approaches vary depending on the purpose of the readability prediction model, e.g., mea-suring readability for text simplification (Aluisio et al., 2010;Dell’Orletta et al., 2014a;Al Khalil et al.,2017), selecting more cognitively-predictive features for readers with disabilities (Feng et al., 2009) or for self-directed language learning ( Bein-born et al., 2012). Features used in predicting readability range from surface features extracted from raw text (e.g. average word count per line), to more complex ones requiring heavier text pro-cessing such as syntactic parsing features ( Heil-man et al., 2007, 2008; Beinborn et al., 2012; Hancke et al.,2012). The use of language models is increasingly favored in the literature over simple frequency counts, ratios and averages commonly used to quantify features in traditional readabil-ity formulas (Collins-Thompson and Callan,2005; Beinborn et al., 2012; François and Miltsakaki, 2012). We evaluate features extracted using both methods in this study.
There is a modest body of work on readability prediction for Arabic with marked differences in modeling approaches pursued, feature complexity, dataset size and type (L1 vs. L2), and choice of evaluation metrics. We build our feature set with predictors frequently used for Arabic readability studies in the literature, and augment it with fea-tures from work carried out on other languages.
We do organize our feature set on two dimensions:
(a)the way features are quantified: basic statistics for frequencies and averages, orlanguage model-ingperplexity scores;(b)thedepth of processing
required to obtain said features: directly from raw text, morphological analysis, or syntactic parsing. In Table1, using these two dimensions, we situate ours and previous work and establish a common baseline of raw base features (i.e. traditional mea-sures (DuBay,2004)) to compare to.
Use of Language Modeling Features such as frequency counts, averages and other ratios seem to dominate the literature for Arabic readability. These are usually referred to as traditional, shal-low, basic or base features in the literature for their simplicity. In contrast, Al-Khalifa and Al-Ajlan (2010) add word bi-gram perplexity scores to their feature set, a popular readability predictor in En-glish and other languages.
3 Features for Readability Prediction
Textual features associated with degree of read-ability range from surface attributes such as text length or average word length, to more com-plex ones quantifying cohesion or higher-level text pragmatics. Naturally, the shallower attributes are also the easiest and least costly to extract from a text, as opposed to the deeper and more computa-tionally challenging features.
Notation We define the notation used in the re-mainder of this paper to describe features, ranges of features and classification feature sets:
• An individual feature is expressed as F[i],i∈
[1,146]is a number assigned to the feature as defined in Table2; e.g., F[1] for number of characters per document
• A feature range is expressed as F[i-j], 1 ≤ i ≤ j ≤ 146and indicates a group of fea-tures similar in nature with numbers assigned to them as defined in Table2
• A classification feature set or subset is ex-pressed as FEAT SuperscriptSubscript . The super-script indicates whether the set contains fea-tures that are {Raw, Morph, Syn or all three Raw.Morph.Syn}. The subscript indicates whether the features are computed as {Base, LM, or both Base.LM} quantities.
The feature list we have compiled (Table2) is inspired by previous work for Arabic and other languages, and is organized by category as dis-cussed in the previous section.
Base features FEAT Base range from shallow
estimates, like word count or average sentence length, to others requiring more advanced process-ing, e.g. average parse tree depth for sentences in a document. LM-based features FEATLM are a
range of 12 perplexity scores obtained on n-gram models (uni-, bi- and tri-grams) built per level of readability. For instance, the first 3 features in the range F[51-62] are the following: F[51] Level 1 character unigrams, F[52] Level 1 character bi-grams, F[53] Level 1 character trigrams.
We also distinguish three category labels for the depth of NLP-based processing required to extract the different features:
• FEAT Raw : raw text extraction with mini-mal processing: Several formulas making use of raw text features have been successfully
8 FEATRawBase* F[1] Characters F[5]SentencesT okens F[2] Tokens F[6] Al-Heeti Formula F[3] Characters/Tokens F[7] ARI Formula F[4] Sentences F[8] AARI Formula
20 FEATM orphBase * F[9] Morphemes F[19] V erbs
T okens
F[10] Lemma Types F[20]P ronounsT okens F[11]LemmaT ypesT okens F[21] Psv. Verbs F[12]M orphemesSentences F[22]P svV erbsT okens F[13] Open-class Tokens F[23] Perf. Verbs F[14] Closed-class Tokens F[24]P erf V erbsT okens F[15] Nouns F[25] Imperf. Verbs F[16] Verbs F[26]Imperf V erbsT okens F[17] Pronouns F[27] Cmd Verbs F[18]T okensN ouns F[28]CmdV erbsT okens
10 FEATSynBase
F[29-36] CATiB dependency F[37] Average parse tree breadth F[38] Average parse tree depth
24 FEATRawLM
F[39-50] LM perplexity of Characters F[51-62] LM perplexity of Words *
48 FEATM orphLM
F[63-74] LM perplexity of morphemes F[75-86] LM perplexity of lemmas F[87-98] LM perplexity of POS
F[99-110] LM perplexity of lemma-POS mix 36 FEATSynLM
[image:3.595.325.509.56.457.2]F[111-122] LM perplexity of CATiB POS F[123-134] LM perplexity of CATiBx POS F[135-146] LM perplexity of CATiB dependency
Table 2: Our feature set organized by category. All features are calculated per document, and sentence level features are averaged per document. Feature sets or features marked by an * are inspired by pre-vious work on Arabic readability.
adopted and adapted in English and other lan-guages, their appeal largely due to them be-ing easy to understand and compute.
• FEAT M orph : morphological analysis pro-viding lexical and morpho-syntactic infor-mation: Readability is heavily influenced by vocabulary and word-level information (DuBay, 2007). Having word-level lexical and morpho-syntactic information can better inform the predictions.
VRB
ÐY®K yqdm ‘offers’
MOD
PNX
.. ‘.’
OBJ
NOM
@QJ»kθyrA ‘plenty’
MOD
PRT
áÓmn ‘from’
OBJ
NOM
ðPYË@Aldrws ‘lessons’
MOD
PRT +ðw+
‘and’
OBJ
NOM
HA ¢ªË@AlςDAtˇ ‘sermons’
MOD
PRT
Èl ‘to’
OBJ
NOM
A K+ +nA ‘us’
SBJ
NOM
t'PAJË@AltAryx ‘History’
Word Morph POS6 English
Lemma Morph POS POS34
1 AltAryx Al+tAriyx+u NOM history
tAriyx DET+NOUN noun
+CASEDEF.N OM
2 yqdm yu+qad∼im+u VRB offers
qad∼am IV3MS+IV verb
+IVSUFFM OOD:I
3 lnA la+nA PRT to, for
li PREP prep us
+PRON1P
4 kθyrA kaθiyr+Aã NOM plenty,
kaθiyr ADJ adj many
+CASEIN DEF.ACC
5 mn min PRT from, of
min PREP prep
6 Aldrws Al+duruws+i NOM lessons
dars DET+ NOUN noun
+CASEDEF.GEN
7 wAlςDAtˇ wa+Al+ςi ˇD+At+i NOM sermons
ςi ˇDa¯h CONJ+DET+NOUN noun +NSUFFF EM.P L
+CASEDEF.GEN
8 . . PNX .
. PUNC punc
FEATRawBaseFeatures computed for the example sentence
[image:4.595.102.507.62.401.2]F[1] Characters 35 F[5]SentencesT okens 8.0 F[2] Tokens 8 F[6] Al-Heeti FormulaF[3]×4.414−13.468 5.8 F[3]CharactersT okens 4.4 F[7] ARI FormulaF[3]×4.71 +F[5]×0.5−21.43 3.2 F[4] Sentences 1 F[8] AARI FormulaF[1]×3.28+F[3]×10461.43+.3F[5]×1.24+472.42 0.6
Figure 1: TOP: Example of linguistic annotations for the sentence
.
HA ¢ªË@ð ðPYË@ áÓ @QJ» A JË ÐY®K t'PAJË@
‘History offers us plenty of lessons and sermons.’; BOTTOM: Table of FEATRawBasefeature values com-puted for the example sentence given.
2007)
In Table 2, most base features are computed simply by counting occurrences within the doc-ument. Ratios are expressed as mathematical fractions, such as F[3], F[5], F[11] and so on. LM perplexity is computed per readability level(1, 2, 3, and 4) on (uni-, bi- and tri-)grams laguage models, generating 4 level scores per n-gram and a total of 12 perplexity scores per fea-ture. Figure 1gives an idea of the linguistic an-notation extracted for an example sentence and il-lustrates how feature values are computed for the FEATRawBase subset. The annotation was generated using the CamelParser. POS tagsets used are POS6
(Habash and Roth,2009) and a higher granularity POS34(Habash et al.,2012). We refer the user to
Shahrour et al.(2016) for further details.
We elaborate next on the feature names in Ta-ble2:
• F[6] Al-Heeti readability formula for Ara-bic as presented byAl-Khalifa and Al-Ajlan
(2010) and other subsequent work.
• F[7], F[8] represent the Automated Readabil-ity Index (ARI) readabilReadabil-ity formula for En-glish, and the Arabic ARI (AARI) readability formula for Arabic, both discussed at length byAl Tamimi et al.(2014).
• F[9] Morphemes - approximated by counting proclitics+enclitics+stemfor any given token, first explored byCavalli-Sforza et al. (2014) andForsyth(2014), further tested by Saddiki et al.(2015) andNassiri et al.(2017).
• All features in FEAT M orphBase.LM follow the MADAMIRA POS34 tag set (Pasha et al.,
2014).
• F[13], F[14] Open and closed class tokens are determined by POS34tag
readers of Arabic. It is also a frequently used indicator of difficult or poor readability in other languages (DuBay,2007;Aluisio et al., 2010).
• F[23-28] Marking verb aspect (perfective, imperfective, imperative) as an indicator used with some success in other languages (Dell’Orletta et al.,2014a).
• F[29-36] Columbia Arabic Treebank (CATiB) tagset (Habash and Roth,2009).
• F[63-74] A morpheme language model is generated with the higher granularity Morph-POS tagset (illustrated in Figure1) based on (Buckwalter,2002).
• F[99-110] A lemma-POS mixed language model is generated with the lemma of open-class tokens and the POS34 (Habash et al.,
2012) for closed-class tokens.
• F[111-122] A POS-based language model is generated with the CATiB POS tagset (Habash and Roth,2009).
• F[123-134] A POS-based language model is generated with the extended CATiB POS tagset presented in (Marton et al.,2013).
• F[135-146] A dependency language model is generated on the CATiB dependency tags in F[29-36] to get different levels of dependency context information, the most salient one be-ing dependency information for parent-child nodes in the parse tree.
4 Modeling Readability
We evaluate readability prediction as a classifica-tion problem on a large feature set for documents in two text corpora designed for L1 and L2 read-ing, and labelled with readability levels 1, 2, 3 and 4 in increasing difficulty.
4.1 L1 and L2 Data
We leverage the L1 leveled reading corpus built byKhalil et al.(2018) based on grades 1 through 12 of an Arabic school curriculum and a collec-tion of adult-level ficcollec-tion. The corpus was split across 4 levels of readability in increasing order of difficulty: level 1 (905 documents), level 2 (1,192 documents), level 3 (2,054 documents) and level 4 (18,089 documents). The first three levels are sourced from curricular texts, grades 1-4, 5-8 and
9-12. The fourth considerably larger level contains novels suitable for post-secondary readers.
For L2, we work with an augmented version of the corpus used byForsyth(2014),Saddiki et al. (2015) andNassiri et al. (2017). It is comprised of 576 documents, leveled according to the Intera-gency Language Roundtable (ILR) scale for for-eign language proficiency.1 With documents in the L2 corpus averaging 250 words, the L1 cor-pus was split accordingly for better comparability in our experiments.
Both the L1 and L2 datasets underwent an 80-10-10 random stratified split over the four levels for training (80%), development (10%) and testing (10%). The L1 corpus, partially sourced from text-book material from three different subjects, was also split across the three subjects to ensure a bal-anced sample of all three: Arabic, Social Studies, Islamic Studies.
4.2 Feature Extraction
The datasets are first enriched with several layers of linguistic annotation (e.g. Fig. 1) in prepara-tion for feature extracprepara-tion. Then, both raw text and annotations from the training set are used to build LMs for each of the 4 levels of readability (Table 3) with the SRILM toolkit (Stolcke et al., 2002). At this point, we begin extracting features from the various configurations of annotation and language models we generated:
• FEATRawBase.LM features are extracted directly from the raw text, e.g. total number of char-acters in a document.
• FEATM orphBase.LMtext is annotated with
morpho-logical, lexical and morpho-syntactic infor-mation using the MADAMIRA tool (Pasha et al., 2014) for morphological disambigua-tion.
• FEAT SynBase.LM text is annotated with syn-tactic parsing information using the Camel-Parser tool (Shahrour et al.,2016).
All FEAT Raw.M orph.SynBase features are obtained from computing occurrences, averages and other ratios over: raw text (FEAT RawBase);
lemmatiza-tion, tokenization and morpho-syntanctic annota-tion (FEAT M orphBase ); syntactic parsing annotation (FEAT SynBase). All FEAT Raw.M orph.SynLM features
1The scale goes from 0 (no proficiency) to 5 (native
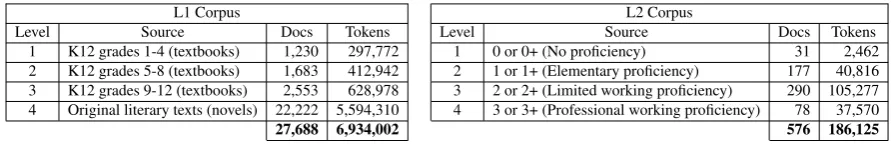
L1 Corpus L2 Corpus
Level Source Docs Tokens Level Source Docs Tokens
1 K12 grades 1-4 (textbooks) 1,230 297,772 1 0 or 0+ (No proficiency) 31 2,462 2 K12 grades 5-8 (textbooks) 1,683 412,942 2 1 or 1+ (Elementary proficiency) 177 40,816 3 K12 grades 9-12 (textbooks) 2,553 628,978 3 2 or 2+ (Limited working proficiency) 290 105,277 4 Original literary texts (novels) 22,222 5,594,310 4 3 or 3+ (Professional working proficiency) 78 37,570
[image:6.595.75.521.61.133.2]27,688 6,934,002 576 186,125
Table 3: Descriptive corpus statistics for our L1 and L2 data.
are obtained from computing perplexity scores per document over the LMs generated using either raw text or text annotation (lemmas, POS, etc).
In total, there were 146 features extracted for each document. We perform three main experi-ments, described next, to determine their efficacy in the classification task for L1 and L2.
4.3 Experiment Setup
First, we build classifiers on the full feature set FEAT Raw.M orph.SynBase.LM to determine best perfor-mance for L1 and L2. All classification exper-iments are carried out within the WEKA envi-ronment (Hall et al., 2009). We test classifica-tion algorithms used with some success in previ-ous work (D.Treedecision tree,Rnd.Frandom for-est,kNNk-nearest-neighbour,SVMsupport vector machine). We include two baseline classifiers for reference:zeroR(a simple classifier predicting the majority class for all instances) andoneR(a 1-rule classifier using the feature with least error to pre-dict the correct class).
Then, we test the performance of the feature subsets to assess the predictive power of different feature configurations for L1 and L2. We perform feature selection in two ways:
• Manually, following the categorization we defined in Table 2 and resulting in 12 com-binations of feature sets to be tested: feature subsets (i, j) with i in {Raw, Morph, Syn} and j in {Base, LM} with FEATRawBaseas the per-formance baseline for evaluating all feature subsets; composite subsets (i) with i in {Raw, Morph, Syn} or (j) in {Base, LM}; and fi-nally the full feature set FEATRaw.M orph.SynBase.LM . • Automatic feature selection using correlation-based feature selection (CFS) FEAT CorrelBase.LM implemented as CfsSubsetE-val in WEKA with a BestFirst backward search through the feature space (Hall, 1999).
Finally, we experiment with the potential of us-ing L1 FEAT Raw.M orph.SynLM to improve L2
read-ability predictions. First, we calculate perplexity scores for L2 documents using L1 LMs. We add these perplexity scores as features to the original L2 feature set, bringing the total set size to 254 features. Then, using this FEAT Raw.M orph.SynBase.LM.LM
L1
feature set, we: (1) rerun the classifier mance experiment to see if any overall perfor-mance improvement is achieved; (2) run CFS fea-ture selection on the L1-based LM subset to ex-amine which features correlate the most with L2 readability classes. All experiments are reported in terms of F-score in addition to % Accuracy and F-score to give a better sense of prediction perfor-mance while accounting for class imbalance in the corpus.
5 Results and Discussion
In this section we present and discuss the results of experiments previously described in Section 5.3, which we organize as follows: results to optimize for classifier choice, results to optimize for fea-tures choice, and finally results on leveraging L1-based features for L2 readability prediction.
5.1 Classifier Choice Optimization
The classification results in Table 4 show that SVM performs best on overall accuracy for both L1 and L2 predictions. For L1, SVM achieves er-ror reduction of 76% to the zeroR baseline, 64 % to the oneR baseline, while outperforming other classifiers from the literature by varying degrees. Performance over the 4 levels of readability, mea-sured in precision, recall and F-score, is as fol-lows:
• Precision: Level 1 (78.3%), Level 2 (81.8%), Level 3 (89.4%) and Level 4 (97.5%)
• Recall: Level 1 (78.8%), Level 2 (68.9%), Level 3 (81.7%) and Level 4 (100%)
• F-score: Level 1 (78.5%), Level 2 (74.8%), Level 3 (85.4%) and Level 4 (98.7%)
ma-L1FEATRaw.M orph.SynBase.LM L2FEATRaw.M orph.SynBase.LM
Accuracy Average F1 Accuracy Average F1
ZeroR 77.9 21.9 ZeroR 50.0 16.7
OneR 85.4 52.1 OneR 34.5 24.4
D.Tree (C=0.25, M=12) 72.2 50.4 D.Tree (C=0.25, M=2) 31.0 21.7
Rndm Frst (I=500) 94.6 83.6 Rndm Frst (I=100) 50.0 55.0
kNN (k=9) 93.8 80.4 kNN (k=2) 67.2 61.1
[image:7.595.97.507.63.152.2]SVM (C=5.0, rbfKernel) 94.8 84.4 SVM (C=1.0, rbfKernel) 72.4 60.5
Table 4: Comparison of different classifiers using the full feature set FEATRaw.M orph.SynBase.LM for L1 (left) and L2 (right). Baseline performance is that of classifiers ZeroR and OneR. Performance is reported in terms of Accuracy (%) and F1-score (%) averaged over the 4 classification levels.
L1 SVM Classifier
Feature Subset Accuracy Average F1
FEATRaw.M orph.SynBase.LM 94.8 84.4
FEATRaw.M orph.SynLM 94.3 83.3 FEATM orphBase.LM 94.3 83.1 FEATM orphLM 93.8 81.6 FEATRawBase.LM 88.6 61.4 FEATRawLM 87.2 50.5 FEATCorrelBase.LM 85.3 42.6 FEATRaw.M orph.SynBase 83.4 40.7 FEATSynBase.LM 82.7 39.7 FEATSynLM 82.0 37.3 FEATM orphBase 81.8 33.7 FEATRawBase 79.3 28.1
[image:7.595.89.273.224.404.2]FEATSynBase 78.0 22.5
Table 5: Comparison of different feature subsets using SVM Classifier for L1 (based on best per-formance results from Table 4). Baseline perfor-mance is that of subset FEATRawBase. Performance is reported in terms of Accuracy (%) and F1-score (%) averaged over the 4 classification levels.
jority mostly off by no more than 1 level. For intance, the bulk of misclassified documents for Level 1 are labeled as Level 2. This can be in part due to the high similarity between the high-est grade in Level 1 (Grade 4) and the lowhigh-est grade in Level 2 (Grade 5), considering that Level 2 contains both Primary and Preparatory grades. Another typically misclassified document type is one containing mainly instructional text and in-tended learning outcomes for the lessons. This is a language and style of writing that is particu-lar to textbooks and repeated throughout the cur-riculum. Level 2 shows more dispersion in the misclassifications across other levels. Considering that Level 2 combines a portion of upper Primary and lower Preparatory grades, we expect some in-terference from the proximity in style and content in Grade4-Grade5 and Grade8-Grade9. The
inclu-L2 SVM Classifier
Feature Subset Accuracy Average F1
FEATRaw.M orph.SynBase.LM 72.4 60.5
FEATRaw.M orph.SynBase 70.7 38.6 FEATRaw.M orph.SynLM 67.2 53.7 FEATCorrelBase.LM 67.2 37.3 FEATM orphBase.LM 67.2 36.4 FEATSynBase.LM 67.2 35.7 FEATRawBase.LM 63.8 35.1 FEATM orphLM 63.8 34.6 FEATRawLM 60.3 33.2 FEATM orphBase 51.7 19.6 FEATSynLM 50.0 16.9 FEATRawBase 50.0 16.7
FEATSynBase 50.0 16.7
Table 6: Comparison of different feature subsets using SVM Classifier for L2 (based on best per-formance results from Table 4). Baseline perfor-mance is that of subset FEATRawBase. Performance is reported in terms of Accuracy (%) and F1-score (%) averaged over the 4 classification levels.
sion of more excerpts of original literary texts, es-pecially in the Preparatory grades, could help ex-plain why Level 4 predictions were obtained for some documents. Level 3 classification errs pre-dominantly towards Level 4, this is also a plausible outcome considering that Arabic textbooks delve further into literature and include much longer ex-cerpts of original fiction, and keeping in mind that some works of fiction are plausibly accessible to readers nearing the end of their K12 education.
Results for L2 remain consistent with 45% and 58% error reduction to the zeroR and oneR base-lines, respectively.
[image:7.595.324.508.225.405.2]accord-L2FEATRaw.M orph.SynBase.LM L2FEATRaw.M orph.SynBase.LM.LM L1
Accuracy Average F1 Accuracy Average F1
ZeroR 50.0 16.7 50.0 16.7
OneR 34.5 24.4 34.5 24.4
D.Tree 31.0 21.7 31.0 21.7
R.Forest 50.0 55.0 72.4 67.9
kNN 67.2 61.1 74.1 66.2
SVM 72.4 60.5 72.4 60.5
Table 7: L2 results with different classifiers on FEAT Raw.M orph.SynBase.LM.LM
L1. Comparison of
differ-ent classifiers using the augmdiffer-ented feature set FEATRaw.M orph.SynBase.LM.LM
L1 for L2 (L2 features + L1 LM
features). Baseline performance is that of classi-fiers ZeroR and OneR. Performance is reported in terms of Accuracy (%) and F1-score averaged over the 4 classification levels.
ing to the scale in3). Evaluating L2 readability is a worthwile experiment which is hindered mostly by data sparsness.
5.2 Feature Optimization
Feature optimization experiments are carried out with SVM classification using the best perform-ing parameter configurations for L1 and L2. Ta-bles5 and6show performance results of various feature subsets in comparison with the baseline FEAT RawBase. We make the following noteworthy
observations:
• A combination of LM-based, NLP-based and traditional features FEATRaw.M orph.SynBase.LM per-forms best in readability prediction: 75% and 45% error reduction on FEATRawBasefor L1 and
L2 respectively
• LM Features FEATRaw.M orph.SynLM are better predictors than base features: performance is second-best for L1 and third-best for L2
• NLP-based features (FEAT Raw.M orph.SynLM , FEAT M orphBase.LM, FEAT SynBase.LM) are bet-ter predictors than raw shallow features FEATRawBase: this is true overall, with heavier influence in L2 prediction
• Features based on syntactic parsing FEAT SynBase.LM inform readability pre-dictions, more so for L2 than for L1: 16% and 34% error reduction on FEAT RawBase for L1 and L2 respectively
FEATCorrelBase.LMfor L1 is a subset of 10 features2
achieving 29% error reduction on the FEAT RawBase
2L1 CFS-based subset of 10 features: F[41, 56, 58, 61,
62, 68, 71, 86, 123, 141], numbered according to Table2
baseline. All features are LM-based, with 50% of them extracted from raw text, ideal for low-cost performance with minimal NLP effort. This can be useful in lightweight web-based readabil-ity tools. We also noted with interest an 80%-20% split into vocabulary-based and syntax-based features, suggesting that vocabulary plays a more dominant role in readability than grammar.
FEATCorrelBase.LMfor L2 achieves 34% error reduc-tion on the FEATRawBasebaseline with 29 features,3
dominated largely by LM-based attributes. Some interesting predictive features from FEAT M orphBase
are lemma type count per document indicating lex-ical richness, Verb-to-Token ratio and Pronoun-to-Token ratio. Mixed LMs built with lemmas of open-class tokens and the POS of closed-class tokens for readability levels 2, 3 and 4 correlate highly with L2 predictions but did not figure in L1 FEATCorrelBase.LM which relied more on raw word LMs.
5.3 L1-based Features for L2 Readability
Table7presents the results of augmenting L2 with L1 LM-based features. Adding L1 features to the L2 feature set did not degrade performance for any of the classifiers. While D.Tree and SVM classifi-cation did not show any significant improvement, the L1 features drastically improved prediction ac-curacy and F-score for Random Forest (Acac-curacy: 45% error reduction, F-score: 28.6% error reduc-tion) and kNN (Accuracy: 21% error reduction, F-score: 13% error reduction) classification.
Looking into LM-based L1 features4 that cor-relate the most with L2 readability levels, we find that the most predictive of these features are mostly based on L1 readability levels 1 and 4, and distributed among raw character features, word features (raw and lemma), POS features, and pars-ing dependency features. Results from L2 uspars-ing L1 encourage further exploration of L1 feature use in L2 readability prediction. It is worthwhile to explore the performance of classifying L1 docu-ments on an L2 scale validated by expert judg-ment. Given the considerably smaller size of L2 resources in comparison with L1 texts, we can po-tentially mine L1 for L2-suitable material, thereby increasing the pool of texts available to L2 readers.
3L2 CFS-based subset of 29 features: F[10, 19, 20, 26,
37, 41, 47, 50, 55, 56, 58, 59, 62, 65, 67, 68, 73, 74, 82, 83, 86, 97, 103, 107, 109, 113, 124, 134, 137].
4L2 subset of L1-based features: F[46-50, 53, 55, 76, 85,
[image:8.595.74.288.61.141.2]6 Conclusion and Future Work
We have presented the largest and most in-depth computational readability study for Arabic to date. We studied a wide set of features with varying depths from shallow words to syntactic trees for both L1 and L2 readability tasks. Our best L1 Readability accuracy result is 94.8% (75% error reduction from a commonly used baseline). The comparable results for L2 are 72.4% (45% error reduction). We demonstrated the added value of using L1 features for L2 readability prediction by increasing the L2 accuracy to 74.1% (an additional 6% error reduction).
The next step in improving model robustness and performance would be to address the dataset imbalance among the four levels for both L1 and L2 by adjusting sampling (He and Garcia,2009). We are also considering a cost-sensitive prediction model: for instance, by assigning different costs to misclassification scenarios, we can penalize the model more heavily for errors in sparser levels.
In the future, we plan to employ our best results in the development of online tools to support an effort for text simplification for pedagogical pur-poses. Going forward in this direction, we expect to widen our range to include different levels of document granularity: 500-word to 1K-word size documents, as well as sentence-level readability (Dell’Orletta et al.,2014b).
References
Hend S Al-Khalifa and Amani A Al-Ajlan. 2010. Au-tomatic readability measurements of the Arabic text: An exploratory study. Arabian Journal for Science and Engineering, 35(2 C):103–124.
Muhamed Al Khalil, Nizar Habash, and Hind Saddiki. 2017. Simplification of Arabic masterpieces for ex-tensive reading: A project overview. Procedia Com-puter Science, 117:192–198.
Abdel Karim Al Tamimi, Manar Jaradat, Nuha Al-Jarrah, and Sahar Ghanem. 2014. AARI: automatic Arabic readability index. Int. Arab J. Inf. Technol., 11(4):370–378.
Sandra Aluisio, Lucia Specia, Caroline Gasperin, and Carolina Scarton. 2010. Readability assessment for text simplification. In Proceedings of the NAACL HLT 2010 Fifth Workshop on Innovative Use of NLP for Building Educational Applications, pages 1–9. Association for Computational Linguistics.
Lisa Beinborn, Torsten Zesch, and Iryna Gurevych. 2012. Towards fine-grained readability measures for self-directed language learning. InProceedings of the SLTC 2012 workshop on NLP for CALL; Lund;
25th October; 2012, 080, pages 11–19. Linköping University Electronic Press.
Tim Buckwalter. 2002. Buckwalter Arabic Morpho-logical Analyzer Version 1.0. Linguistic Data Con-sortium, University of Pennsylvania, 2002. LDC Catalog No.: LDC2002L49.
Violetta Cavalli-Sforza, Mariam El Mezouar, and Hind Saddiki. 2014. Matching an Arabic text to a learn-ers’ curriculum. InProc. 5th Int. Conf. on Arabic Language Processing (CITALA), Oujda, Morocco, pages 79–88.
Kevyn Collins-Thompson. 2014. Computational as-sessment of text readability: A survey of current and future research. ITL-International Journal of Ap-plied Linguistics, 165(2):97–135.
Kevyn Collins-Thompson and Jamie Callan. 2005. Predicting reading difficulty with statistical lan-guage models. Journal of the Association for Infor-mation Science and Technology, 56(13):1448–1462.
Felice Dell’Orletta, Simonetta Montemagni, and Giulia Venturi. 2014a. Assessing document and sentence readability in less resourced languages and across textual genres. ITL-International Journal of Applied Linguistics, 165(2):163–193.
Felice Dell’Orletta, Martijn Wieling, Giulia Venturi, Andrea Cimino, and Simonetta Montemagni. 2014b. Assessing the readability of sentences: Which cor-pora and features? InBEA@ ACL, pages 163–173.
William H DuBay. 2004. The Principles of Readabil-ity. Impact Information.
William H DuBay. 2007.Unlocking Language. Impact Information.
Mahmoud El-Haj and Paul Rayson. 2016. Osman: A novel Arabic readability metric. In Proceed-ings of the Tenth International Conference on Lan-guage Resources and Evaluation (LREC 2016), Paris, France. European Language Resources Asso-ciation (ELRA).
Lijun Feng, Noémie Elhadad, and Matt Huenerfauth. 2009. Cognitively motivated features for readability assessment. InProceedings of the 12th Conference of the European Chapter of the Association for Com-putational Linguistics, pages 229–237. Association for Computational Linguistics.
Jonathan Forsyth. 2014. Automatic readability predic-tion for modern standard Arabic. In Proceedings of the First Workshop on Free/Open-Source Ara-bic Corpora and Corpora Processing Tools (LREC 2014), Reykjavik, Iceland.
Thomas François and Eleni Miltsakaki. 2012. Do nlp and machine learning improve traditional readabil-ity formulas? In Proceedings of the First Work-shop on Predicting and Improving Text Readability for target reader populations, pages 49–57. Associ-ation for ComputAssoci-ational Linguistics.
Nizar Habash and Ryan M Roth. 2009. CATiB: The Columbia Arabic Treebank. InProceedings of the ACL-IJCNLP 2009 Conference Short Papers, pages 221–224. Association for Computational Linguis-tics.
Nizar Y Habash. 2010. Introduction to Arabic natural language processing, volume 3. Morgan & Clay-pool Publishers.
Mark Hall, Eibe Frank, Geoffrey Holmes, Bernhard Pfahringer, Peter Reutemann, and Ian H Witten. 2009. The weka data mining software: an update. ACM SIGKDD explorations newsletter, 11(1):10– 18.
Mark Andrew Hall. 1999. Correlation-based feature selection for machine learning. Ph.D. thesis, Uni-versity of Waikato Hamilton.
Julia Hancke, Sowmya Vajjala, and Detmar Meurers. 2012. Readability classification for german using lexical, syntactic, and morphological features. In COLING, pages 1063–1080.
Haibo He and Edwardo A Garcia. 2009. Learning from imbalanced data. IEEE Transactions on knowledge and data engineering, 21(9):1263–1284.
Michael Heilman, Kevyn Collins-Thompson, Jamie Callan, and Maxine Eskenazi. 2007. Combining lexical and grammatical features to improve read-ability measures for first and second language texts. In Human Language Technologies 2007: The Con-ference of the North American Chapter of the Asso-ciation for Computational Linguistics; Proceedings of the Main Conference, pages 460–467.
Michael Heilman, Kevyn Collins-Thompson, and Maxine Eskenazi. 2008. An analysis of statistical models and features for reading difficulty prediction. In Proceedings of the Third Workshop on Innova-tive Use of NLP for Building Educational Applica-tions, pages 71–79. Association for Computational Linguistics.
Muhamed Al Khalil, Hind Saddiki, Nizar Habash, and Latifa Alfalasi. 2018. A Leveled Reading Corpus of Modern Standard Arabic. InProceedings of the In-ternational Conference on Language Resources and Evaluation (LREC 2018).
Yuval Marton, Nizar Habash, and Owen Rambow. 2013. Dependency parsing of modern standard Ara-bic with lexical and inflectional features. Computa-tional Linguistics, 39(1):161–194.
Naoual Nassiri, Abdelhak Lakhouaja, and Violetta Cavalli-Sforza. 2017. Modern standard Arabic readability prediction. InInternational Conference on Arabic Language Processing, pages 120–133. Springer.
Arfath Pasha, Mohamed Al-Badrashiny, Mona Diab, Ahmed El Kholy, Ramy Eskander, Nizar Habash, Manoj Pooleery, Owen Rambow, and Ryan M Roth. 2014. MADAMIRA: A Fast, Comprehensive Tool for Morphological Analysis and Disambiguation of Arabic. InProceedings of the Language Resources and Evaluation Conference (LREC), Reykjavik, Ice-land.
Hind Saddiki, Karim Bouzoubaa, and Violetta Cavalli-Sforza. 2015. Text readability for Arabic as a for-eign language. In Proceedings of the IEEE/ACS 12th International Conference of Computer Systems and Applications (AICCSA), Marrakech, Morocco, pages 1–8. IEEE.
Anas Shahrour, Salam Khalifa, Dima Taji, and Nizar Habash. 2016. Camelparser: A system for arabic syntactic analysis and morphological disambigua-tion. InProceedings of COLING 2016, the 26th In-ternational Conference on Computational Linguis-tics: System Demonstrations, pages 228–232.